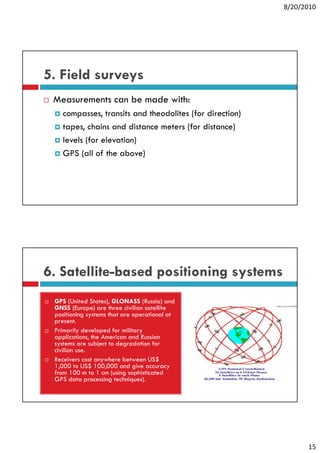
8/20/2010


                 DATA ACQUISITION and
                 PREPARATION

Engr. Ablao      GE517 Geographic Information System


    On data input
    … refers to the process of converting both paper and
    digital geographic data into a format compatible and
    useful to a GIS.
    Data input is the bottleneck of GIS operations.
      data input is slow, expensive and prone to error
      cost of data and its conversion is often up to 80 per cent of the
      total GIS cost
      data conversion requires careful planning and constant
      management
      the GIS is only as good as the data that it has at its disposal


                                                                                 1
8/20/2010


Issues in data input
 Data sources are varied
    topographic and cadastral maps
    t         hi    d d t l
    aerial photography and satellite imagery
    field sheets and census information
    etc.
 Source data is at different scales and map projection
 GIS involves encoding of spatial and non-spatial data
                       g      p             p
 Automation of data conversion only partly successful, but could
 revolutionize the process
 More and more spatial data are becoming available in digital form


Prior to data input
  Definition of data requirements
                       q
  Operational planning and estimates
  Data preparation
  Data Input
  Editing


                                                                            2
8/20/2010


       Data Sources


 Data Sources
Maps


                             3
8/20/2010


  Data Sources
Census        May be spatial in character
and           if each item has a spatial
              reference, allowing its
Survey        location on the Earth to be
Data          identified
              Usually in tabular format
                     y
              Examples: population
              census, employment data,
              agricultural census data,
              marketing data


  Aerial Photographs
Aerial Photographs and
             g p
Satellite Images
    First method of remote sensing
    A ‘snapshot’ of the Earth at a
    particular instant in time
    May be used as a background or
    base map for other data in a GIS
       Provides spatial context and aids
       in interpretation
    Versatile, relatively inexpensive
    and detailed source of data for
    GIS


                                                   4
8/20/2010


    Data Sources
Ground/        Using tapes transits,
                     tapes, transits
               theodolites, total stations, etc.
Land           Used to collect field data
Surveying      such as coordinates,
Data           elevations, and distances
               Data collected are in analog
               format (written down in
               paper) which still need to be
               transformed to digital format
               for use in GIS


    Data Sources
GPS           Relatively new technique of
(Global       field data collection
Positioning   Originally designed for real-
              time navigation
Systems)      Can store collected
Data          coordinates and associated
              attribute information, which
              may be downloaded directly
              into a GIS database
              Accuracy ranges from 100
              meters to a few centimeters


                                                          5
8/20/2010


Categories of Geographic Data Acquisition
  Primary – collected through first-hand observation
                              first hand
  Secondary – data collected by another individual
  or organization; most are published data


Primary Raster and Vector Data
Raster Data
    satellite images
    scanned aerial photographs
Vector Data
    Land survey points
    GPS observation data


                                                              6
8/20/2010


            Methods of Data Input


     Methods of Data Input
1.    Raster Data Acquisition
          Scanning
          Photogrammetry
          Remote sensing
2.    Vector Data Acquisition
          Manual digitizing
          Computer-assisted
          Computer assisted digitizing
          Field surveying
          GPS surveying
3.    Attribute Data Acquisition
          Keyboard entry


                                                7
8/20/2010


Methods of data input
 Keyboard entry
 Manual or operator-assisted digitizing
 Scanning
 Photogrammetric methods
 Satellite remote sensing systems
 Field
 Fi ld survey
 Satellite positioning systems
 Other computer systems


1. Keyboard entry
 Keyboard entry is primarily used for entering
 tabular data into the GIS database
                            database.
 Typical attribute data sets entered may be:
    vegetation classes
    polygon identifiers
    soil types
    topographic detail
 The f
  h form of this data may be:
          f h d           b
    numeric
    alpha-numeric
    logical


                                                        8
8/20/2010


2.a. Manual digitizing
Conventional digitizing is the manual process of converting geographic map
data into digital form.
The digitizing process is as follows:
   Map is placed on a flat digitizing tablet and affixed using tape.
   Operator identifies control (tic) points which have known geographic locations.
   Usually four or more points are identified.
   Operator digitizes the control points by moving the cursor to each location and
   then activating the digitizer by pressing a button.
   Software then performs calibration to enable any features digitized to be
   transformed into true geographic coordinates.
   Map features are then digitized by tracing their boundaries and activating the
   digitizer as required.


2.a. Manual digitizing
  Digitizing modes
      Point mode - the operator activates the button each time they want a
      location recorded
      Stream mode - a continuous stream of coordinates are recorded during the
      digitizing process with no need to activate a record button. The rate of
      sampling can be controlled by time or distance intervals.
  Digitizing accuracy
      Sources of errors: original map errors, internal digitizer errors, operator
      S          f          i i l             i t    l di iti                 t
      errors and control point errors.
      Digitizing accuracy = 1 mm x map scale
      e.g., Digitizing accuracy = 1 mm x 50,000 = 50 m


                                                                                            9
8/20/2010


2.b. Operator-assisted digitizing
 Also known as heads-up digitizing because the
                  heads up
 operator works with his head up looking at the screen
 rather than with his head down following the cursor on
 a digitizing tablet.
 It is said to be 10 times faster than manual digitizing
                                              digitizing.


2.b. Operator-assisted digitizing
The process is as follows:
  A map is scanned into a computer system and resides in
  raster format.
  The map is displayed on the screen for the operator to use as
  a reference.
  The operator moves the cursor to a position at the start of a
  line or contour and activates the computer software.
                                       p
  The computer software takes over and converts the raster
  data to vector by following the pixels until there is a break.
  When it stops, operator moves cursor to a new line.


                                                                         10
8/20/2010


      11
8/20/2010


3. Scanning
 Scanning i an
 S     i is
 automated process
 of converting from
 paper-based
 products to digital
 formats.
 formats


                             12
8/20/2010


3. Scanning
In the scanning process:
  a map is passed through a scanning system which h a number of scanning
          i        d h      h        i            hi h has       b    f      i
  detection units;
  the detection units “detect” the reflected light emitted from features on the
  map;
  the reflected light is converted to a reflectance value
  the image can then be converted to vector format and edited
Scanner types:
  pass-through
        h     h
  drum (normally used for large maps)
  flat bed (normally used for small maps)
  aperture card


3. Scanning
 Characteristics of scanners
   data f
   d    format - gray scale or color
                            l       l
   resolution - generally given in dots-per-inch (dpi)
   scan speed - a function of scanner memory and transfer rate to
   storage device
   thresholding - ability to control the scanner’s sensitivity to various
   features and colors
 Note on scanning
                g
   Requires expensive scanners
   Requires large hard disk space
   Requires powerful workstations


                                                                                    13
8/20/2010


4. Photogrammetry and remote sensing
Both are concerned with
collecting geographic data using
remote means.
Planimetric and topographic
information are usually derived
from aerial photographs.
Land cover and other information
are usually derived from satellite
imagery.
Scanned aerial photographs and
remotely sensed data are in
digital raster format already.


5. Field surveys
   Traditionally, field measurements are made by
   surveyors or field staff who use specialized equipment
   and procedures for gathering geographic data.
   Field measurements usually include:
       measurements of distance and direction
       measurements in both horizontal and vertical planes


                                                                   14
8/20/2010


5. Field surveys
 Measurements can be made with:
    compasses, transits and theodolites (for direction)
    tapes, chains and distance meters (for distance)
    levels (for elevation)
    GPS (all of the above)


6. Satellite-based positioning systems
 GPS (U d States), GLONASS (R
       (United S    )            (Russia) and
                                         ) d
 GNSS (Europe) are three civilian satellite
 positioning systems that are operational at
 present.
 Primarily developed for military
 applications, the American and Russian
 systems are subject to degradation for
 civilian use
          use.
 Receivers cost anywhere between US$
 1,000 to US$ 100,000 and give accuracy
 from 100 m to 1 cm (using sophisticated
 GPS data processing techniques).


                                                                15
8/20/2010


7. Electronic Data Transfer
 Used when data is
 already in digital form
 Usually followed by data
 conversion, particularly
 when the transferred
 data is in a different
 format than what is
 required


7. Electronic Data Transfer
 Some local data that are available, include:
   Municipal boundaries, 1:250,000 (P70,000)
   100-m contours, 1:250,000 (P50,000)
   Barangay boundaries (from NSO)


                                                      16
8/20/2010


     Data Editing


Data Editing
 Errors and inaccuracies during data acquisition and
 input translate into errors in the GIS
 Before further analyses are made, these errors
 should be corrected to prevent the errors from
 propagating t generated information
          ti to           t di f      ti


                                                             17
8/20/2010


Errors in data input
Entity error
   missing entities
   incorrectly-placed entities
   disordered entities
Attribute error
   using the wrong code for an attribute
   misspellings
     i    lli
Entity-attribute agreement (logical consistency) error
   correct code is linked to the wrong entity


Entity errors
  All entities that should have been entered are present.
                                                 p
  No extra entities have been digitized.
  The entities are in the right place and are of the correct shape and
  size.
  All entities that are supposed to be connected to each other are.
  All polygons have only a single label point to identify them.
  All entities are within the outside boundary identified with
  registration marks.


                                                                               18
8/20/2010


Entity errors                   Attribute errors
  Pseudo-nodes                    Missing attributes
  Dangling node
    undershoot
                                  Incorrect attribute values
    overshoot                   Other problems
  Missing labels and too many     Projection changes
                                     j           g
  labels
  l b l
  Sliver polygons                 Edge matching
  “Weird” polygons                Rubber sheeting


                                                                     19
8/20/2010


Joining Adjacent Layers
 Needed when there are multiple map sheets to be
 used
 Ensures that all layers form a continuous geographic
 database when joined together


Data Conversion
 After input and editing of individual datasets, it is
         p              g                       ,
 usually necessary to process the data before
 integrating them all into a single GIS
 Process of converting data on one form to a more
 useful format for the specific GIS application
                        p            pp
 One of the most tedious, time-consuming, and error-
 prone processes in GIS


                                                               20
8/20/2010


Raster to Vector Conversion
 Vectorization
 Converting scanned raster images to vector features
 (point, line, or polygons)
 Results are visually problematic most of the time


Raster Line Thinning
 ‘skeletonizing’
  skeletonizing
 Process of reducing raster linear features into unit
 width


                                                              21
8/20/2010


Line Smoothing
     Employed to make the resulting
     vectors more visually appealing
      during raster to vector conversion, the
      results are usually j
          l           ll jagged/crooked
                               d/     k d
      (especially for diagonal lines)


Vectorization Methods
1.
1     Manual – user selects and picks out features to be
      converted
2.    Automatic – entire raster image is converted by the
      computer software without user intervention
3.    Semi-automatic – combination of manual point
                                                p
      picking and computerized line tracing
         – produces best results


                                                                  22
8/20/2010


Raster to Vector Conversion
 Changing raster images into vector
 graphics
 May be done manually, automatically,
 or semi-automatically
       i t       ti ll
 Major limiting factor is the map quality


Graphical Data Editing
 Cleaning
 Cl i graphics b removing
               hi by    i
 data conversion errors


                                                  23
8/20/2010


Attribute Data Tagging
 Adding attribute data (e g
                         (e.g.,
 feature identifiers, feature codes,
 and contour labels) to the
 graphical data


Vector to Raster Conversion
 Rasterization
 process of converting vector data (points, lines and
 polygons) into raster data (series of cells each with a
 discrete value)
 Produces visually satisfactory results
                 y            y
 May be problematic in terms of the attributes assigned
 to pixels
   Most evident along edges/boundaries (partial cells)


                                                                 24
8/20/2010


Rasterization of Lines


Data Integration
 Combining data from various
 sources and in various formats to
 be able to extract more/better
 information


                                           25
8/20/2010


 Two types of spatial data integration:

1.   Horizontal Integration
      ‘tiling’; merging of
      adjacent data sets


 Two types of spatial data integration:

2.    Vertical Integration –
      map overlay; stacking of
      data sets/layers


                                                26
8/20/2010


Examples of Adjustments Required for Data Integration
Mathematical Transformations – translation, scaling, rotation, or skewing
Rectification – rearrangement of the location of objects to correspond to a specific
   (geodetic) reference system
Registration – rearrangement of the location of objects of one set so they correspond with
   those of another, without referring to a specific reference system
Rubber Sheeting – data set/layer is differentially ‘stretched’ so that tic p
                g             y                  y                         points on the layer
                                                                                           y
   are moved to approximate the location of the corresponding ground control points or
   corresponding tic points in another layer
Edge Matching – employed to properly connect or line-up corresponding features in
   adjacent map sheets to create a seamless model


                 translation          differential
                                      scaling                      ground control


                                                                    map locations
                 rotation
                                    skewing
                                                                      GIS file


             Mathematical Transformations                       Rubber Sheeting


                                                                                                   27
8/20/2010


             Widescreen Test Pattern (16:9)


                    Aspect Ratio Test

                      (Should appear
                          circular)


       4x3


16x9


                                                    28

GIS- Lecture 6

  • 1.
    8/20/2010 DATA ACQUISITION and PREPARATION Engr. Ablao GE517 Geographic Information System On data input … refers to the process of converting both paper and digital geographic data into a format compatible and useful to a GIS. Data input is the bottleneck of GIS operations. data input is slow, expensive and prone to error cost of data and its conversion is often up to 80 per cent of the total GIS cost data conversion requires careful planning and constant management the GIS is only as good as the data that it has at its disposal 1
  • 2.
    8/20/2010 Issues in datainput Data sources are varied topographic and cadastral maps t hi d d t l aerial photography and satellite imagery field sheets and census information etc. Source data is at different scales and map projection GIS involves encoding of spatial and non-spatial data g p p Automation of data conversion only partly successful, but could revolutionize the process More and more spatial data are becoming available in digital form Prior to data input Definition of data requirements q Operational planning and estimates Data preparation Data Input Editing 2
  • 3.
    8/20/2010 Data Sources Data Sources Maps 3
  • 4.
    8/20/2010 DataSources Census May be spatial in character and if each item has a spatial reference, allowing its Survey location on the Earth to be Data identified Usually in tabular format y Examples: population census, employment data, agricultural census data, marketing data Aerial Photographs Aerial Photographs and g p Satellite Images First method of remote sensing A ‘snapshot’ of the Earth at a particular instant in time May be used as a background or base map for other data in a GIS Provides spatial context and aids in interpretation Versatile, relatively inexpensive and detailed source of data for GIS 4
  • 5.
    8/20/2010 Data Sources Ground/ Using tapes transits, tapes, transits theodolites, total stations, etc. Land Used to collect field data Surveying such as coordinates, Data elevations, and distances Data collected are in analog format (written down in paper) which still need to be transformed to digital format for use in GIS Data Sources GPS Relatively new technique of (Global field data collection Positioning Originally designed for real- time navigation Systems) Can store collected Data coordinates and associated attribute information, which may be downloaded directly into a GIS database Accuracy ranges from 100 meters to a few centimeters 5
  • 6.
    8/20/2010 Categories of GeographicData Acquisition Primary – collected through first-hand observation first hand Secondary – data collected by another individual or organization; most are published data Primary Raster and Vector Data Raster Data satellite images scanned aerial photographs Vector Data Land survey points GPS observation data 6
  • 7.
    8/20/2010 Methods of Data Input Methods of Data Input 1. Raster Data Acquisition Scanning Photogrammetry Remote sensing 2. Vector Data Acquisition Manual digitizing Computer-assisted Computer assisted digitizing Field surveying GPS surveying 3. Attribute Data Acquisition Keyboard entry 7
  • 8.
    8/20/2010 Methods of datainput Keyboard entry Manual or operator-assisted digitizing Scanning Photogrammetric methods Satellite remote sensing systems Field Fi ld survey Satellite positioning systems Other computer systems 1. Keyboard entry Keyboard entry is primarily used for entering tabular data into the GIS database database. Typical attribute data sets entered may be: vegetation classes polygon identifiers soil types topographic detail The f h form of this data may be: f h d b numeric alpha-numeric logical 8
  • 9.
    8/20/2010 2.a. Manual digitizing Conventionaldigitizing is the manual process of converting geographic map data into digital form. The digitizing process is as follows: Map is placed on a flat digitizing tablet and affixed using tape. Operator identifies control (tic) points which have known geographic locations. Usually four or more points are identified. Operator digitizes the control points by moving the cursor to each location and then activating the digitizer by pressing a button. Software then performs calibration to enable any features digitized to be transformed into true geographic coordinates. Map features are then digitized by tracing their boundaries and activating the digitizer as required. 2.a. Manual digitizing Digitizing modes Point mode - the operator activates the button each time they want a location recorded Stream mode - a continuous stream of coordinates are recorded during the digitizing process with no need to activate a record button. The rate of sampling can be controlled by time or distance intervals. Digitizing accuracy Sources of errors: original map errors, internal digitizer errors, operator S f i i l i t l di iti t errors and control point errors. Digitizing accuracy = 1 mm x map scale e.g., Digitizing accuracy = 1 mm x 50,000 = 50 m 9
  • 10.
    8/20/2010 2.b. Operator-assisted digitizing Also known as heads-up digitizing because the heads up operator works with his head up looking at the screen rather than with his head down following the cursor on a digitizing tablet. It is said to be 10 times faster than manual digitizing digitizing. 2.b. Operator-assisted digitizing The process is as follows: A map is scanned into a computer system and resides in raster format. The map is displayed on the screen for the operator to use as a reference. The operator moves the cursor to a position at the start of a line or contour and activates the computer software. p The computer software takes over and converts the raster data to vector by following the pixels until there is a break. When it stops, operator moves cursor to a new line. 10
  • 11.
  • 12.
    8/20/2010 3. Scanning Scanningi an S i is automated process of converting from paper-based products to digital formats. formats 12
  • 13.
    8/20/2010 3. Scanning In thescanning process: a map is passed through a scanning system which h a number of scanning i d h h i hi h has b f i detection units; the detection units “detect” the reflected light emitted from features on the map; the reflected light is converted to a reflectance value the image can then be converted to vector format and edited Scanner types: pass-through h h drum (normally used for large maps) flat bed (normally used for small maps) aperture card 3. Scanning Characteristics of scanners data f d format - gray scale or color l l resolution - generally given in dots-per-inch (dpi) scan speed - a function of scanner memory and transfer rate to storage device thresholding - ability to control the scanner’s sensitivity to various features and colors Note on scanning g Requires expensive scanners Requires large hard disk space Requires powerful workstations 13
  • 14.
    8/20/2010 4. Photogrammetry andremote sensing Both are concerned with collecting geographic data using remote means. Planimetric and topographic information are usually derived from aerial photographs. Land cover and other information are usually derived from satellite imagery. Scanned aerial photographs and remotely sensed data are in digital raster format already. 5. Field surveys Traditionally, field measurements are made by surveyors or field staff who use specialized equipment and procedures for gathering geographic data. Field measurements usually include: measurements of distance and direction measurements in both horizontal and vertical planes 14
  • 15.
    8/20/2010 5. Field surveys Measurements can be made with: compasses, transits and theodolites (for direction) tapes, chains and distance meters (for distance) levels (for elevation) GPS (all of the above) 6. Satellite-based positioning systems GPS (U d States), GLONASS (R (United S ) (Russia) and ) d GNSS (Europe) are three civilian satellite positioning systems that are operational at present. Primarily developed for military applications, the American and Russian systems are subject to degradation for civilian use use. Receivers cost anywhere between US$ 1,000 to US$ 100,000 and give accuracy from 100 m to 1 cm (using sophisticated GPS data processing techniques). 15
  • 16.
    8/20/2010 7. Electronic DataTransfer Used when data is already in digital form Usually followed by data conversion, particularly when the transferred data is in a different format than what is required 7. Electronic Data Transfer Some local data that are available, include: Municipal boundaries, 1:250,000 (P70,000) 100-m contours, 1:250,000 (P50,000) Barangay boundaries (from NSO) 16
  • 17.
    8/20/2010 Data Editing Data Editing Errors and inaccuracies during data acquisition and input translate into errors in the GIS Before further analyses are made, these errors should be corrected to prevent the errors from propagating t generated information ti to t di f ti 17
  • 18.
    8/20/2010 Errors in datainput Entity error missing entities incorrectly-placed entities disordered entities Attribute error using the wrong code for an attribute misspellings i lli Entity-attribute agreement (logical consistency) error correct code is linked to the wrong entity Entity errors All entities that should have been entered are present. p No extra entities have been digitized. The entities are in the right place and are of the correct shape and size. All entities that are supposed to be connected to each other are. All polygons have only a single label point to identify them. All entities are within the outside boundary identified with registration marks. 18
  • 19.
    8/20/2010 Entity errors Attribute errors Pseudo-nodes Missing attributes Dangling node undershoot Incorrect attribute values overshoot Other problems Missing labels and too many Projection changes j g labels l b l Sliver polygons Edge matching “Weird” polygons Rubber sheeting 19
  • 20.
    8/20/2010 Joining Adjacent Layers Needed when there are multiple map sheets to be used Ensures that all layers form a continuous geographic database when joined together Data Conversion After input and editing of individual datasets, it is p g , usually necessary to process the data before integrating them all into a single GIS Process of converting data on one form to a more useful format for the specific GIS application p pp One of the most tedious, time-consuming, and error- prone processes in GIS 20
  • 21.
    8/20/2010 Raster to VectorConversion Vectorization Converting scanned raster images to vector features (point, line, or polygons) Results are visually problematic most of the time Raster Line Thinning ‘skeletonizing’ skeletonizing Process of reducing raster linear features into unit width 21
  • 22.
    8/20/2010 Line Smoothing Employed to make the resulting vectors more visually appealing during raster to vector conversion, the results are usually j l ll jagged/crooked d/ k d (especially for diagonal lines) Vectorization Methods 1. 1 Manual – user selects and picks out features to be converted 2. Automatic – entire raster image is converted by the computer software without user intervention 3. Semi-automatic – combination of manual point p picking and computerized line tracing – produces best results 22
  • 23.
    8/20/2010 Raster to VectorConversion Changing raster images into vector graphics May be done manually, automatically, or semi-automatically i t ti ll Major limiting factor is the map quality Graphical Data Editing Cleaning Cl i graphics b removing hi by i data conversion errors 23
  • 24.
    8/20/2010 Attribute Data Tagging Adding attribute data (e g (e.g., feature identifiers, feature codes, and contour labels) to the graphical data Vector to Raster Conversion Rasterization process of converting vector data (points, lines and polygons) into raster data (series of cells each with a discrete value) Produces visually satisfactory results y y May be problematic in terms of the attributes assigned to pixels Most evident along edges/boundaries (partial cells) 24
  • 25.
    8/20/2010 Rasterization of Lines DataIntegration Combining data from various sources and in various formats to be able to extract more/better information 25
  • 26.
    8/20/2010 Two typesof spatial data integration: 1. Horizontal Integration ‘tiling’; merging of adjacent data sets Two types of spatial data integration: 2. Vertical Integration – map overlay; stacking of data sets/layers 26
  • 27.
    8/20/2010 Examples of AdjustmentsRequired for Data Integration Mathematical Transformations – translation, scaling, rotation, or skewing Rectification – rearrangement of the location of objects to correspond to a specific (geodetic) reference system Registration – rearrangement of the location of objects of one set so they correspond with those of another, without referring to a specific reference system Rubber Sheeting – data set/layer is differentially ‘stretched’ so that tic p g y y points on the layer y are moved to approximate the location of the corresponding ground control points or corresponding tic points in another layer Edge Matching – employed to properly connect or line-up corresponding features in adjacent map sheets to create a seamless model translation differential scaling ground control map locations rotation skewing GIS file Mathematical Transformations Rubber Sheeting 27
  • 28.
    8/20/2010 Widescreen Test Pattern (16:9) Aspect Ratio Test (Should appear circular) 4x3 16x9 28