
Download to read offline
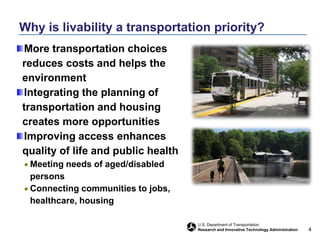
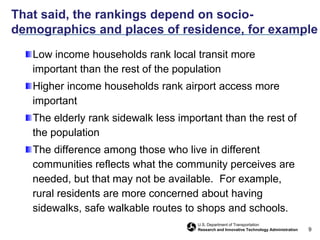
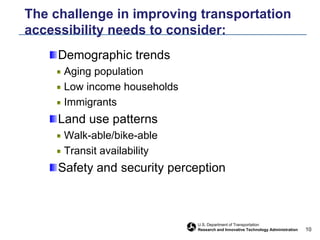
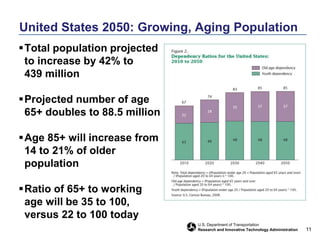
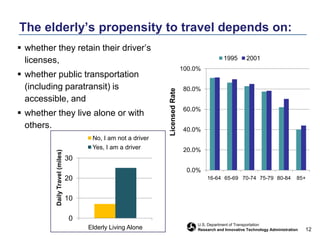
The document discusses transportation accessibility and livable communities, noting that improving access enhances quality of life. It highlights trends like an aging population and growing number of low-income households that impact transportation needs. The document also reviews data sources like the National Household Travel Survey that can provide insights into how demographic factors influence transportation accessibility and mobility.


![[Webinar] “Public Transit Service Equity: Definition and Measurement Consider...](https://cdn.slidesharecdn.com/ss_thumbnails/karnerbrtcoewebinar-150716223703-lva1-app6892-thumbnail.jpg?width=640&height=640&fit=bounds)


![5G Explained! A High Level Overview [Introduction]](https://cdn.slidesharecdn.com/ss_thumbnails/5gexplainedahighleveloverview-260119165306-cc137a3e-thumbnail.jpg?width=640&height=640&fit=bounds)


