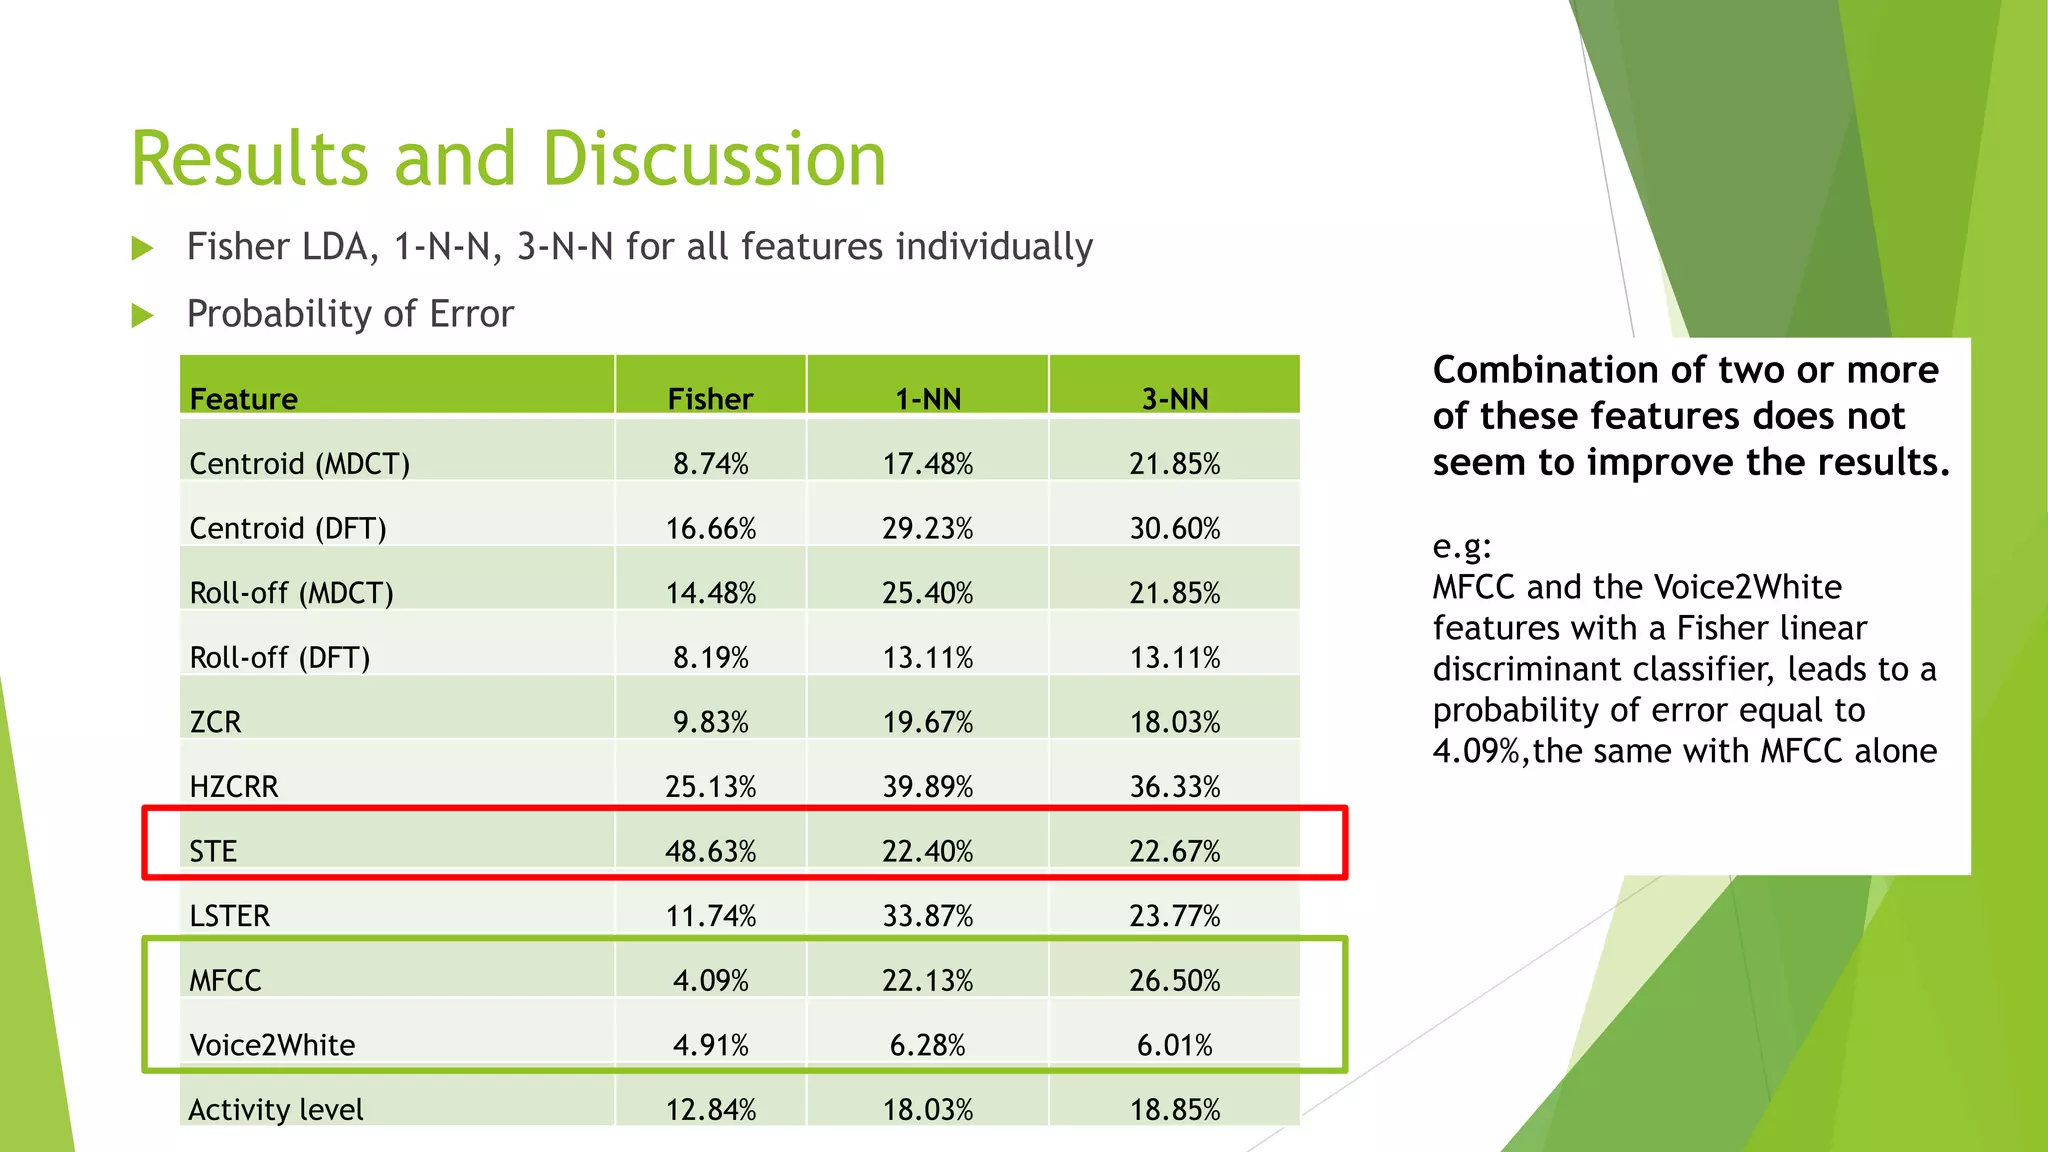
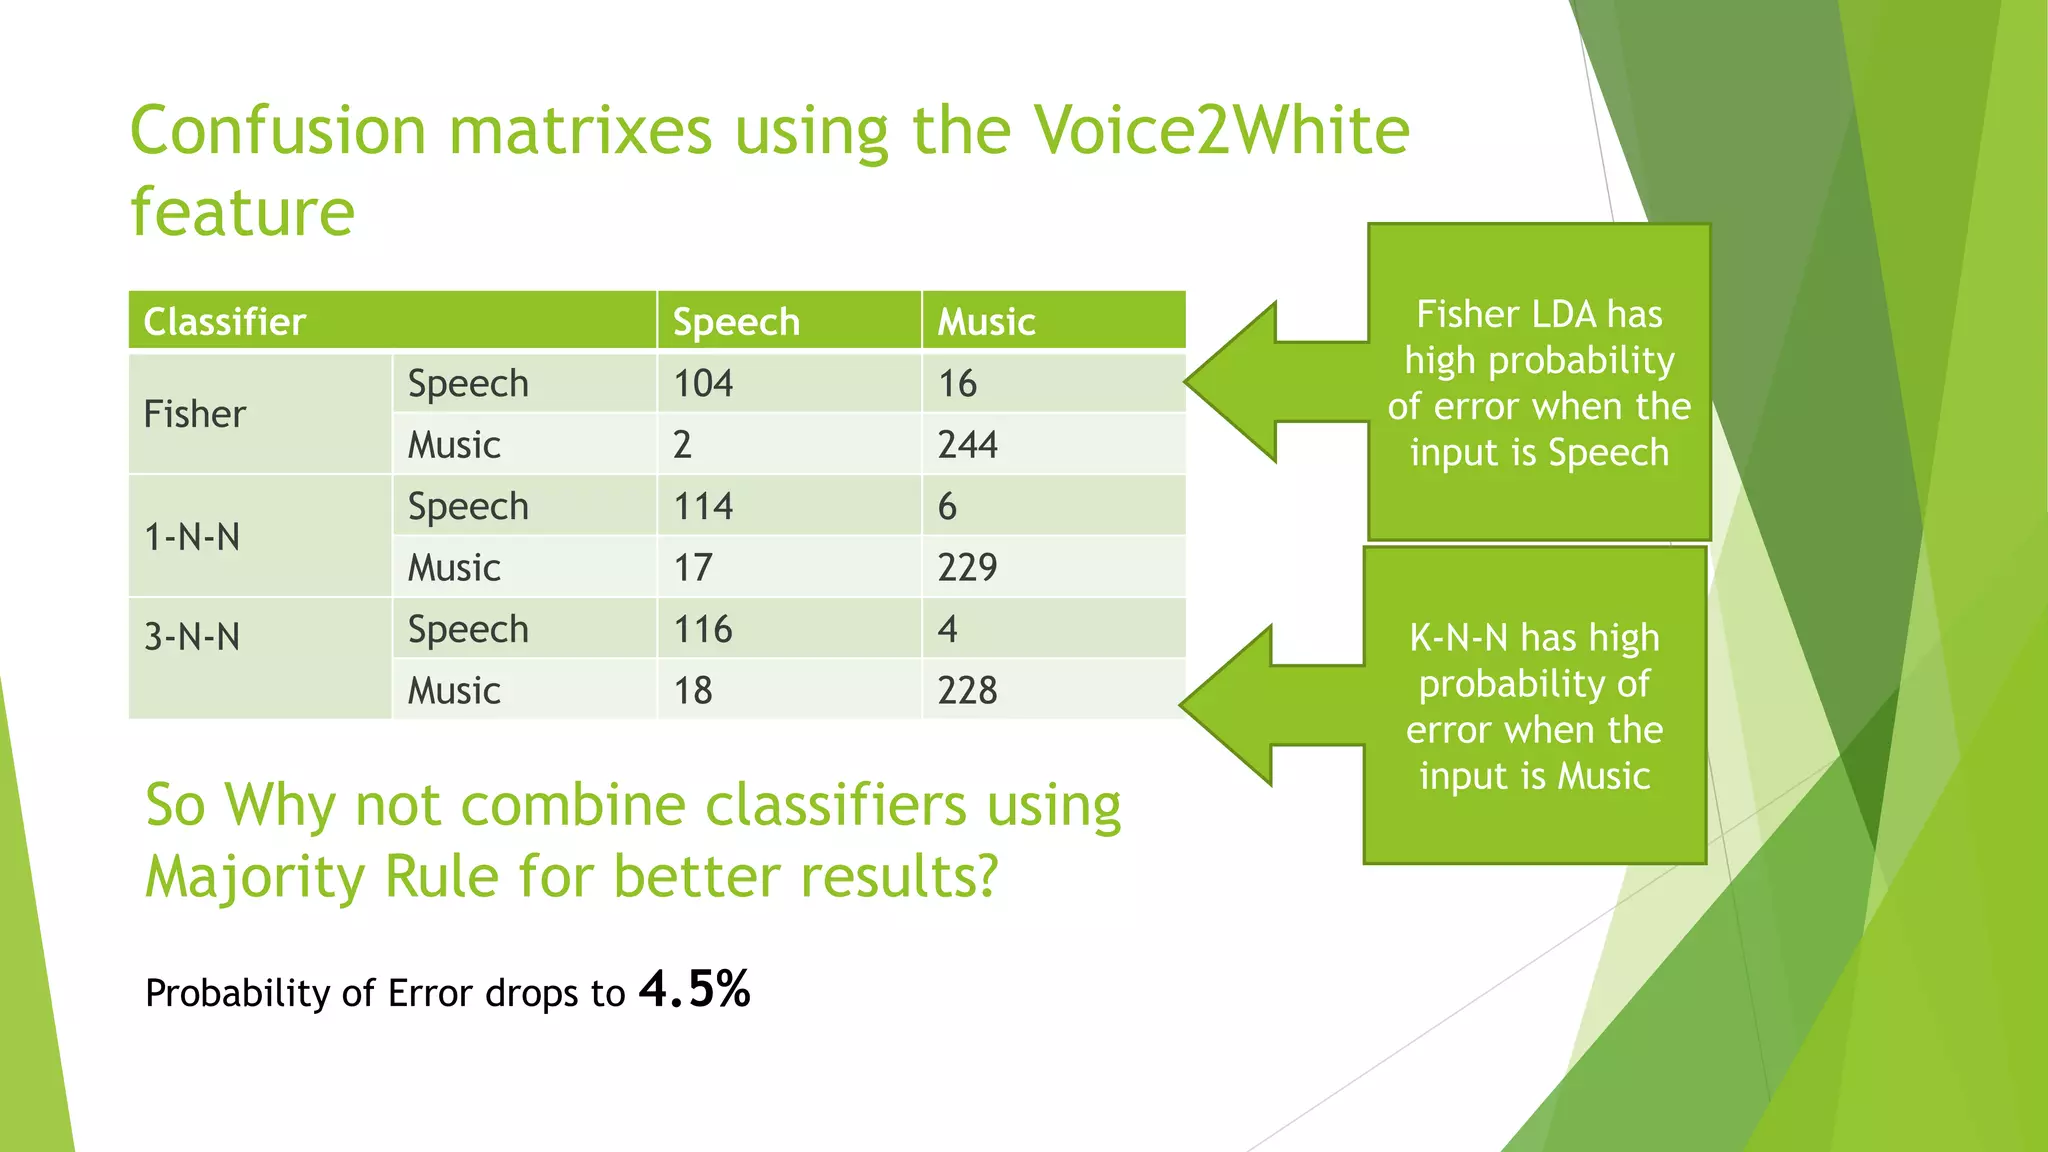
Application of Fisher Linear Discriminant Analysis
to Speech/Music Classification
Enrique Alexandre, Manuel Rosa, Lucas Cuadra, and Roberto Gil-Pita
Departamento de Teor´ıa de la Se˜nal y Comunicaciones
Universidad de Alcal´a. 28805 - Alcal´a de Henares,
Madrid, Spain
Presented By:
S. Lushanthan
Agenda
 Objective
 Time Frequency Decomposition
 Feature Extraction
 Classification Algorithms
 Data Collection
 Results and Discussion
Objective
 The well-known K-N-N algorithm has been widely used in many sound
classification applications. The Objective here is to,
“Demonstrate the superior behavior of the Fishers Linear Discriminant
algorithm compared to the K-Nearest-Neighbor algorithm”
Why Speech/ Music Classification?
 Fisher LDA Classifier has not been tried much in the domain of speech/ audio
classification
 If this succeeds, this would be a first-step in many Music-Genre Classification
systems
Signal Processing – Time frequency
decomposition
Feature Extraction
 Literature says that features can be classified in to 3 different classes,
1. Timbre-related
2. Rhythm related
3. Pitch-related
 For simplification purposes only “timbre-related” features are used
 A 512-samples window is used, with no overlap between adjacent frames
 The time-frequency decomposition is performed using either a Modified
Discrete Cosine Transform (MDCT), or a Discrete Fourier Transform (DFT)
 All the features are calculated and their mean and standard deviation are
computed every 43 frames (1.85 seconds at our sampling rate). Thus a 2-
dimensional vector, containing the mean and standard deviation
computed every 43 frames
Feature Description Mathematical Equation
Spectral Centroid Measure of brightness of a sound
Spectral Roll-off Shape of the spectrum
Zero Crossing Rate (ZCR) How noisy a signal is
High Zero Crossing Rate Ratio # of frames whose ZCR is 1.5x above
the mean ZCR
Short-Time Energy (STE) Mean energy of the signal within each
analysis frame
Low Short-Time Energy Ratio Ratio of frames whose STE is 0.5x below
the mean STE
Mel-frequency Cepstral
Coefficients (MFCC)
Provide a compact representation of
the spectral envelope
Voice2White measure of the energy inside the
typical speech band (300-4000 Hz)
respect to the whole energy of the
signal
Activity Level calculated using method for the
objective measurement of active
speech
Classification Algorithms
K- Nearest- Neighbor
 Classification Rule
Assume that we have a training set with L vectors grouped into C different classes. To
obtain the class corresponding to a new observed vector X, the algorithm has simply
to look for the K nearest neighbors to the test vector X, and weigh their class
numbers they belong to, usually using a majority rule.
Fisher LDA
 Data are projected onto a line, and the classification is performed in this one-
dimensional space
 The class separability function in a direction w є Rn is defined as:
 Find an analytic expression for w which maximizes J(w):
SB and SW are the between-class and
within class scatter matrixes respectively
Data Collection
 Corpus for speech/music classification provided by Dan Ellis originally recorded by
Eric Scheirer during his internship at Interval Research Corporation
“Music-Speech” Corpus
Training
Data
music
(60 files)
speech
(60 files)
m + s
(60 files)
Test
Data
speech
(without bgm)
(120 files)
music with
no vocals
(126 files)
music with
vocals
(120 files)
45 minutes,
15 seconds
each
15.25 minutes,
2.5 seconds
each
Results and Discussion
 Fisher LDA, 1-N-N, 3-N-N for all features individually
 Probability of Error
Feature Fisher 1-NN 3-NN
Centroid (MDCT) 8.74% 17.48% 21.85%
Centroid (DFT) 16.66% 29.23% 30.60%
Roll-off (MDCT) 14.48% 25.40% 21.85%
Roll-off (DFT) 8.19% 13.11% 13.11%
ZCR 9.83% 19.67% 18.03%
HZCRR 25.13% 39.89% 36.33%
STE 48.63% 22.40% 22.67%
LSTER 11.74% 33.87% 23.77%
MFCC 4.09% 22.13% 26.50%
Voice2White 4.91% 6.28% 6.01%
Activity level 12.84% 18.03% 18.85%
Combination of two or more
of these features does not
seem to improve the results.
e.g:
MFCC and the Voice2White
features with a Fisher linear
discriminant classifier, leads to a
probability of error equal to
4.09%,the same with MFCC alone
Confusion matrixes using the Voice2White
feature
Classifier Speech Music
Fisher
Speech 104 16
Music 2 244
1-N-N
Speech 114 6
Music 17 229
3-N-N Speech 116 4
Music 18 228
Fisher LDA has
high probability
of error when the
input is Speech
K-N-N has high
probability of
error when the
input is Music
So Why not combine classifiers using
Majority Rule for better results?
Probability of Error drops to 4.5%
Conclusion
 Fisher linear discriminant analysis can provide very promising results using
only one feature for the classification
 Better results may be obtained combining the results obtained from two or
more classifiers
Thank you!

Application of Fisher Linear Discriminant Analysis to Speech/Music Classification

  • 1.
    Application of FisherLinear Discriminant Analysis to Speech/Music Classification Enrique Alexandre, Manuel Rosa, Lucas Cuadra, and Roberto Gil-Pita Departamento de Teor´ıa de la Se˜nal y Comunicaciones Universidad de Alcal´a. 28805 - Alcal´a de Henares, Madrid, Spain Presented By: S. Lushanthan
  • 2.
    Agenda  Objective  TimeFrequency Decomposition  Feature Extraction  Classification Algorithms  Data Collection  Results and Discussion
  • 3.
    Objective  The well-knownK-N-N algorithm has been widely used in many sound classification applications. The Objective here is to, “Demonstrate the superior behavior of the Fishers Linear Discriminant algorithm compared to the K-Nearest-Neighbor algorithm” Why Speech/ Music Classification?  Fisher LDA Classifier has not been tried much in the domain of speech/ audio classification  If this succeeds, this would be a first-step in many Music-Genre Classification systems
  • 4.
    Signal Processing –Time frequency decomposition
  • 5.
    Feature Extraction  Literaturesays that features can be classified in to 3 different classes, 1. Timbre-related 2. Rhythm related 3. Pitch-related  For simplification purposes only “timbre-related” features are used  A 512-samples window is used, with no overlap between adjacent frames  The time-frequency decomposition is performed using either a Modified Discrete Cosine Transform (MDCT), or a Discrete Fourier Transform (DFT)  All the features are calculated and their mean and standard deviation are computed every 43 frames (1.85 seconds at our sampling rate). Thus a 2- dimensional vector, containing the mean and standard deviation computed every 43 frames
  • 6.
    Feature Description MathematicalEquation Spectral Centroid Measure of brightness of a sound Spectral Roll-off Shape of the spectrum Zero Crossing Rate (ZCR) How noisy a signal is High Zero Crossing Rate Ratio # of frames whose ZCR is 1.5x above the mean ZCR Short-Time Energy (STE) Mean energy of the signal within each analysis frame Low Short-Time Energy Ratio Ratio of frames whose STE is 0.5x below the mean STE Mel-frequency Cepstral Coefficients (MFCC) Provide a compact representation of the spectral envelope Voice2White measure of the energy inside the typical speech band (300-4000 Hz) respect to the whole energy of the signal Activity Level calculated using method for the objective measurement of active speech
  • 7.
    Classification Algorithms K- Nearest-Neighbor  Classification Rule Assume that we have a training set with L vectors grouped into C different classes. To obtain the class corresponding to a new observed vector X, the algorithm has simply to look for the K nearest neighbors to the test vector X, and weigh their class numbers they belong to, usually using a majority rule.
  • 8.
    Fisher LDA  Dataare projected onto a line, and the classification is performed in this one- dimensional space  The class separability function in a direction w є Rn is defined as:  Find an analytic expression for w which maximizes J(w): SB and SW are the between-class and within class scatter matrixes respectively
  • 9.
    Data Collection  Corpusfor speech/music classification provided by Dan Ellis originally recorded by Eric Scheirer during his internship at Interval Research Corporation
  • 10.
    “Music-Speech” Corpus Training Data music (60 files) speech (60files) m + s (60 files) Test Data speech (without bgm) (120 files) music with no vocals (126 files) music with vocals (120 files) 45 minutes, 15 seconds each 15.25 minutes, 2.5 seconds each
  • 11.
    Results and Discussion Fisher LDA, 1-N-N, 3-N-N for all features individually  Probability of Error Feature Fisher 1-NN 3-NN Centroid (MDCT) 8.74% 17.48% 21.85% Centroid (DFT) 16.66% 29.23% 30.60% Roll-off (MDCT) 14.48% 25.40% 21.85% Roll-off (DFT) 8.19% 13.11% 13.11% ZCR 9.83% 19.67% 18.03% HZCRR 25.13% 39.89% 36.33% STE 48.63% 22.40% 22.67% LSTER 11.74% 33.87% 23.77% MFCC 4.09% 22.13% 26.50% Voice2White 4.91% 6.28% 6.01% Activity level 12.84% 18.03% 18.85% Combination of two or more of these features does not seem to improve the results. e.g: MFCC and the Voice2White features with a Fisher linear discriminant classifier, leads to a probability of error equal to 4.09%,the same with MFCC alone
  • 12.
    Confusion matrixes usingthe Voice2White feature Classifier Speech Music Fisher Speech 104 16 Music 2 244 1-N-N Speech 114 6 Music 17 229 3-N-N Speech 116 4 Music 18 228 Fisher LDA has high probability of error when the input is Speech K-N-N has high probability of error when the input is Music So Why not combine classifiers using Majority Rule for better results? Probability of Error drops to 4.5%
  • 13.
    Conclusion  Fisher lineardiscriminant analysis can provide very promising results using only one feature for the classification  Better results may be obtained combining the results obtained from two or more classifiers
  • 14.

Editor's Notes

  • #5 Discreate Fourier Transformation
  • #9 J(w) Equation- Rayleigh quotient