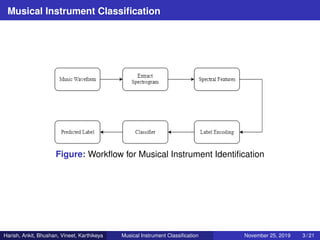
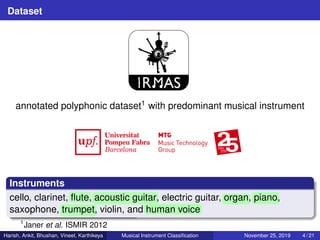
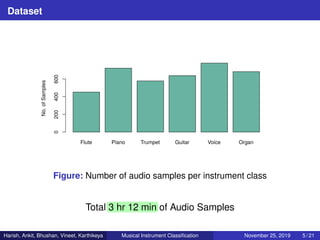
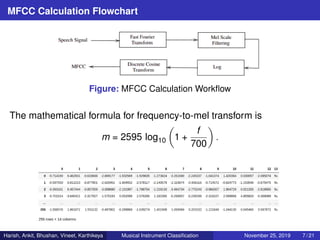
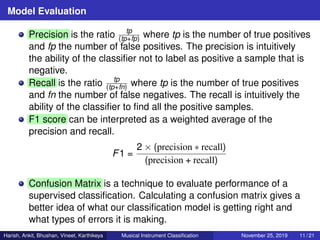
Predominant Musical Instrument Classification
based on Spectral Features
Harish(55) Ankit(41) Bhushan(59)
Vineet(46) Karthikeya(32)
Indian Statistical Institute
CDS Course Project Presentation
November 25, 2019
Musical Information Retrieval
Music information retrieval (MIR) is the interdisciplinary science of
retrieving information from music.
Harish, Ankit, Bhushan, Vineet, Karthikeya Musical Instrument Classification November 25, 2019 2 / 21
Musical Information Retrieval
Music information retrieval (MIR) is the interdisciplinary science of
retrieving information from music.
Key areas in MIR
Recommender Systems
Track separation
Genre Detection
Music Transcription
Music Categorization
Music Generation
Musical Instrument Recognition
Harish, Ankit, Bhushan, Vineet, Karthikeya Musical Instrument Classification November 25, 2019 2 / 21
Musical Instrument Classification
Figure: Workflow for Musical Instrument Identification
Harish, Ankit, Bhushan, Vineet, Karthikeya Musical Instrument Classification November 25, 2019 3 / 21
Dataset
annotated polyphonic dataset1 with predominant musical instrument
1
Janer et al. ISMIR 2012
Harish, Ankit, Bhushan, Vineet, Karthikeya Musical Instrument Classification November 25, 2019 4 / 21
Dataset
annotated polyphonic dataset1 with predominant musical instrument
Instruments
cello, clarinet, flute, acoustic guitar, electric guitar, organ, piano,
saxophone, trumpet, violin, and human voice
1
Janer et al. ISMIR 2012
Harish, Ankit, Bhushan, Vineet, Karthikeya Musical Instrument Classification November 25, 2019 4 / 21
Dataset
Flute Piano Trumpet Guitar Voice Organ
No.ofSamples
0200400600
Figure: Number of audio samples per instrument class
Total 3 hr 12 min of Audio Samples
Harish, Ankit, Bhushan, Vineet, Karthikeya Musical Instrument Classification November 25, 2019 5 / 21
Timbre
Timbre is the ‘colour’ of a sound. Timbre can distinguish between
different types of string instruments, wind instruments, and percussion
instruments.
(a) EDM (b) Guitar
(Acoustic)
(c) Key Board (d) Organ
Figure: Same note (audio) played on various instruments
Harish, Ankit, Bhushan, Vineet, Karthikeya Musical Instrument Classification November 25, 2019 6 / 21
MFCC Calculation Flowchart
Figure: MFCC Calculation Workflow
Harish, Ankit, Bhushan, Vineet, Karthikeya Musical Instrument Classification November 25, 2019 7 / 21
MFCC Calculation Flowchart
Figure: MFCC Calculation Workflow
The mathematical formula for frequency-to-mel transform is
m = 2595 log10 1 +
f
700
.
Harish, Ankit, Bhushan, Vineet, Karthikeya Musical Instrument Classification November 25, 2019 7 / 21
MFCC Calculation Flowchart
Figure: MFCC Calculation Workflow
The mathematical formula for frequency-to-mel transform is
m = 2595 log10 1 +
f
700
.
Harish, Ankit, Bhushan, Vineet, Karthikeya Musical Instrument Classification November 25, 2019 7 / 21
Other Spectral Features 2
Zero Crossing Frequency — simple measure of the frequency
content of a signal
Root mean Square — rms summarises the energy distribution of
each frame
Spectral Centroid — It is a measure of average frequency
weighted by the sum of spectral amplitude within one frame
Spectral Bandwidth — frequency range of a signal weighted by its
spectrum
Spectral Rolloff — measure of rolloff frequency
2
Deng et al. IEEE Trans. on Systems, Man, and Cybernetics, 2008
Harish, Ankit, Bhushan, Vineet, Karthikeya Musical Instrument Classification November 25, 2019 8 / 21
Methodology
We experimented with two libraries – Essentia & Librosa for
feature extraction
Each audio sample of 3 sec produced 257 rows. We took mean
and produced a single vector per audio file
np.mean(mfcc-feature-vector,axis=1)
Harish, Ankit, Bhushan, Vineet, Karthikeya Musical Instrument Classification November 25, 2019 9 / 21
Methodology
We experimented with two libraries – Essentia & Librosa for
feature extraction
Each audio sample of 3 sec produced 257 rows. We took mean
and produced a single vector per audio file
np.mean(mfcc-feature-vector,axis=1)
Labelled each vector using labelencoder
trained the classifier in scikit learn
Harish, Ankit, Bhushan, Vineet, Karthikeya Musical Instrument Classification November 25, 2019 9 / 21
Supervised Classification
Logistic Regression — (Baseline Model)
Decision Tree
LGBM
XG Boost
Random Forest
Support Vector Machine
Harish, Ankit, Bhushan, Vineet, Karthikeya Musical Instrument Classification November 25, 2019 10 / 21
Model Evaluation
Precision is the ratio tp
(tp+fp) where tp is the number of true positives
and fp the number of false positives. The precision is intuitively
the ability of the classifier not to label as positive a sample that is
negative.
Harish, Ankit, Bhushan, Vineet, Karthikeya Musical Instrument Classification November 25, 2019 11 / 21
Model Evaluation
Precision is the ratio tp
(tp+fp) where tp is the number of true positives
and fp the number of false positives. The precision is intuitively
the ability of the classifier not to label as positive a sample that is
negative.
Recall is the ratio tp
(tp+fn) where tp is the number of true positives
and fn the number of false negatives. The recall is intuitively the
ability of the classifier to find all the positive samples.
F1 score can be interpreted as a weighted average of the
precision and recall.
F1 =
2 × (precision ∗ recall)
(precision + recall)
Confusion Matrix is a technique to evaluate performance of a
supervised classification. Calculating a confusion matrix gives a
better idea of what our classification model is getting right and
what types of errors it is making.
Harish, Ankit, Bhushan, Vineet, Karthikeya Musical Instrument Classification November 25, 2019 11 / 21
Accuracy Statistic
Logistic Regession Decision Tree LGBM
Instrument P R F1 P R F1 P R F1
Flute 0.58 0.39 0.47 0.43 0.44 0.43 0.66 0.59 0.62
Piano 0.55 0.59 0.57 0.53 0.54 0.53 0.69 0.73 0.71
Trumpet 0.44 0.53 0.48 0.50 0.46 0.48 0.59 0.67 0.63
Guitar 0.63 0.57 0.60 0.60 0.57 0.58 0.73 0.68 0.71
Voice 0.58 0.48 0.52 0.52 0.50 0.51 0.72 0.54 0.62
Organ 0.51 0.61 0.56 0.50 0.55 0.52 0.63 0.74 0.68
XG Boost RF SVM
Instrument P R F1 P R F1 P R F1
Flute 0.66 0.59 0.62 0.72 0.48 0.58 0.63 0.63 0.63
Piano 0.72 0.71 0.71 0.72 0.75 0.74 0.79 0.84 0.81
Trumpet 0.58 0.69 0.63 0.61 0.72 0.66 0.78 0.77 0.78
Guitar 0.71 0.72 0.71 0.73 0.72 0.72 0.77 0.76 0.77
Voice 0.75 0.53 0.62 0.74 0.54 0.62 0.78 0.67 0.72
Organ 0.65 0.74 0.69 0.63 0.80 0.70 0.79 0.85 0.82
Table: Precision, Recall & F1 Score for various
Supervised Models
Harish, Ankit, Bhushan, Vineet, Karthikeya Musical Instrument Classification November 25, 2019 12 / 21
Model Evaluation – F1 Score
Log. Reg DTree LGBM XG Boost RF SVM
0.50.60.70.8
F1-Score
Figure: F1 Measure for Various Models
Harish, Ankit, Bhushan, Vineet, Karthikeya Musical Instrument Classification November 25, 2019 13 / 21
Instrument Performance
Flute Piano Trumpet Guitar Voice Organ
0.50.60.70.8
F1-Score
Figure: Instrument wise classification
Harish, Ankit, Bhushan, Vineet, Karthikeya Musical Instrument Classification November 25, 2019 14 / 21
Model Evaluation – Confusion Matrix
(a) Logistic Regression (b) Decision Tree (c) Light GBM
Figure: Confusion Matrix for various supervised Algorithms
Harish, Ankit, Bhushan, Vineet, Karthikeya Musical Instrument Classification November 25, 2019 15 / 21
Model Evaluation – Confusion Matrix
(a) XG Boost (b) Random Forest (c) SVM
Figure: Confusion Matrix for various supervised Algorithms
Harish, Ankit, Bhushan, Vineet, Karthikeya Musical Instrument Classification November 25, 2019 16 / 21
Unsupervised Approach
Figure: Kmeans Clustering
Harish, Ankit, Bhushan, Vineet, Karthikeya Musical Instrument Classification November 25, 2019 17 / 21
Unsupervised Approach
Figure: Kmeans Clustering
K-means performed very poorly.
The cost function is almost
monotonically decreasing. Difficult
to group the classes.
Harish, Ankit, Bhushan, Vineet, Karthikeya Musical Instrument Classification November 25, 2019 17 / 21
Unsupervised Approach
Figure: Kmeans Clustering
K-means performed very poorly.
The cost function is almost
monotonically decreasing. Difficult
to group the classes.
Figure: Agglomerative Clustering
Works in bottom up fashion.
Similar points are fused at each
iteration. Cutting the dendogram
at height 30 gives us underlying
cluster grouped into 4 classes.
Harish, Ankit, Bhushan, Vineet, Karthikeya Musical Instrument Classification November 25, 2019 17 / 21
Neural Network
Input Layer (25) Hidden Layer 1 (40) Hidden Layer 2 (15) Output Layer (6)
ReLU ReLU Softmax
:
:
:
:
:
:
Figure: 3 Layer Neural Network
Harish, Ankit, Bhushan, Vineet, Karthikeya Musical Instrument Classification November 25, 2019 18 / 21
Neural Network – Continued
Loss Function: Cross Entropy
−
6
c=1
yo,a log(po,a)
y is indicator variable and p is probability.
We used the Adaptive Moment Estimation (Adam) optimizer.
Harish, Ankit, Bhushan, Vineet, Karthikeya Musical Instrument Classification November 25, 2019 19 / 21
Neural Network – Continued
Loss Function: Cross Entropy
−
6
c=1
yo,a log(po,a)
y is indicator variable and p is probability.
We used the Adaptive Moment Estimation (Adam) optimizer.
Figure: Loss Function
Accuracy: 64%
Harish, Ankit, Bhushan, Vineet, Karthikeya Musical Instrument Classification November 25, 2019 19 / 21
Key Takeaways
Supervised Learning is good for Instrument Recognition
Harish, Ankit, Bhushan, Vineet, Karthikeya Musical Instrument Classification November 25, 2019 20 / 21
Key Takeaways
Supervised Learning is good for Instrument Recognition
SVM with RBF Kernel performs best with 79% accuracy
Harish, Ankit, Bhushan, Vineet, Karthikeya Musical Instrument Classification November 25, 2019 20 / 21
Key Takeaways
Supervised Learning is good for Instrument Recognition
SVM with RBF Kernel performs best with 79% accuracy
Agglomerative Clustering performs better among unsupervised
approaches
Harish, Ankit, Bhushan, Vineet, Karthikeya Musical Instrument Classification November 25, 2019 20 / 21
Key Takeaways
Supervised Learning is good for Instrument Recognition
SVM with RBF Kernel performs best with 79% accuracy
Agglomerative Clustering performs better among unsupervised
approaches
Future Directions: Can experiment with parameter tuning of neural
nets. Use a CNN to train a classifier which can classify instrument
given an image of spectogram
Harish, Ankit, Bhushan, Vineet, Karthikeya Musical Instrument Classification November 25, 2019 20 / 21
Acknowledgement & References
Bosch et al. A comparison of sound
segregation techniques for predominant
instrument recognition in musical audio
signals. ISMIR 2012
Deng et al. A study on feature analysis
for musical instrument classification.
IEEE Transactions on Systems, Man,
and Cybernetics 2008
Eronen et al. Musical instrument
recognition using cepstral coefficients
and temporal features. ICASSP 2000
All the code used is available in github.
https://github.com/vntkumar8/
musical-instrument-classification
Thanks to for vm.
Thank You!
Questions?
Harish, Ankit, Bhushan, Vineet, Karthikeya Musical Instrument Classification November 25, 2019 21 / 21

Musical Instrument Classification

  • 1.
    Predominant Musical InstrumentClassification based on Spectral Features Harish(55) Ankit(41) Bhushan(59) Vineet(46) Karthikeya(32) Indian Statistical Institute CDS Course Project Presentation November 25, 2019
  • 2.
    Musical Information Retrieval Musicinformation retrieval (MIR) is the interdisciplinary science of retrieving information from music. Harish, Ankit, Bhushan, Vineet, Karthikeya Musical Instrument Classification November 25, 2019 2 / 21
  • 3.
    Musical Information Retrieval Musicinformation retrieval (MIR) is the interdisciplinary science of retrieving information from music. Key areas in MIR Recommender Systems Track separation Genre Detection Harish, Ankit, Bhushan, Vineet, Karthikeya Musical Instrument Classification November 25, 2019 2 / 21
  • 4.
    Musical Information Retrieval Musicinformation retrieval (MIR) is the interdisciplinary science of retrieving information from music. Key areas in MIR Recommender Systems Track separation Genre Detection Music Transcription Music Categorization Music Generation Harish, Ankit, Bhushan, Vineet, Karthikeya Musical Instrument Classification November 25, 2019 2 / 21
  • 5.
    Musical Information Retrieval Musicinformation retrieval (MIR) is the interdisciplinary science of retrieving information from music. Key areas in MIR Recommender Systems Track separation Genre Detection Music Transcription Music Categorization Music Generation Musical Instrument Recognition Harish, Ankit, Bhushan, Vineet, Karthikeya Musical Instrument Classification November 25, 2019 2 / 21
  • 6.
    Musical Instrument Classification Figure:Workflow for Musical Instrument Identification Harish, Ankit, Bhushan, Vineet, Karthikeya Musical Instrument Classification November 25, 2019 3 / 21
  • 7.
    Dataset annotated polyphonic dataset1with predominant musical instrument 1 Janer et al. ISMIR 2012 Harish, Ankit, Bhushan, Vineet, Karthikeya Musical Instrument Classification November 25, 2019 4 / 21
  • 8.
    Dataset annotated polyphonic dataset1with predominant musical instrument Instruments cello, clarinet, flute, acoustic guitar, electric guitar, organ, piano, saxophone, trumpet, violin, and human voice 1 Janer et al. ISMIR 2012 Harish, Ankit, Bhushan, Vineet, Karthikeya Musical Instrument Classification November 25, 2019 4 / 21
  • 9.
    Dataset Flute Piano TrumpetGuitar Voice Organ No.ofSamples 0200400600 Figure: Number of audio samples per instrument class Total 3 hr 12 min of Audio Samples Harish, Ankit, Bhushan, Vineet, Karthikeya Musical Instrument Classification November 25, 2019 5 / 21
  • 10.
    Timbre Timbre is the‘colour’ of a sound. Timbre can distinguish between different types of string instruments, wind instruments, and percussion instruments. (a) EDM (b) Guitar (Acoustic) (c) Key Board (d) Organ Figure: Same note (audio) played on various instruments Harish, Ankit, Bhushan, Vineet, Karthikeya Musical Instrument Classification November 25, 2019 6 / 21
  • 11.
    MFCC Calculation Flowchart Figure:MFCC Calculation Workflow Harish, Ankit, Bhushan, Vineet, Karthikeya Musical Instrument Classification November 25, 2019 7 / 21
  • 12.
    MFCC Calculation Flowchart Figure:MFCC Calculation Workflow The mathematical formula for frequency-to-mel transform is m = 2595 log10 1 + f 700 . Harish, Ankit, Bhushan, Vineet, Karthikeya Musical Instrument Classification November 25, 2019 7 / 21
  • 13.
    MFCC Calculation Flowchart Figure:MFCC Calculation Workflow The mathematical formula for frequency-to-mel transform is m = 2595 log10 1 + f 700 . Harish, Ankit, Bhushan, Vineet, Karthikeya Musical Instrument Classification November 25, 2019 7 / 21
  • 14.
    Other Spectral Features2 Zero Crossing Frequency — simple measure of the frequency content of a signal Root mean Square — rms summarises the energy distribution of each frame Spectral Centroid — It is a measure of average frequency weighted by the sum of spectral amplitude within one frame Spectral Bandwidth — frequency range of a signal weighted by its spectrum Spectral Rolloff — measure of rolloff frequency 2 Deng et al. IEEE Trans. on Systems, Man, and Cybernetics, 2008 Harish, Ankit, Bhushan, Vineet, Karthikeya Musical Instrument Classification November 25, 2019 8 / 21
  • 15.
    Methodology We experimented withtwo libraries – Essentia & Librosa for feature extraction Each audio sample of 3 sec produced 257 rows. We took mean and produced a single vector per audio file np.mean(mfcc-feature-vector,axis=1) Harish, Ankit, Bhushan, Vineet, Karthikeya Musical Instrument Classification November 25, 2019 9 / 21
  • 16.
    Methodology We experimented withtwo libraries – Essentia & Librosa for feature extraction Each audio sample of 3 sec produced 257 rows. We took mean and produced a single vector per audio file np.mean(mfcc-feature-vector,axis=1) Labelled each vector using labelencoder trained the classifier in scikit learn Harish, Ankit, Bhushan, Vineet, Karthikeya Musical Instrument Classification November 25, 2019 9 / 21
  • 17.
    Supervised Classification Logistic Regression— (Baseline Model) Decision Tree LGBM XG Boost Random Forest Support Vector Machine Harish, Ankit, Bhushan, Vineet, Karthikeya Musical Instrument Classification November 25, 2019 10 / 21
  • 18.
    Model Evaluation Precision isthe ratio tp (tp+fp) where tp is the number of true positives and fp the number of false positives. The precision is intuitively the ability of the classifier not to label as positive a sample that is negative. Harish, Ankit, Bhushan, Vineet, Karthikeya Musical Instrument Classification November 25, 2019 11 / 21
  • 19.
    Model Evaluation Precision isthe ratio tp (tp+fp) where tp is the number of true positives and fp the number of false positives. The precision is intuitively the ability of the classifier not to label as positive a sample that is negative. Recall is the ratio tp (tp+fn) where tp is the number of true positives and fn the number of false negatives. The recall is intuitively the ability of the classifier to find all the positive samples. Harish, Ankit, Bhushan, Vineet, Karthikeya Musical Instrument Classification November 25, 2019 11 / 21
  • 20.
    Model Evaluation Precision isthe ratio tp (tp+fp) where tp is the number of true positives and fp the number of false positives. The precision is intuitively the ability of the classifier not to label as positive a sample that is negative. Recall is the ratio tp (tp+fn) where tp is the number of true positives and fn the number of false negatives. The recall is intuitively the ability of the classifier to find all the positive samples. F1 score can be interpreted as a weighted average of the precision and recall. F1 = 2 × (precision ∗ recall) (precision + recall) Harish, Ankit, Bhushan, Vineet, Karthikeya Musical Instrument Classification November 25, 2019 11 / 21
  • 21.
    Model Evaluation Precision isthe ratio tp (tp+fp) where tp is the number of true positives and fp the number of false positives. The precision is intuitively the ability of the classifier not to label as positive a sample that is negative. Recall is the ratio tp (tp+fn) where tp is the number of true positives and fn the number of false negatives. The recall is intuitively the ability of the classifier to find all the positive samples. F1 score can be interpreted as a weighted average of the precision and recall. F1 = 2 × (precision ∗ recall) (precision + recall) Confusion Matrix is a technique to evaluate performance of a supervised classification. Calculating a confusion matrix gives a better idea of what our classification model is getting right and what types of errors it is making. Harish, Ankit, Bhushan, Vineet, Karthikeya Musical Instrument Classification November 25, 2019 11 / 21
  • 22.
    Accuracy Statistic Logistic RegessionDecision Tree LGBM Instrument P R F1 P R F1 P R F1 Flute 0.58 0.39 0.47 0.43 0.44 0.43 0.66 0.59 0.62 Piano 0.55 0.59 0.57 0.53 0.54 0.53 0.69 0.73 0.71 Trumpet 0.44 0.53 0.48 0.50 0.46 0.48 0.59 0.67 0.63 Guitar 0.63 0.57 0.60 0.60 0.57 0.58 0.73 0.68 0.71 Voice 0.58 0.48 0.52 0.52 0.50 0.51 0.72 0.54 0.62 Organ 0.51 0.61 0.56 0.50 0.55 0.52 0.63 0.74 0.68 XG Boost RF SVM Instrument P R F1 P R F1 P R F1 Flute 0.66 0.59 0.62 0.72 0.48 0.58 0.63 0.63 0.63 Piano 0.72 0.71 0.71 0.72 0.75 0.74 0.79 0.84 0.81 Trumpet 0.58 0.69 0.63 0.61 0.72 0.66 0.78 0.77 0.78 Guitar 0.71 0.72 0.71 0.73 0.72 0.72 0.77 0.76 0.77 Voice 0.75 0.53 0.62 0.74 0.54 0.62 0.78 0.67 0.72 Organ 0.65 0.74 0.69 0.63 0.80 0.70 0.79 0.85 0.82 Table: Precision, Recall & F1 Score for various Supervised Models Harish, Ankit, Bhushan, Vineet, Karthikeya Musical Instrument Classification November 25, 2019 12 / 21
  • 23.
    Model Evaluation –F1 Score Log. Reg DTree LGBM XG Boost RF SVM 0.50.60.70.8 F1-Score Figure: F1 Measure for Various Models Harish, Ankit, Bhushan, Vineet, Karthikeya Musical Instrument Classification November 25, 2019 13 / 21
  • 24.
    Instrument Performance Flute PianoTrumpet Guitar Voice Organ 0.50.60.70.8 F1-Score Figure: Instrument wise classification Harish, Ankit, Bhushan, Vineet, Karthikeya Musical Instrument Classification November 25, 2019 14 / 21
  • 25.
    Model Evaluation –Confusion Matrix (a) Logistic Regression (b) Decision Tree (c) Light GBM Figure: Confusion Matrix for various supervised Algorithms Harish, Ankit, Bhushan, Vineet, Karthikeya Musical Instrument Classification November 25, 2019 15 / 21
  • 26.
    Model Evaluation –Confusion Matrix (a) XG Boost (b) Random Forest (c) SVM Figure: Confusion Matrix for various supervised Algorithms Harish, Ankit, Bhushan, Vineet, Karthikeya Musical Instrument Classification November 25, 2019 16 / 21
  • 27.
    Unsupervised Approach Figure: KmeansClustering Harish, Ankit, Bhushan, Vineet, Karthikeya Musical Instrument Classification November 25, 2019 17 / 21
  • 28.
    Unsupervised Approach Figure: KmeansClustering K-means performed very poorly. The cost function is almost monotonically decreasing. Difficult to group the classes. Harish, Ankit, Bhushan, Vineet, Karthikeya Musical Instrument Classification November 25, 2019 17 / 21
  • 29.
    Unsupervised Approach Figure: KmeansClustering K-means performed very poorly. The cost function is almost monotonically decreasing. Difficult to group the classes. Figure: Agglomerative Clustering Harish, Ankit, Bhushan, Vineet, Karthikeya Musical Instrument Classification November 25, 2019 17 / 21
  • 30.
    Unsupervised Approach Figure: KmeansClustering K-means performed very poorly. The cost function is almost monotonically decreasing. Difficult to group the classes. Figure: Agglomerative Clustering Works in bottom up fashion. Similar points are fused at each iteration. Cutting the dendogram at height 30 gives us underlying cluster grouped into 4 classes. Harish, Ankit, Bhushan, Vineet, Karthikeya Musical Instrument Classification November 25, 2019 17 / 21
  • 31.
    Neural Network Input Layer(25) Hidden Layer 1 (40) Hidden Layer 2 (15) Output Layer (6) ReLU ReLU Softmax : : : : : : Figure: 3 Layer Neural Network Harish, Ankit, Bhushan, Vineet, Karthikeya Musical Instrument Classification November 25, 2019 18 / 21
  • 32.
    Neural Network –Continued Loss Function: Cross Entropy − 6 c=1 yo,a log(po,a) y is indicator variable and p is probability. We used the Adaptive Moment Estimation (Adam) optimizer. Harish, Ankit, Bhushan, Vineet, Karthikeya Musical Instrument Classification November 25, 2019 19 / 21
  • 33.
    Neural Network –Continued Loss Function: Cross Entropy − 6 c=1 yo,a log(po,a) y is indicator variable and p is probability. We used the Adaptive Moment Estimation (Adam) optimizer. Figure: Loss Function Accuracy: 64% Harish, Ankit, Bhushan, Vineet, Karthikeya Musical Instrument Classification November 25, 2019 19 / 21
  • 34.
    Key Takeaways Supervised Learningis good for Instrument Recognition Harish, Ankit, Bhushan, Vineet, Karthikeya Musical Instrument Classification November 25, 2019 20 / 21
  • 35.
    Key Takeaways Supervised Learningis good for Instrument Recognition SVM with RBF Kernel performs best with 79% accuracy Harish, Ankit, Bhushan, Vineet, Karthikeya Musical Instrument Classification November 25, 2019 20 / 21
  • 36.
    Key Takeaways Supervised Learningis good for Instrument Recognition SVM with RBF Kernel performs best with 79% accuracy Agglomerative Clustering performs better among unsupervised approaches Harish, Ankit, Bhushan, Vineet, Karthikeya Musical Instrument Classification November 25, 2019 20 / 21
  • 37.
    Key Takeaways Supervised Learningis good for Instrument Recognition SVM with RBF Kernel performs best with 79% accuracy Agglomerative Clustering performs better among unsupervised approaches Future Directions: Can experiment with parameter tuning of neural nets. Use a CNN to train a classifier which can classify instrument given an image of spectogram Harish, Ankit, Bhushan, Vineet, Karthikeya Musical Instrument Classification November 25, 2019 20 / 21
  • 38.
    Acknowledgement & References Boschet al. A comparison of sound segregation techniques for predominant instrument recognition in musical audio signals. ISMIR 2012 Deng et al. A study on feature analysis for musical instrument classification. IEEE Transactions on Systems, Man, and Cybernetics 2008 Eronen et al. Musical instrument recognition using cepstral coefficients and temporal features. ICASSP 2000 All the code used is available in github. https://github.com/vntkumar8/ musical-instrument-classification Thanks to for vm. Thank You! Questions? Harish, Ankit, Bhushan, Vineet, Karthikeya Musical Instrument Classification November 25, 2019 21 / 21