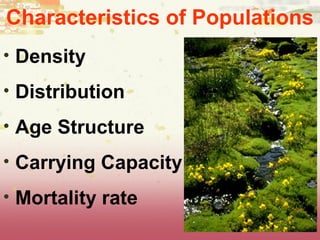
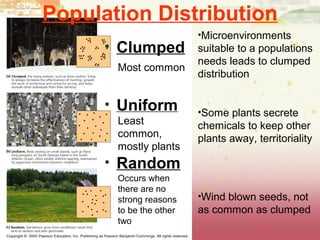
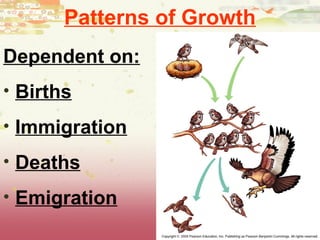
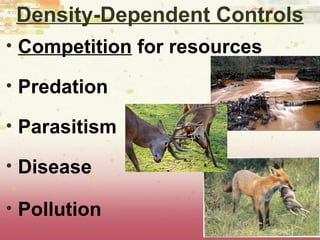
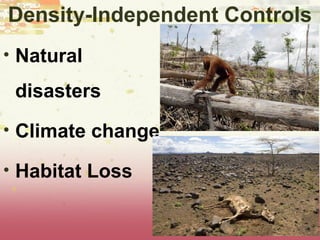
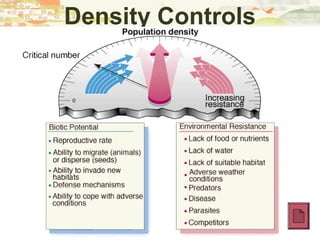
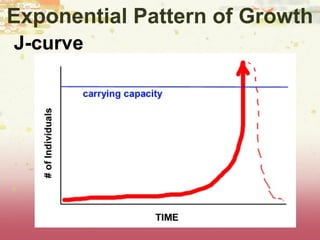
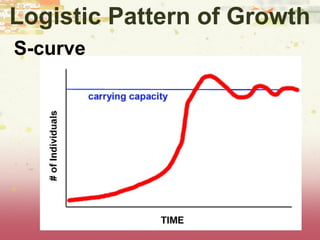
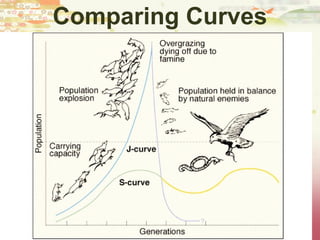
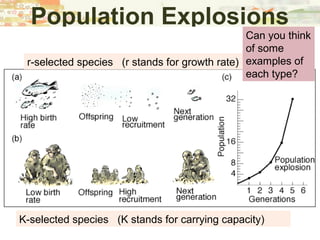
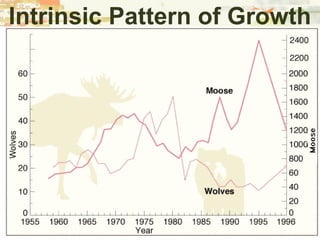
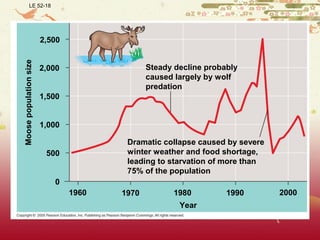
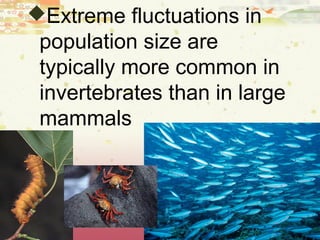
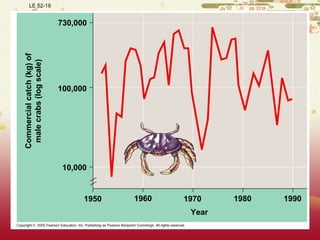
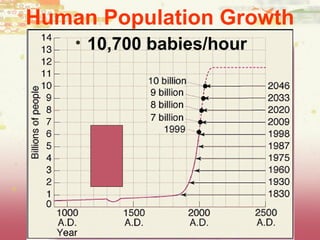
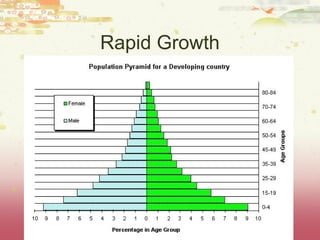
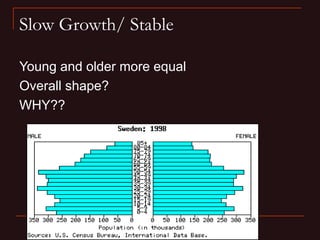
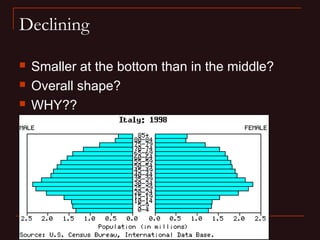
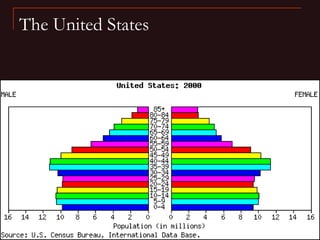
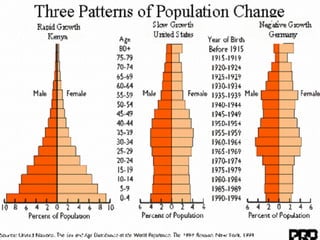
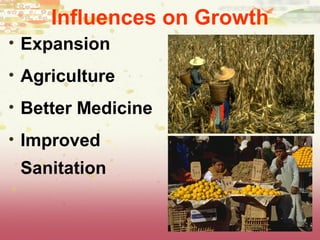
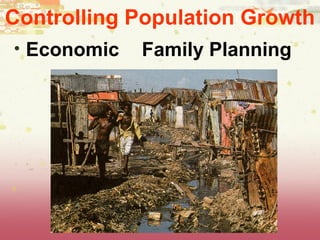
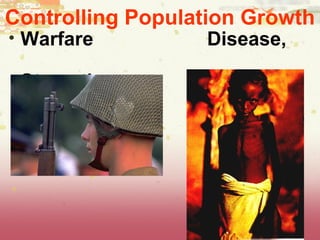
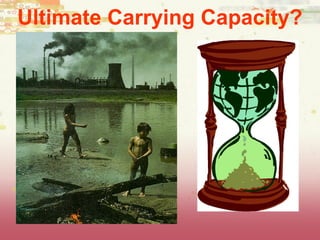
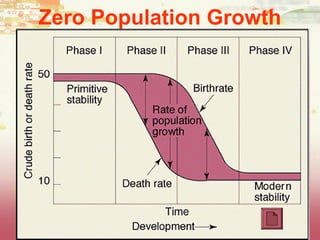
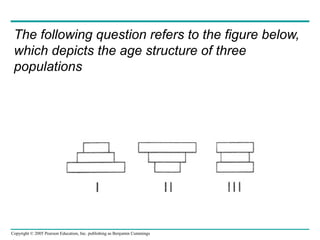
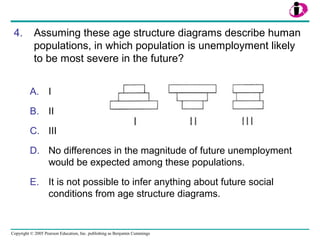
Objectives
yesterday
 You have to identify what
components make up the
climate of an area and
thus biome distribution
AND
List as many biomes as you
could
today
 You need to distinguish
between density
dependent and density
independent limiting
factors
AND
Give several examples of
each type
POPULATIONS
Characteristics of Populations
• Density
• Distribution
• Age Structure
• Carrying Capacity
• Mortality rate
Population Distribution
• Clumped
• Uniform
• Random
•Microenvironments
suitable to a populations
needs leads to clumped
distribution
•Some plants secrete
chemicals to keep other
plants away, territoriality
•Wind blown seeds, not
as common as clumped
Most common
Least
common,
mostly plants
Occurs when
there are no
strong reasons
to be the other
two
Patterns of Growth
Dependent on:
• Births
• Immigration
• Deaths
• Emigration
Limiting Factors
• Major factor in
defining an
organisms niche
• e.g tall trees
cannot grow in
desert
• Water is limiting
Other Limiting Factors?
•
•
•
•
•
•
•
???
Density-Dependent Controls
• Competition for resources
• Predation
• Parasitism
• Disease
• Pollution
Density-Independent Controls
• Natural
disasters
• Climate change
• Habitat Loss
Density Controls
J-curve
Exponential Pattern of Growth
Logistic Pattern of Growth
S-curve
Comparing Curves
Population Explosions
r-selected species (r stands for growth rate)
K-selected species (K stands for carrying capacity)
Can you think
of some
examples of
each type?
Intrinsic Pattern of Growth
LE 52-18
1960
Year
Moosepopulationsize
2,500
Steady decline probably
caused largely by wolf
predation
2,000
1,500
1,000
500
0
1970 1980 1990 2000
Dramatic collapse caused by severe
winter weather and food shortage,
leading to starvation of more than
75% of the population
Extreme fluctuations in
population size are
typically more common in
invertebrates than in large
mammals
LE 52-19
1960
Year
Commercialcatch(kg)of
malecrabs(logscale)
730,000
100,000
10,000
1970 1980 19901950
Human Population Growth
• 10,700 babies/hour
Rapid Growth
Slow Growth/ Stable
Young and older more equal
Overall shape?
WHY??
Declining
 Smaller at the bottom than in the middle?
 Overall shape?
 WHY??
The United States
Nearly ½ of the human
population lives within this circle
Influences on Growth
• Expansion
• Agriculture
• Better Medicine
• Improved
Sanitation
Controlling Population Growth
• Economic Family Planning
Controlling Population Growth
• Warfare Disease,
Starvation
Ultimate Carrying Capacity?
Zero Population Growth
Copyright © 2005 Pearson Education, Inc. publishing as Benjamin Cummings
1. A few members of a population have reached a favorable
habitat with few predators and unlimited resources, but their
population growth rate is slower than that of the parent
population. What is a possible explanation for this situation? *
a) The genetic makeup of these founders may be less favorable
than that of the parent population.
b) The parent population may still be in the exponential part of its
growth curve and not yet limited by density-dependent factors.
c) There are not enough population members present for
successful reproduction.
d) a, b, and c may apply.
e) This scenario would not happen.
Copyright © 2005 Pearson Education, Inc. publishing as Benjamin Cummings
2. As N approaches K for a certain population,
which of the following is predicted by the
logistic growth equation?
a) The growth rate will not change.
b) The growth rate will approach zero.
c) The population will not have enough
members to reproduce successfully.
d) The population will increase exponentially.
e) The carrying capacity of the environment will
increase.
Copyright © 2005 Pearson Education, Inc. publishing as Benjamin Cummings
3. In which of the following habitats would you
expect to find the largest number of K-
selected individuals?
a) an abandoned field in Ohio
b) the sand dunes south of Lake Michigan
c) the rain forests of Brazil
d) south Florida after a hurricane
e) a newly emergent volcanic island
Copyright © 2005 Pearson Education, Inc. publishing as Benjamin Cummings
The following question refers to the figure below,
which depicts the age structure of three
populations
Copyright © 2005 Pearson Education, Inc. publishing as Benjamin Cummings
4. Assuming these age structure diagrams describe human
populations, in which population is unemployment likely
to be most severe in the future?
A. I
B. II
C. III
D. No differences in the magnitude of future unemployment
would be expected among these populations.
E. It is not possible to infer anything about future social
conditions from age structure diagrams.
Copyright © 2005 Pearson Education, Inc. publishing as Benjamin Cummings
5. Which of the following variables is (are)
important in contributing to the rapid growth of
human populations?
A. the high percentage of young people
B. the average age to first give birth
C. carrying capacity of the environment
D. only A and B
E. A, B, and C

AP Biology population ecology

  • 1.
    Objectives yesterday  You haveto identify what components make up the climate of an area and thus biome distribution AND List as many biomes as you could today  You need to distinguish between density dependent and density independent limiting factors AND Give several examples of each type
  • 2.
  • 3.
    Characteristics of Populations •Density • Distribution • Age Structure • Carrying Capacity • Mortality rate
  • 4.
    Population Distribution • Clumped •Uniform • Random •Microenvironments suitable to a populations needs leads to clumped distribution •Some plants secrete chemicals to keep other plants away, territoriality •Wind blown seeds, not as common as clumped Most common Least common, mostly plants Occurs when there are no strong reasons to be the other two
  • 5.
    Patterns of Growth Dependenton: • Births • Immigration • Deaths • Emigration
  • 6.
    Limiting Factors • Majorfactor in defining an organisms niche • e.g tall trees cannot grow in desert • Water is limiting
  • 7.
  • 8.
    Density-Dependent Controls • Competitionfor resources • Predation • Parasitism • Disease • Pollution
  • 9.
  • 10.
  • 11.
  • 12.
    Logistic Pattern ofGrowth S-curve
  • 13.
  • 14.
    Population Explosions r-selected species(r stands for growth rate) K-selected species (K stands for carrying capacity) Can you think of some examples of each type?
  • 15.
  • 16.
    LE 52-18 1960 Year Moosepopulationsize 2,500 Steady declineprobably caused largely by wolf predation 2,000 1,500 1,000 500 0 1970 1980 1990 2000 Dramatic collapse caused by severe winter weather and food shortage, leading to starvation of more than 75% of the population
  • 17.
    Extreme fluctuations in populationsize are typically more common in invertebrates than in large mammals
  • 18.
  • 19.
    Human Population Growth •10,700 babies/hour
  • 20.
  • 21.
    Slow Growth/ Stable Youngand older more equal Overall shape? WHY??
  • 22.
    Declining  Smaller atthe bottom than in the middle?  Overall shape?  WHY??
  • 23.
  • 25.
    Nearly ½ ofthe human population lives within this circle
  • 26.
    Influences on Growth •Expansion • Agriculture • Better Medicine • Improved Sanitation
  • 27.
    Controlling Population Growth •Economic Family Planning
  • 28.
    Controlling Population Growth •Warfare Disease, Starvation
  • 29.
  • 30.
  • 31.
    Copyright © 2005Pearson Education, Inc. publishing as Benjamin Cummings 1. A few members of a population have reached a favorable habitat with few predators and unlimited resources, but their population growth rate is slower than that of the parent population. What is a possible explanation for this situation? * a) The genetic makeup of these founders may be less favorable than that of the parent population. b) The parent population may still be in the exponential part of its growth curve and not yet limited by density-dependent factors. c) There are not enough population members present for successful reproduction. d) a, b, and c may apply. e) This scenario would not happen.
  • 32.
    Copyright © 2005Pearson Education, Inc. publishing as Benjamin Cummings 2. As N approaches K for a certain population, which of the following is predicted by the logistic growth equation? a) The growth rate will not change. b) The growth rate will approach zero. c) The population will not have enough members to reproduce successfully. d) The population will increase exponentially. e) The carrying capacity of the environment will increase.
  • 33.
    Copyright © 2005Pearson Education, Inc. publishing as Benjamin Cummings 3. In which of the following habitats would you expect to find the largest number of K- selected individuals? a) an abandoned field in Ohio b) the sand dunes south of Lake Michigan c) the rain forests of Brazil d) south Florida after a hurricane e) a newly emergent volcanic island
  • 34.
    Copyright © 2005Pearson Education, Inc. publishing as Benjamin Cummings The following question refers to the figure below, which depicts the age structure of three populations
  • 35.
    Copyright © 2005Pearson Education, Inc. publishing as Benjamin Cummings 4. Assuming these age structure diagrams describe human populations, in which population is unemployment likely to be most severe in the future? A. I B. II C. III D. No differences in the magnitude of future unemployment would be expected among these populations. E. It is not possible to infer anything about future social conditions from age structure diagrams.
  • 36.
    Copyright © 2005Pearson Education, Inc. publishing as Benjamin Cummings 5. Which of the following variables is (are) important in contributing to the rapid growth of human populations? A. the high percentage of young people B. the average age to first give birth C. carrying capacity of the environment D. only A and B E. A, B, and C

Editor's Notes

  • #32 Answer: d Source: Taylor - Student Study Guide for Biology, Sixth Edition, Test Your Knowledge Question #6. Discussion Notes for the Instructor This question incorporates both population genetics and population growth with multiple answers that are correct. It can be followed by asking questions about what type of data would be needed to differentiate between these choices. This would include data on the genetic make-up of the population, the pattern of population growth (exponential vs logistic) and the actual population size.
  • #33 Answer: b Source: Barstow - Test Bank for Biology, Sixth Edition, Question #29.
  • #34 Answer: c Source: Barstow - Test Bank for Biology, Sixth Edition, Question #43.
  • #35 Answer: 1 Source: Barstow - Test Bank for Biology, Sixth Edition, Question #56.
  • #36 Answer: a Source: Barstow - Test Bank for Biology, Sixth Edition, Question #56.
  • #37 Answer: d Source: Barstow - Test Bank for Biology, Sixth Edition, Question #62.