Downloaded 286 times


![•
•
•
•
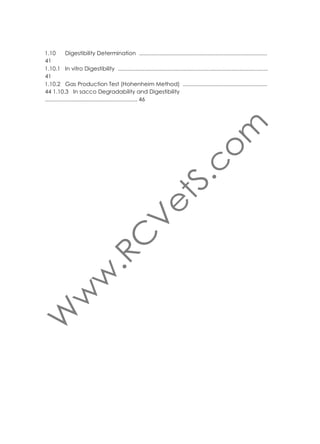
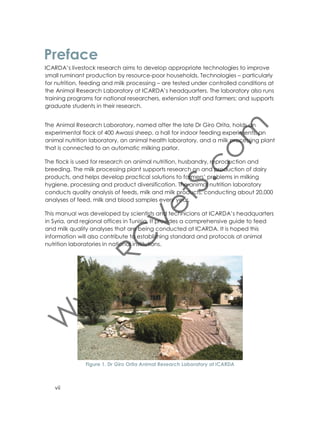
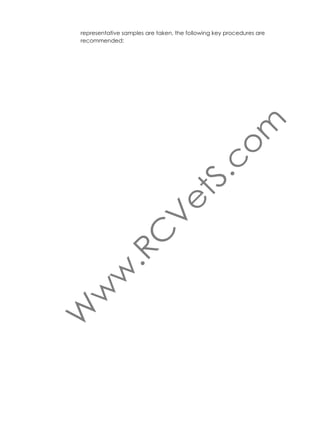
Add approximately 2 g of ground sample; record weight (Ws)
Dry overnight at 105 °C
Cool in desiccators to room temperature
Weight oven–dry crucible+sample = (W0)
For milk and milk derivatives samples
• For dry matter based analyses, 2 ml of milk are dried in crucibles
overnight at 105 °C and its weight taken
• For cheese, a 2 g sample is dried overnight at 105 °C and then dry
weight taken.
Calculations
%DM = [(W0–Wt )/Ws ]×100
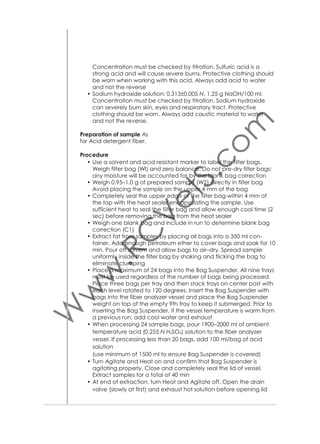
Equipment
• Precision balance (Fig. 5)
• Air-circulation oven (Fig. 6)
• Desiccator (Fig. 7)
• Porcelain crucibles (Fig. 9).
References
• AOAC. 1995.
Figure 5. Precision balance
Figure 6. Air-circulation oven
5
Figure 7. Desiccator](https://image.slidesharecdn.com/animalnutritionlabmanual2-140205071028-phpapp02/85/Animal-Nutrition-Lab-Manual-2-14-320.jpg)
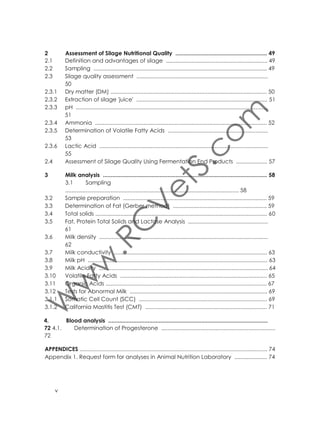
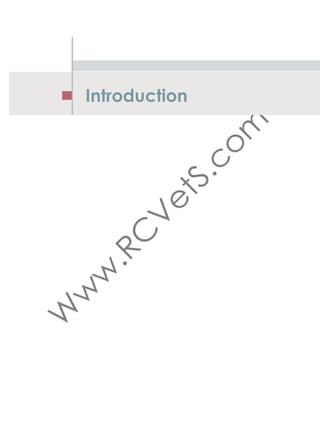
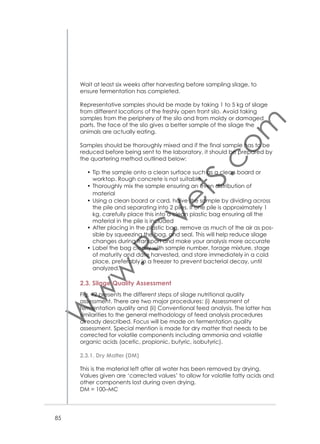
![1.2.2. Determination of Ash
Procedure
• Ignite dry matter samples (see 1.2.1) overnight at 550 °C in muffle
furnace
• Cool in desiccators to room temperature
• Weigh ignited crucible + sample (Wa).
Calculation
%Ash = [(Wa–Wt )/(W0–Wt)]×100
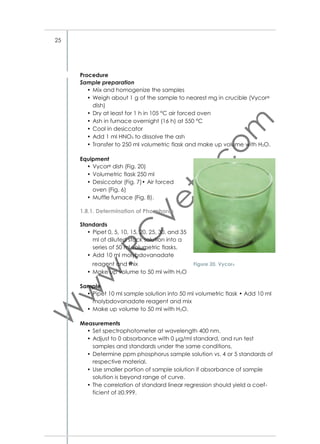
Equipment
• Precision balance (Fig. 5)
• Muffle furnace (550 °C) (Fig. 8)
• Desiccator (Fig. 7)
• Porcelain crucibles (Fig. 9).
Figure 8. Muffle furnace
Figure 9. Porcelain crucible
Reference
• AOAC.1995.
1.2.3. Determination of Organic Dry Matter (ODM)
Calculations
%ODM = 100 – %Ash
6](https://image.slidesharecdn.com/animalnutritionlabmanual2-140205071028-phpapp02/85/Animal-Nutrition-Lab-Manual-2-15-320.jpg)
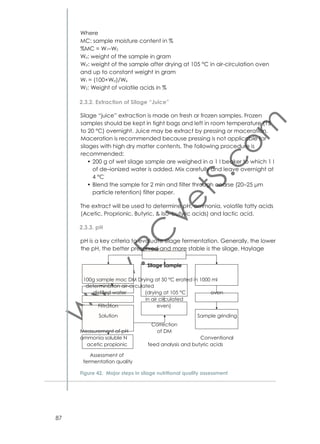
![1.3. Determination of Crude Protein
Principle
Determination of total nitrogen (crude protein) is conducted using the
Kjeldahl method. The sample is digested in sulfuric acid using K2SO4/
CuSO4/TiO4 as a catalyst. N is converted into NH3, then distilled trapped
in boric acid and titrated with H2SO4.
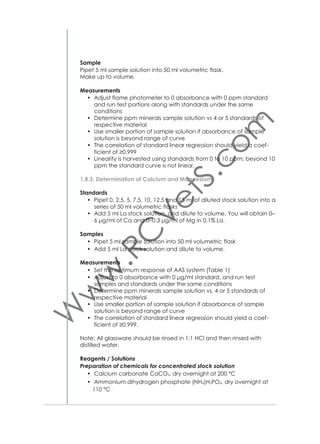
Procedure
• Add 1g of dry sample in digestion tubes (250 ml)
• Consider blank tube
• Consider standard sample of known nitrogen contents
• Add half a tablet of catalyst
• Add 13 ml of concentrated sulfuric acid (H2SO4)
• Insert rack with 20 tubes, including blank and standard sample in
digestion block heater under fume hood, and install exhaust manifold connected to water aspirator (Fig.11)
• Keep in digester at 420 °C until liquid becomes transparent
• Remove rack with exhaust manifold from digester and allow to
cool to room temperature under fume hood
• Remove exhaust manifold and transfer tubes separately to distillation unit
• Automatic distillation: 65 ml dist. water + 35 ml of 40% sodium hydroxide solution
• Collect condensed liquid in Erlenmeyer flask with 10 ml indicator
solution
• Titrate liquid with 0.1142 N sulfuric acid until color turns purple.
Calculations
%N = [1.4007×(Va–Vb)×N]/W
Va: volume of acid used for sample titration
Vb: volume of acid used for the blank
N: Normality of acid
W: sample weight in grams
1.4007: conversion factor milliequivalent weight of nitrogen and N
percent
Calculation: Percent Crude Protein (CP)
%CP = %N × F
F = 6.25 for all forages
F = 5.70 for wheat grains
F = 6.38 for milk
Using acid normality of 0.1142 one can consider that each ml of above
sulfuric acid added at titration corresponds to 1% of crude protein (CP)
if the above conversion factor (F) is equal to 6.25.
7](https://image.slidesharecdn.com/animalnutritionlabmanual2-140205071028-phpapp02/85/Animal-Nutrition-Lab-Manual-2-16-320.jpg)
![Reagents / Solutions
TCA Solution
• Trichloroacetic acid (CCl3COOH) 10% w/v in water
Reference
• Licitra G, Hernandez TM and VanSoest PJ. 1996.
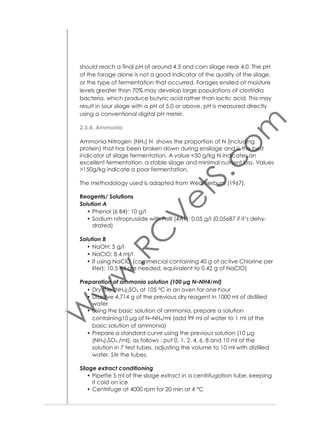
1.5. Determination of Fat
Principle
The dried feed sample is dissolved with petrol ether and then the ether
is evaporated in the Soxhlet apparatus. The residues are crude fat.
In the Animal Nutrition Laboratory at ICARDA a Soxtherm apparatus
from Gerhardt GmbH is used. The procedure described below follows
the instruction for this specific Soxhlet apparatus. In the laboratory the
modified method for determination of fat in meat has been adapted.
Procedure
• Fill extraction beakers with boiling stones dried at 103 °C (Fig. 14)
• Cool beakers down to room temperature in desiccator
• Weigh beakers on precision balance (W0)
• Weigh 5 g of dried samples in extraction thimbles (Ws)
• Cover with fat free cotton
• Insert extraction thimble into extraction beaker
• Add 140 ml of petrol ether and insert beaker in Soxhlet apparatus
(Fig. 13)
• Start program
• Program:
1. Boiling time
30 min
2. Solvent reduction
5×15 min
3. Extraction time
80 min
4. Extraction temperature
150 °C
5. Solvent reduction
8 min
6. Solvent reduction
5 min
7. Solvent reduction interval
3 min
8. Solvent reduction phase
3 sec
• After termination of program, dry beakers at 105 °C overnight
• Cool beakers down to room temperature in desiccator and weigh
(We).
Calculations
%Crude fat = [(We–W0 )/(Ws×%DM)]×100
Reagents / Solutions
Petrol ether (40–60 °C)
10](https://image.slidesharecdn.com/animalnutritionlabmanual2-140205071028-phpapp02/85/Animal-Nutrition-Lab-Manual-2-19-320.jpg)
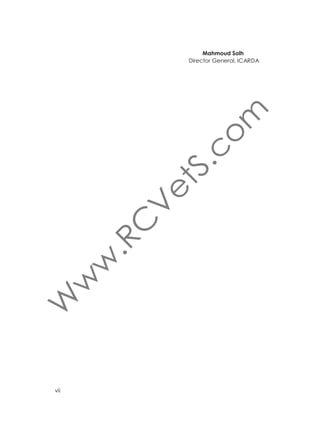
![Procedure
• Weigh oven-dry glass crucible (Wt)
• Add 0.5–1 g sample (Ws) in 600 ml Berzelius beaker
• Add 100 ml of neutral detergent solution and 0.5 g sodium sulfite
(Na2SO3)
• Boil for one hour in refluxing apparatus (Fig. 15)
• Pour through glass crucibles (Fig. 17)
• Admit vacuum (Fig. 16)
• Rinse crucibles with approximately 50 ml hot water four times until
all traces are removed
• Rinse with acetone repeatedly until drained liquid is cleared.
• Dry at 105 °C overnight
• Cool to room temperature in desiccator
• Weigh sample and crucible (W0)
• Ash residues for three hours at 550 °C
• Cool to room temperature in desiccators
• Weight crucibles and residues (Wa).
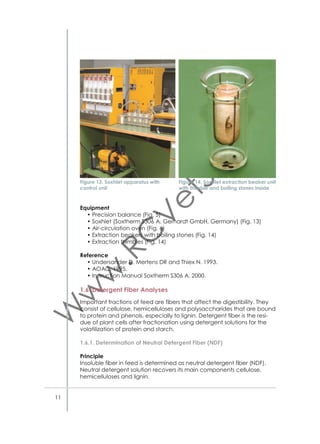
Figure 15. Refluxing apparatus
Calculations
%NDF = [(W0–Wt)/Ws]×100
Cell soluble material = 100 – %NDF
NDF expressed as organic matter:
Ash insoluble in neutral detergent
%NDFash = [(Ws–Wt )/(W0–Wt)]×100
Neutral detergent solution
• 2 l distilled water.
• 60 g sodium lauryl sulfate (C12H25O4S)
• 37.22 g disodium dihydrogen EDTA (C10H14N2Na2O8)
• 13.62 g sodium borate (decahydrate) (Na2B4O7.10H2O)
12](https://image.slidesharecdn.com/animalnutritionlabmanual2-140205071028-phpapp02/85/Animal-Nutrition-Lab-Manual-2-21-320.jpg)
![•
•
•
•
•
•
•
•
•
•
•
Weigh oven–dry glass crucible (Wt)
Pour through glass crucibles
Admit vacuum
Rinse crucibles with approximately 50 ml hot water four times until
all traces are removed
Rinse with acetone repeatedly until drained liquid is cleared
Dry at 105 °C overnight
Cool to room temperature in desiccator
Weight sample and crucible (W0)
Ash residues for three hours at 550 °C
Cool to room temperature in desiccator
Weight crucibles and residues (Wa).
Calculations
%ADF = [(W0–Wt)/Ws]×100
ADF expressed as organic matter:
%ADFash = [(Wa–Wt)/(W0–Wt)]×100
Acid detergent solution
• 20 g cetyl trimethylammonium bromide (CTAB)
• 1l of 1.0 N sulfuric acid (H2SO4).
Equipment
• Precision balance (Fig. 5)
• Refluxing apparatus (Fig. 15)
• Vacuum filtering system with trap in line (Fig. 16)
• Desiccator (Fig. 7)
• Berzelius beakers (600 ml)
• Sintered glass crucibles (coarse porosity 1) (Fig. 17).
References
• Goering HK and VanSoest PJ. 1970.
• AOAC. 1995.
• Undersander D, Mertens DR and Thiex N. 1993.
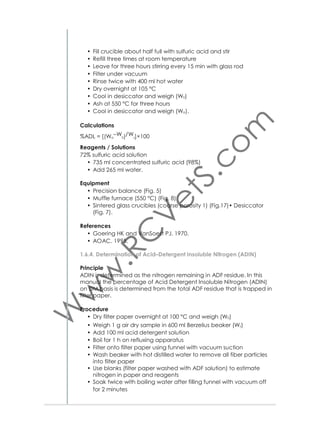
1.6.3. Determination of Acid Detergent Lignin (ADL)
Principle
Lignin is the indigestible non-carbohydrate component of forages.
Residues from ADF determination are treated with sulfuric acid. Lignin
represents the indigestible NDF fraction.
Procedure
• Transfer crucibles with residues from ADF to a flat container or tray
• Cover the contents of the crucible with cooled 72% sulfuric acid
(H2SO4)
• Stir with glass rod, breaking all lumps
14](https://image.slidesharecdn.com/animalnutritionlabmanual2-140205071028-phpapp02/85/Animal-Nutrition-Lab-Manual-2-23-320.jpg)
![•
•
•
•
•
•
•
•
•
Fill crucible about half full with sulfuric acid and stir
Refill three times at room temperature
Leave for three hours stirring every 15 min with glass rod
Filter under vacuum
Rinse twice with 400 ml hot water
Dry overnight at 105 °C
Cool in desiccator and weigh (W0)
Ash at 550 °C for three hours
Cool in desiccator and weigh (Wa).
Calculations
%ADL = [(Wa–W0)/Ws]×100
Reagents / Solutions
72% sulfuric acid solution
• 735 ml concentrated sulfuric acid (98%)
• Add 265 ml water.
Equipment
• Precision balance (Fig. 5)
• Muffle furnace (550 °C) (Fig. 8)
• Sintered glass crucibles (coarse porosity 1) (Fig.17)
• Desiccator (Fig. 7).
References
• Goering HK and VanSoest PJ. 1970.
• AOAC. 1995.
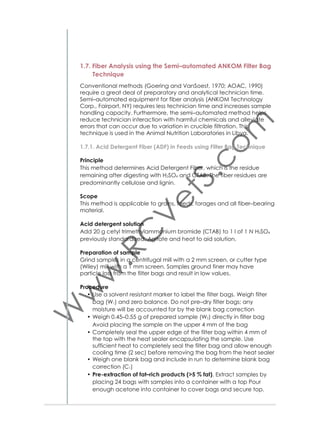
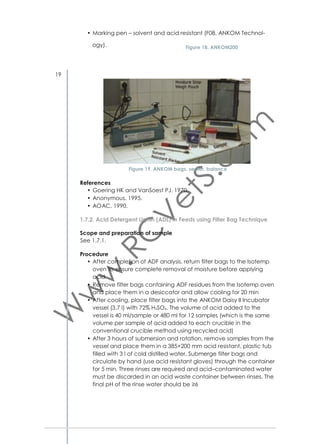
1.6.4. Determination of Acid–Detergent Insoluble Nitrogen (ADIN)
Principle
ADIN is determined as the nitrogen remaining in ADF residue. In this
manual the percentage of Acid Detergent Insoluble Nitrogen (ADIN)
on DM basis is determined from the total ADF residue that is trapped in
filter paper.
Procedure
• Dry filter paper overnight at 100 °C and weigh (W0)
• Weigh 1 g air dry sample in 600 ml Berzelius beaker (Ws)
• Add 100 ml acid detergent solution
• Boil for 1 h on refluxing apparatus
• Filter onto filter paper using funnel with vacuum suction
• Wash beaker with hot distilled water to remove all fiber particles
into filter paper
• Use blanks (filter paper washed with ADF solution) to estimate nitrogen in paper and reagents
• Soak twice with boiling water after filling funnel with vacuum off for 2 minutes
15](https://image.slidesharecdn.com/animalnutritionlabmanual2-140205071028-phpapp02/85/Animal-Nutrition-Lab-Manual-2-24-320.jpg)
![• Rinse twice with acetone by filling funnel with vacuum off for 2
minutes before vacuuming dry
• Leave folded filter paper with residues in oven at 105 °C for 8 h or
overnight
• Weigh hot filter paper with residues (Wr)
• Transfer paper residue into Kjeldahl digestion tube
• Add additional 5 ml sulfuric acid to digest filter paper
• Determine nitrogen in residue by standard Kjeldahl
• Titrate with 0.01 N standard acid.
Calculation
%ADIN = [(%N in Wt – %N in W0)/(Ws×%DM)]×100
Reagents / Solutions
• Standard ADF solution (see 1.6.2.)
• For titration 0.01 N sulfuric acid (H2SO4) (see 1.6.2.).
Equipment
• Precision balance (Fig. 5)
• Refluxing apparatus (see Fig. 15)
• Vacuum filtering system with trap in line (Fig. 16)
• Air-circulation oven (Fig. 6)
• Berzelius beakers (600 ml)
• Sintered glass crucibles (course porosity 1) (Fig. 17)
• Büchner funnel
• Whatman filter paper number 54 or 541.
Crucible cleaning
The sintered glass crucibles (coarse porosity1) that are used for detergent fiber analyses (1.6.) need to be cleaned regularly as follows:
• Place crucibles on a metal tray and pull washing solution to cover
the bottom of the crucibles
• Keep overnight for 18 hours
• Rinse with distilled water until clear
• Dry crucibles in oven at 105 °C.
Washing solution
Dissolve 6 g of either Sodium dichromate or Potassium dichromate in
100 ml distilled water and then add 100 ml of concentrated sulfuric acid
References
• Licitra G, Hernandez TM and VanSoest PJ. 1996.
16](https://image.slidesharecdn.com/animalnutritionlabmanual2-140205071028-phpapp02/85/Animal-Nutrition-Lab-Manual-2-25-320.jpg)

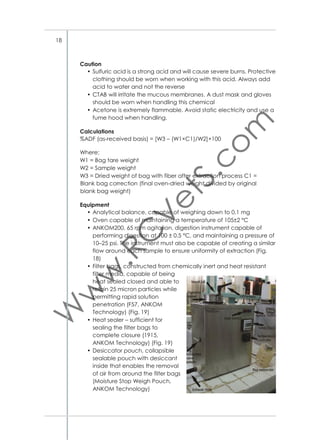
![Caution
• Sulfuric acid is a strong acid and will cause severe burns. Protective
clothing should be worn when working with this acid. Always add
acid to water and not the reverse
• CTAB will irritate the mucous membranes. A dust mask and gloves
should be worn when handling this chemical
• Acetone is extremely flammable. Avoid static electricity and use a
fume hood when handling.
Calculations
%ADF (as-received basis) = [W3 – (W1×C1)/W2]×100
Where:
W1 = Bag tare weight
W2 = Sample weight
W3 = Dried weight of bag with fiber after extraction process
C1 = Blank bag correction (final oven-dried weight divided by original
blank bag weight)
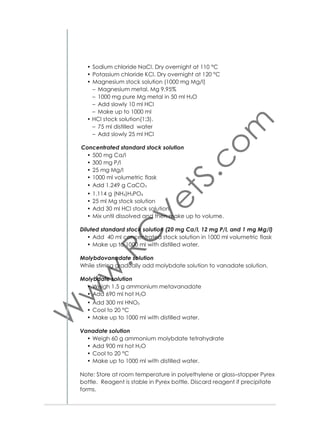
Equipment
• Analytical balance, capable of weighing down to 0.1 mg
• Oven capable of maintaining a temperature of 105±2 °C
• ANKOM200, 65 rpm agitation, digestion instrument capable of
performing digestion at 100 ± 0.5 °C, and maintaining a pressure of
10–25 psi. The instrument must also be capable of creating a similar
flow around each sample to ensure uniformity of extraction (Fig. 18)
• Filter bags, constructed from chemically inert and heat resistant
filter media, capable of being
heat sealed closed and able
to retain 25 micron particles
while permitting rapid solution
penetration (F57, ANKOM Technology) (Fig. 19)
• Heat sealer – sufficient for sealing the filter bags to complete
closure (1915, ANKOM Technology) (Fig. 19)
• Desiccator pouch, collapsible
sealable pouch with desiccant inside that enables the
removal of air from around the
filter bags (Moisture Stop Weigh
Pouch, ANKOM Technology)
• Marking pen – solvent and acid
resistant (F08, ANKOM Technology).
Figure 18. ANKOM200
19](https://image.slidesharecdn.com/animalnutritionlabmanual2-140205071028-phpapp02/85/Animal-Nutrition-Lab-Manual-2-28-320.jpg)
![drying within 2–4 h). Do not place bags in the oven until acetone
has completely evaporated
• Remove bags from oven, place directly into a collapsible desiccant pouch and flatten to remove air. Cool to ambient temperature and weigh bags (W3). Do not use conventional desiccator
container.
Calculations
%ADL (as-received basis) = [W3 – (W1×C1)/W2]×100
Where:
W1 = Bag tare weight
W2 = Sample weight
W3 = Dried weight of bag with fiber after extraction process
C1 = Blank bag correction (final oven–dried weight divided by original
blank bag weight)
Equipment
• See Acid detergent fiber (1.7.1)
References
• Goering HK and VanSoest PJ.1970.
• Anonymous. 1995.
• AOAC. 1990.
1.7.3. Neutral Detergent Fiber (NDF) in Feeds using Filter Bag Technique
Principle
This method determines Neutral Detergent Fiber, which is the residue
remaining after digesting in a detergent solution. The fiber residues are
predominantly hemicelluloses, cellulose, and lignin.
Scope
This method is applicable to grains, feeds, forages and all fiber–bearing
material.
Reagents / Solutions
• Neutral Detergent Solution: Add 30 g sodium lauryl sulfate, USP;
18.61 g Ethylenediamine-tetraacetic disodium salt, dihydrate; 6.81
g sodium tetraborate decahydrate; 4.56 g sodium phosphate
dibasic, anhydrous; and 10 ml triethylene glycol, in 1 l distilled H2O
Check pH range to 6.9 to 7.1. Agitate and heat to aid solution
• Alpha-amylase: Heat-stable bacterial alpha-amylase: activity =
17,400 Liquefon Units/ml (FAA, ANKOM Technology)
• Sodium sulfite: Na2SO3, anhydrous.
21](https://image.slidesharecdn.com/animalnutritionlabmanual2-140205071028-phpapp02/85/Animal-Nutrition-Lab-Manual-2-30-320.jpg)

![• Remove bags from acetone and place on a wire screen to air-dry.
Completely dry in oven at 105±2 °C (most ovens will complete drying within 2–4 h). Do not place bags in the oven until acetone has
completely evaporated
• Remove bags from oven, place directly into a collapsible desiccant pouch and flatten to remove air. Cool to ambient temperature and weigh bags (W3). Do not use conventional desiccator
container.
Calculations
%NDF (as–received basis) = [W3 – (W1×C1)/W2]×100
Where:
W1 = Bag tare weight
W2 = Sample weight
W3 = Dried weight of bag with fiber after extraction process
C1 = Blank bag correction (final oven-dried weight divided by the original blank bag weight)
Caution
• Powdered chemicals will irritate the mucous membranes. A dust
mask and gloves should be worn when handling this chemical
• Acetone is extremely flammable. Avoid static electricity and use a
fume hood when handling.
Equipment
• As for Acid detergent fiber.
References
• Goering HK and VanSoest PJ. 1970.
• Anonymous. 1995.
• AOAC. 1990.
1.7.4. Crude Fiber Analysis in Feeds by Filter Bag Technique
Principle
This method determines crude fiber which is the organic residue
remaining after digesting with 0.255 N H2SO4 and 0.313 N NaOH. The
compounds removed are predominantly protein, sugar, starch, lipids
and portions of both the structural carbohydrates and lignin.
Scope
This method is applicable for all feed materials such as grains, meals, pet
foods, mixed feeds, forages and the following oilseeds: corn and soybeans.
Reagents / Solutions
• Sulfuric acid solution: Density 0.255±0.005, 1.25 g H2SO4/100 ml.
23](https://image.slidesharecdn.com/animalnutritionlabmanual2-140205071028-phpapp02/85/Animal-Nutrition-Lab-Manual-2-32-320.jpg)

![• Note: The solution in the vessel is under pressure. The exhaust valve
needs to be opened to release the pressure and solution prior to
opening the lid
• After the solution has been exhausted, close the exhaust valve
and open the lid. Add 1900 ml of (50–85 °C) rinse water and agitate for 5 min. The lid may be sealed with the Heat on or left open
with the Heat off. Repeat hot water rinse (total of two rinses)
• When the rinsing process is complete remove the samples. Gently
press out excess water from bags. Place bags in a 250 ml beaker,
add enough acetone to cover bags and soak for 3–5 min.
• Remove bags from acetone and place on a wire screen to air–dry.
Completely dry in oven at 105±2 °C (most ovens will complete drying within 2–4 h). Do not place bags in the oven until acetone has
completely evaporated
• Remove bags from oven, place directly into a collapsible desiccant pouch and flatten to remove air. Cool to ambient temperature and weigh bags
• Ash the entire bag/sample in pre-weighed crucible for 2 h at
600±15 °C, cool in desiccator and weigh to calculate loss of
weight of organic matter (W3).
Calculations
% Crude Fiber = [W3–(W1×C1)/W2]×100
Where:
W1 = Bag tare weight,
W2 = Sample weight
W3 = Weight of Organic Matter (Loss of weight on ignition of bag and
fiber)
C1 = Ash corrected blank bag factor (Loss of weight on ignition of
blank bag/original blank bag)
Equipment
As for Acid detergent fiber.
References
• Goering HK and VanSoest PJ. 1970.
• Anonymous. 1995.
• AOAC. 1990.
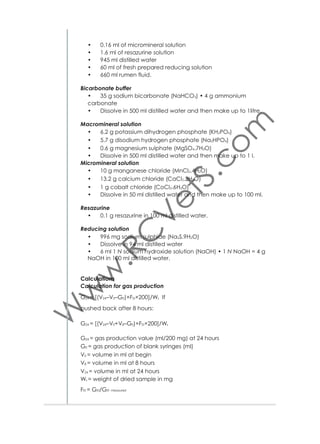
1.8. Determination of Macro and Micro Minerals
Principle
Samples are dried and ashed. The ash is dissolved in acid and diluted
with water. The minerals in the diluted ash are determined.
25](https://image.slidesharecdn.com/animalnutritionlabmanual2-140205071028-phpapp02/85/Animal-Nutrition-Lab-Manual-2-34-320.jpg)


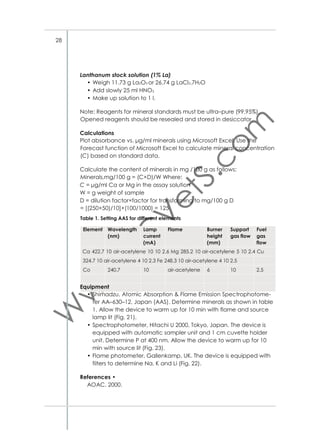
![Lanthanum stock solution (1% La)
• Weigh 11.73 g La2O3 or 26.74 g LaCl3.7H2O
• Add slowly 25 ml HNO3
• Make up solution to 1 l.
Note: Reagents for mineral standards must be ultra–pure (99.95%).
Opened reagents should be resealed and stored in desiccator.
Calculations
Plot absorbance vs. μg/ml minerals using Microsoft Excel. Use the Forecast function of Microsoft Excel to calculate mineral concentration (C)
based on standard data.
Calculate the content of minerals in mg /100 g as follows:
Minerals,mg/100 g = (C×D)/W
Where:
C = μg/ml Ca or Mg in the assay solution
W = g weight of sample
D = dilution factor×factor for transforming to mg/100 g
D = [(250×50)/10]×(100/1000) = 125
Table 1. Setting AAS for different elements
Element
Wavelength
(nm)
Lamp
current
(mA)
Flame
Burner
height
(mm)
Support
gas flow
Fuel
gas
flow
Ca
422.7
10
air-acetylene
10
10
2.6
Mg
285.2
10
air-acetylene
5
10
2.4
Cu
324.7
10
air-acetylene
4
10
2.3
Fe
248.3
10
air-acetylene
4
10
2.5
Co
240.7
10
air-acetylene
6
10
2.5
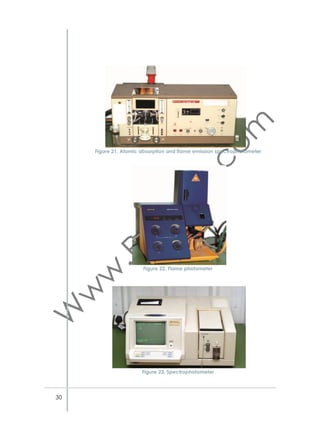
Equipment
• Shimadzu, Atomic Absorption & Flame Emission Spectrophotometer AA–630–12, Japan (AAS). Determine minerals as shown in table
1. Allow the device to warm up for 10 min with flame and source
lamp lit (Fig. 21).
• Spectrophotometer, Hitachi U 2000, Tokyo, Japan. The device is
equipped with automatic sampler unit and 1 cm cuvette holder
unit. Determine P at 400 nm. Allow the device to warm up for 10
min with source lit (Fig. 23).
• Flame photometer, Gallenkamp, UK. The device is equipped with
filters to determine Na, K and Li (Fig. 22).
References
• AOAC. 2000.
29](https://image.slidesharecdn.com/animalnutritionlabmanual2-140205071028-phpapp02/85/Animal-Nutrition-Lab-Manual-2-38-320.jpg)


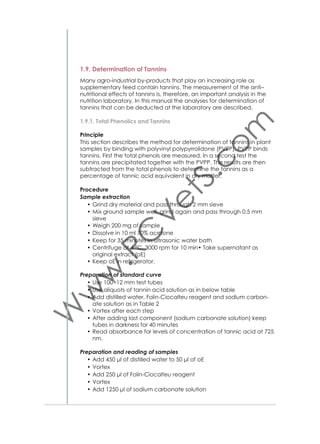
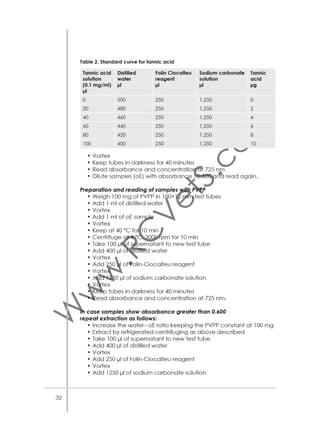
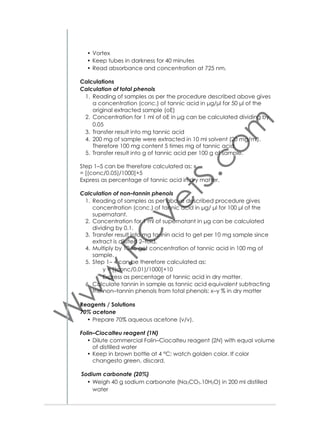
![• Vortex
• Keep tubes in darkness for 40 minutes
• Read absorbance and concentration at 725 nm.
Calculations
Calculation of total phenols
1. Reading of samples as per the procedure described above gives
a concentration (conc.) of tannic acid in μg/μl for 50 μl of the original extracted sample (oE)
2. Concentration for 1 ml of oE in μg can be calculated dividing by 0.05
3. Transfer result into mg tannic acid
4. 200 mg of sample were extracted in 10 ml solvent (20 mg/ml).
Therefore 100 mg content 5 times mg of tannic acid
5. Transfer result into g of tannic acid per 100 g of sample.
Step 1–5 can be therefore calculated as:
x = [(conc/0.05)/1000]×5
Express as percentage of tannic acid in dry matter.
Calculation of non–tannin phenols
1. Reading of samples as per above described procedure gives concentration (conc.) of tannic acid in μg/ μl for 100 μl of the supernatant.
2. Concentration for 1 ml of supernatant in μg can be calculated
dividing by 0.1.
3. Transfer result into mg tannin acid to get per 10 mg sample since
extract is diluted 2–fold.
4. Multiply by 10 to get concentration of tannic acid in 100 mg of
sample.
5. Step 1– 4 can be therefore calculated as:
y = [(conc/0.01)/1000]×10
Express as percentage of tannic acid in dry matter.
6. Calculate tannin in sample as tannic acid equivalent subtracting
the non–tannin phenols from total phenols: x–y % in dry matter
Reagents / Solutions
70% acetone
• Prepare 70% aqueous acetone (v/v).
Folin–Ciocalteu reagent (1N)
• Dilute commercial Folin–Ciocalteu reagent (2N) with equal volume
of distilled water
• Keep in brown bottle at 4 °C; watch golden color. If color changes
to green, discard.
Sodium carbonate (20%)
• Weigh 40 g sodium carbonate (Na2CO3.10H2O) in 200 ml distilled
water
33](https://image.slidesharecdn.com/animalnutritionlabmanual2-140205071028-phpapp02/85/Animal-Nutrition-Lab-Manual-2-42-320.jpg)
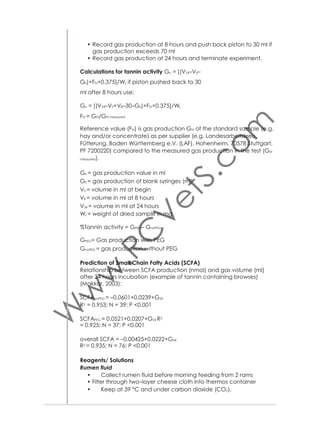
![• Record gas production at 8 hours and push back piston to 30 ml if
gas production exceeds 70 ml
• Record gas production at 24 hours and terminate experiment.
Calculations for tannin activity
Gn = [(V24–V0–G0)×FSt×0.375]/Ws
if piston pushed back to 30 ml after 8 hours use:
Gn = [(V24–V0+V8–30–G0)×FSt×0.375]/Ws
FSt = GSt/GSt measured
Reference value (FSt) is gas production GSt of the standard sample (e.g. hay
and/or concentrate) as per supplier (e.g. Landesarbeitskreis. Fütterung,
Baden Württemberg e.V. (LAF), Hohenheim, 70578 Stuttgart, PF 7200220)
compared to the measured gas production in the test (GSt measured).
Gn = gas production value in ml
G0 = gas production of blank syringes (ml)
V0 = volume in ml at begin
V8 = volume in ml at 8 hours
V24 = volume in ml at 24 hours
Ws = weight of dried sample in mg
%Tannin activity = GPEG– GnoPEG
GPEG= Gas production with PEG
GnoPEG = gas production without PEG
Prediction of Small Chain Fatty Acids (SCFA)
Relationship between SCFA production (nmol) and gas volume (ml)
after 24 hours incubation (example of tannin containing browses)
(Makkar, 2003):
SCFAnoPEG = –0.0601+0.0239×G24
R2 = 0.953; N = 39; P <0.001
SCFAPEG = 0.0521+0.0207×G24
R2 = 0.925; N = 37; P <0.001
overall SCFA = –0.00425+0.0222×G24
R2 = 0.935; N = 76; P <0.001
Reagents/ Solutions
Rumen fluid
• Collect rumen fluid before morning feeding from 2 rams
• Filter through two–layer cheese cloth into thermos container
• Keep at 39 °C and under carbon dioxide (CO2).
38](https://image.slidesharecdn.com/animalnutritionlabmanual2-140205071028-phpapp02/85/Animal-Nutrition-Lab-Manual-2-47-320.jpg)

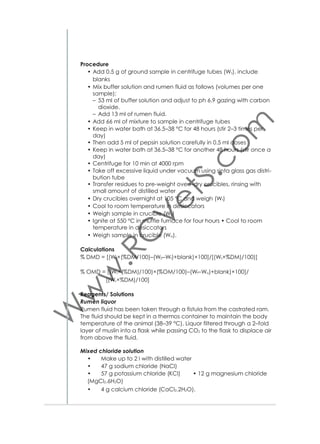
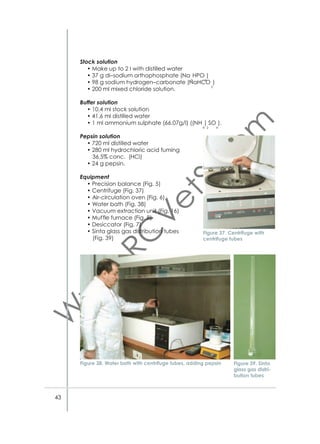
![Procedure
• Add 0.5 g of ground sample in centrifuge tubes (Ws), include
blanks
• Mix buffer solution and rumen fluid as follows (volumes per one
sample):
– 53 ml of buffer solution and adjust to ph 6.9 gazing with carbon
dioxide.
– Add 13 ml of rumen fluid.
• Add 66 ml of mixture to sample in centrifuge tubes
• Keep in water bath at 36.5–38 °C for 48 hours (stir 2–3 times per
day)
• Then add 5 ml of pepsin solution carefully in 0.5 ml doses
• Keep in water bath at 36.5–38 °C for another 48 hours (stir once a
day)
• Centrifuge for 10 min at 4000 rpm
• Take off excessive liquid under vacuum using sinta glass gas distribution tube
• Transfer residues to pre-weight oven–dry crucibles, rinsing with
small amount of distilled water
• Dry crucibles overnight at 105 °C and weigh (Wt)
• Cool to room temperature in desiccators
• Weigh sample in crucible (W0)
• Ignite at 550 °C in muffle furnace for four hours
• Cool to room temperature in desiccators
• Weigh sample in crucible (Wa).
Calculations
% DMD = [(Ws×(%DM/100)–(W0–Wt)+blank)×100]/[(Ws×%DM)/100)]
% OMD = [(Ws×(%DM)/100)×(%OM/100)–(Wt–Wa)+blank)×100]/
[(Ws×%DM)/100]
Reagents/ Solutions
Rumen liquor
Rumen fluid has been taken through a fistula from the castrated ram.
The fluid should be kept in a thermos container to maintain the body
temperature of the animal (38–39 °C). Liquor filtered through a 2–fold
layer of muslin into a flask while passing CO2 to the flask to displace air
from above the fluid.
Mixed chloride solution
• Make up to 2 l with distilled water
• 47 g sodium chloride (NaCl)
• 57 g potassium chloride (KCl)
• 12 g magnesium chloride (MgCl2.6H2O)
• 4 g calcium chloride (CaCl2.2H2O).
42](https://image.slidesharecdn.com/animalnutritionlabmanual2-140205071028-phpapp02/85/Animal-Nutrition-Lab-Manual-2-51-320.jpg)

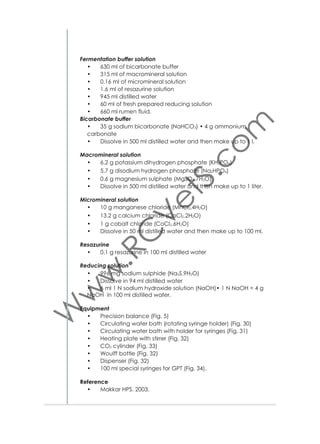
![•
•
•
•
•
0.16 ml of micromineral solution
1.6 ml of resazurine solution
945 ml distilled water
60 ml of fresh prepared reducing solution
660 ml rumen fluid.
Bicarbonate buffer
• 35 g sodium bicarbonate (NaHCO3)
• 4 g ammonium carbonate
• Dissolve in 500 ml distilled water and then make up to 1litre.
Macromineral solution
• 6.2 g potassium dihydrogen phosphate (KH2PO4)
• 5.7 g disodium hydrogen phosphate (Na2HPO4)
• 0.6 g magnesium sulphate (MgSO4.7H2O)
• Dissolve in 500 ml distilled water and then make up to 1 l.
Micromineral solution
• 10 g manganese chloride (MnCl2.4H2O)
• 13.2 g calcium chloride (CaCl2.2H2O)
• 1 g cobalt chloride (CoCl2.6H2O)
• Dissolve in 50 ml distilled water and then make up to 100 ml.
Resazurine
• 0.1 g resazurine in 100 ml distilled water.
Reducing solution
• 996 mg sodium sulphide (Na2S.9H2O)
• Dissolve in 94 ml distilled water
• 6 ml 1 N sodium hydroxide solution (NaOH)
• 1 N NaOH = 4 g NaOH in 100 ml distilled water.
Calculations
Calculation for gas production
G24 = [(V24–V0–G0)×FSt×200]/Ws
If pushed back after 8 hours:
G24 = [(V24–V0+V8–G0)×FSt×200]/Ws
G24 = gas production value (ml/200 mg) at 24 hours
G0 = gas production of blank syringes (ml)
V0 = volume in ml at begin
V8 = volume in ml at 8 hours
V24 = volume in ml at 24 hours
Ws = weight of dried sample in mg
FSt = GSt/GSt measured
45](https://image.slidesharecdn.com/animalnutritionlabmanual2-140205071028-phpapp02/85/Animal-Nutrition-Lab-Manual-2-54-320.jpg)
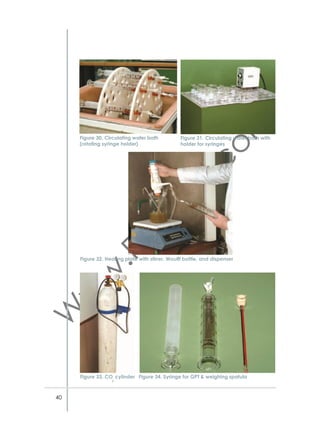
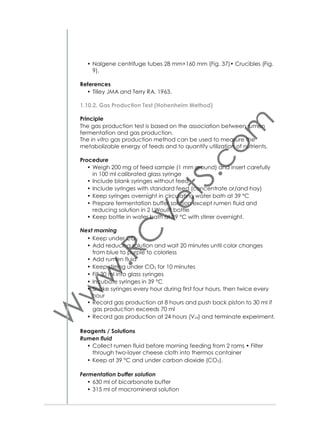
![• Incubation time: 4, 8, 16, 24, 36, 48, 72 and 96 hours
• Insert bags at different time intervals to take them out at the same
time
• Take out bags and put immediately in cold water to stop fermentation
• Wash in washing machine for 20 minutes at 22–25 °C (record revolutions per minutes, rpm)
• Dry bags at 65 °C for 30 hours
• Weigh residues (Wr).
Calculations for dry matter degradability (DMdeg)
Calculate dry matter as under 1.2.1. for feed sample (DMs) and residue
(DMr)
DMdeg = [(DMs–DMr)/DMs ]×100
Procedure for digestibility
• Transfer contents of nylon bag to Berzelius beaker
• Proceed with NDF determination for residue (NDFr) as under 1.6.1.
Calculation of digestibility (D)
D = (NDFr/DMr )×100
Equipment
• Precision balance (Fig. 5)
• Air circulating oven (Fig. 6)
• Muffle furnace (Fig. 8)
• Nylon bags of 9x16 cm made from indigestible material; 40–60
micron mesh size, (Fig. 40)
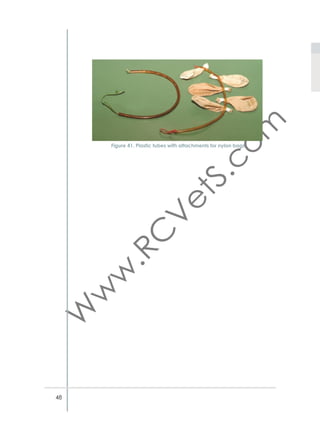
• Plastic tubes with attachments for nylon bags (Fig. 41).
References
• Ørskov ER, Hovell FD DeB and Mould F. 1980.
Figure 40. Nylon bags
47](https://image.slidesharecdn.com/animalnutritionlabmanual2-140205071028-phpapp02/85/Animal-Nutrition-Lab-Manual-2-56-320.jpg)


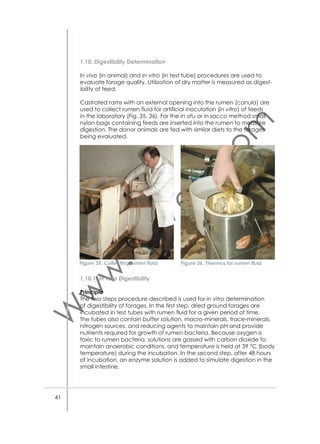
![Calculations
The reading represents the percentage of fat content in milk
Reagents / Solutions
• Sulphuric acid density 1.81
• Amyl alcohol
Equipment
• Water bath (Fig. 44)
• Gerber milk butyrometer (Fig. 46)
• Standard rubber stopper
• Volumetric pipette (H2SO4) with safety bulb, 10 ml (Fig. 47)
• Volumetric pipette (milk), 10.75 ml (Fig. 47)
• Volumetric pipette (Amyl alcohol), 1 ml (Fig. 47)
• Gerber centrifuge (1100±100 rpm, diameter 45–50 cm), (Funke
Gerber, Germany) (Fig. 45).
References
• Marth EH. 1978.
3.4. Total Solids
Principle
Milk is dried under constant temperature in the oven until weight is
stabilized.
Procedure
• Weigh a clean pre-heated crucible
• Add 3–4 g of milk and record weight
• Dry the sample in an air forced oven at 105 °C overnight to stabilize weight
• Weigh the crucible with the dried sample.
Calculations
%TS = [(Weight of dried milk)/(weight of milk)]×100
Equipment
• Air forced oven (Fig. 6)
• Crucibles (Fig. 9)
• Desiccator (Fig. 7)
• Pipette (Fig. 28).
References
• Hui YH 1992.
60](https://image.slidesharecdn.com/animalnutritionlabmanual2-140205071028-phpapp02/85/Animal-Nutrition-Lab-Manual-2-69-320.jpg)


![Phenolphthalein indicator 1%
• Weigh 1g of phenolphthalein in volumetric flask 100 ml
• Dissolve in ethanol and make up to volume.
Calculations
%acidity of milk = [(Va×0.009)/Vm ]×100
where:
Va : volume of 0.1N NaOH
Vm : volume of milk sample
0.009 : conversion factor from milliliter of 0.1N NaOH to gram of lactic acid
Equipment
• Glass burette 50 ml capacity with 0.1 ml graduation (Fig.10)
• Round bottomed white porcelain dish, 100 ml (Fig. 52)
• Pipette 10 ml
• Pipette 1 ml
• Stirrer
• Stirring rods.
References
• AOAC. 2000.
3.10. Volatile Fatty Acids
Principle
Fat samples are esterified and evaporated in the GC system; fatty
acids are separated in a stationary phase of the installed column depending on the chemical characteristics.
Sample preparation
Extraction (Folch et al. 1957)
• 1 ml milk
• 2 ml MeOH
• 1 ml CHCl3
• Vortex 1min
• 1 ml CHCl3
• 1 ml H2O
• Extract the lower part
• Evaporate with N2.
Methylation (Joachim Molkentin, Dietz Precht 2000)
• 100±20 mg of fat
• 5 ml methyl valerate standard (n–heptane, containing 0.4 mg/ml
methyl valerate).
1 ml of this solution was mixed with
• 20 μl sodium methylate solution (2 N in methanol) in a sample vial
65](https://image.slidesharecdn.com/animalnutritionlabmanual2-140205071028-phpapp02/85/Animal-Nutrition-Lab-Manual-2-74-320.jpg)


This document provides a manual for conducting various analyses in an animal nutrition laboratory. It describes procedures for analyzing feed, silage, milk, and blood samples. The manual covers topics such as sample receiving and preparation, determining dry matter, ash, crude protein, fiber, fat, minerals, tannins, digestibility, and assessing silage and milk quality. Various instruments used in the laboratory are also depicted, including ovens, balances, centrifuges, and Kjeldahl nitrogen analyzer. The manual is intended to guide technicians in conducting analyses and to inform scientists on the services provided by the laboratory.


