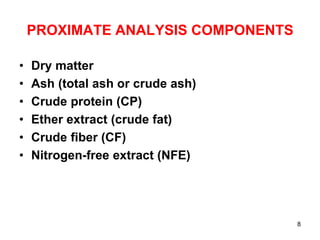
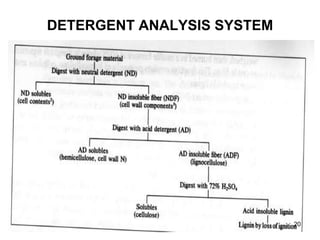
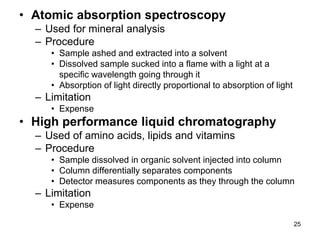
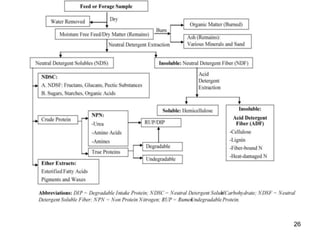
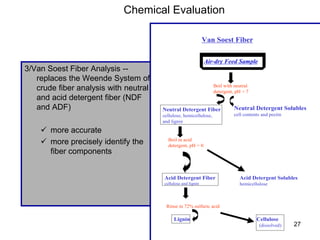
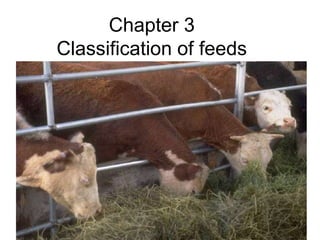
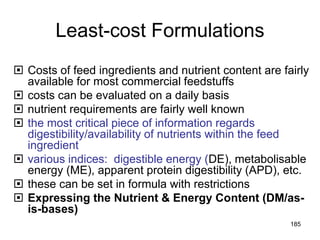
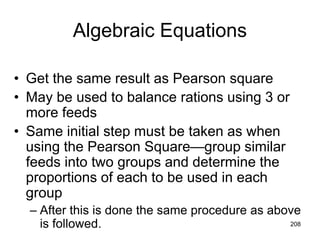
This document provides a summary of a lecture on advances in animal nutrition. It discusses key terminology like nutrients, diet, and malnutrition. It also summarizes different feed analysis systems including the proximate analysis system which analyzes feeds into components like dry matter, crude protein, ether extract, crude fiber, and nitrogen-free extract. The document also discusses the Van Soest detergent analysis system and its components like neutral detergent fiber and acid detergent fiber. Various nutrient analysis techniques are presented including near infrared spectroscopy and atomic absorption spectroscopy. The document concludes with classifications of feeds into roughages and concentrates.

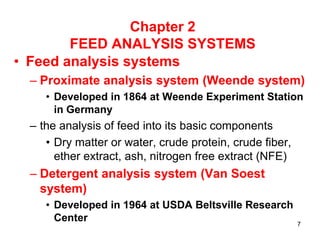

![Expressing the Nutrient & Energy Content
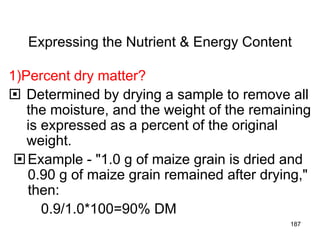
A) Dry matter (DM) basis - The amount contained in only the
DM portion of the feed ingredient/diet, i.e., without water.
[Because feeds contain varying amounts of DM, perhaps,
simpler and more accurate if both the composition and
nutrient requirements are expressed on a DM basis!?]
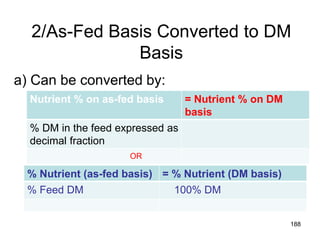
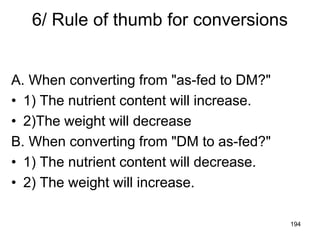
B) As-fed basis - The amount contained in the feed
ingredient/diet as it would be fed to the animal; including
water.
C) Air-dry basis:
1) Usually, assumed to be approximately 90% DM.
2) Most feeds will equilibrate to about 90% DM after a
prolonged, aerobic storage.
3) Air-dry and as-fed basis may be the same for many
common feeds. 186](https://image.slidesharecdn.com/advancesinanimalnutrition1-230330140851-a336d278/85/Nurition-in-ethiopia1-ppt-186-320.jpg)
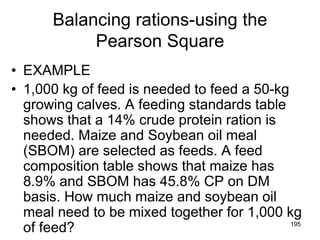
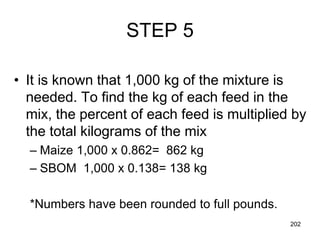
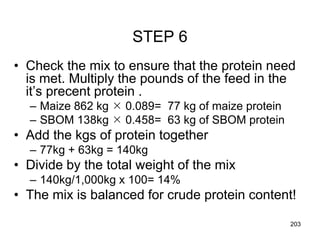
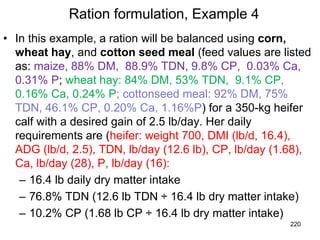
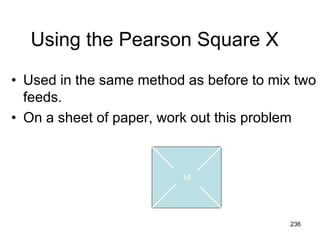
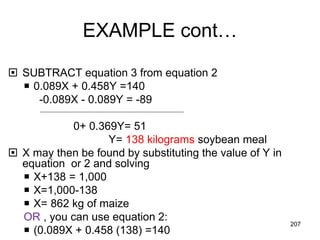
![EXAMPLE
• Same example as the 1st Pearson Square
Example
• Mix of 1,000 kg is to be balanced for protein
using two feeds.
• Place the desired values in equation 2
– REMEMBER TO EXPRESS % AS DECIMALS
• 0.089X+0.458Y=140
– 140 is found by multiplying the quantity of feed
(1,000 kg) by the percent (14) [or the amount] of
nutrient desired: 1,000 x 0.14
205](https://image.slidesharecdn.com/advancesinanimalnutrition1-230330140851-a336d278/85/Nurition-in-ethiopia1-ppt-205-320.jpg)
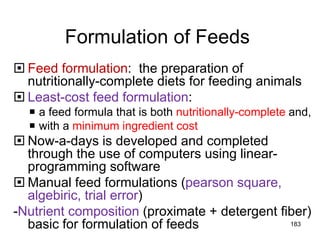
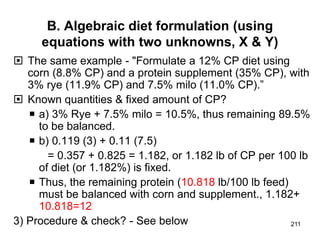
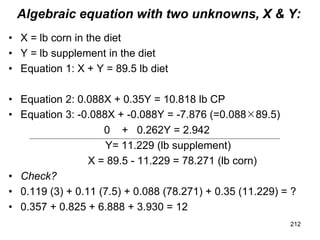
![Algebraic diet formulation (equation
with one unknown, X), Contin….
• 0.357 + 0.825 + 7.876 - 0.088X + 0.35X = 12
0.35X - 0.088X = 12 - 7.876 - 0.825 -0.357
0.262X = 2.942
X = 11.229 [lb supplement]
89.5 - X = 78.271 [lb corn]
• Check?
• 0.119 (3) + 0.11 (7.5) + 0.088 (78.271) + 0.35 (11.229) = ?
• 0.357 + 0.825 + 6.888 + 3.930 = 12
210](https://image.slidesharecdn.com/advancesinanimalnutrition1-230330140851-a336d278/85/Nurition-in-ethiopia1-ppt-210-320.jpg)
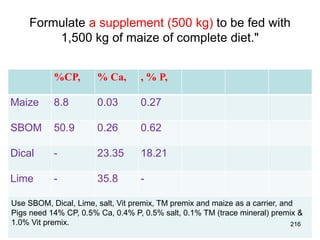
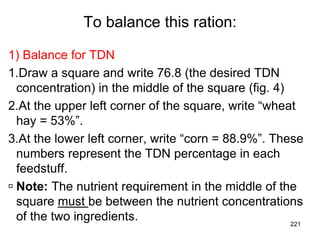
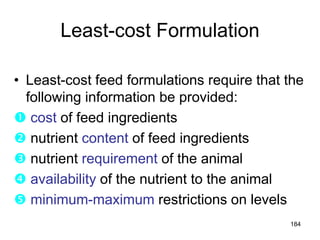
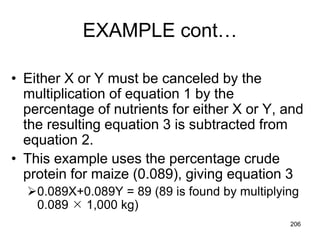
![Determine the "specifications" for the supplement
a) Complete diet is:
– 1500/2000100 = 75% maize
– 500/2000100 = 25% supplement
b) % CP in supplement:
– 0.088 (0.75) + X(25) = 0.14
0.066 + 0.25X = 0.14
0. 25X = 0.074
X = 0.296
[Thus, 0.296 x 100 = 29.6% (% CP in
supplement)]
217](https://image.slidesharecdn.com/advancesinanimalnutrition1-230330140851-a336d278/85/Nurition-in-ethiopia1-ppt-217-320.jpg)
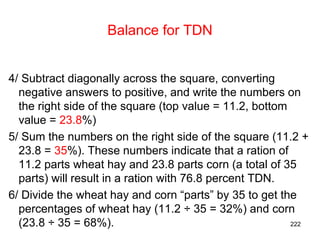
![c) % Ca in supplement:
0.0003 (0.75) + X (0. 25) = 0.005
0.000225 + 0.25X = 0.005
0.25X = 0.4775
X = 0.0191
[Thus, 0.0191 x 100 = 1.91% (% Ca in supplement)]
d/ % P in supplement:
0.0027 (0.75) + X (0.25) = 0.004
0.2025 + 25X = 0.004
0.25X = 0.001975
X = 0.0079
[Thus, 0.0079 X100 = 0.79% (% P in supplement)]
218](https://image.slidesharecdn.com/advancesinanimalnutrition1-230330140851-a336d278/85/Nurition-in-ethiopia1-ppt-218-320.jpg)
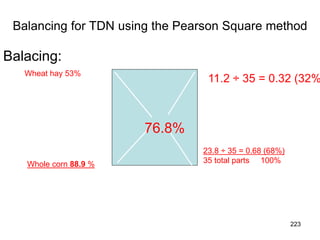
![e) % salt in supplement:
0 (0.75) + X (0.25) = 0.005
X = 0.02
[Thus, 0.02 x 100 = 2% (% salt in supplement)]
f) % TM in supplement:
0 (0.75) + X (0.25) = 0.001
X = 0.004
[Thus, 0.004 x 100 = 0.4% (% TM premix in
supplement)]
219
Supplement specification, %
CP 29.6
Ca 1.9
P 0.8
Salt 2.0
TM premix 0.4
Vit premix 4](https://image.slidesharecdn.com/advancesinanimalnutrition1-230330140851-a336d278/85/Nurition-in-ethiopia1-ppt-219-320.jpg)