Download as PDF, PPTX

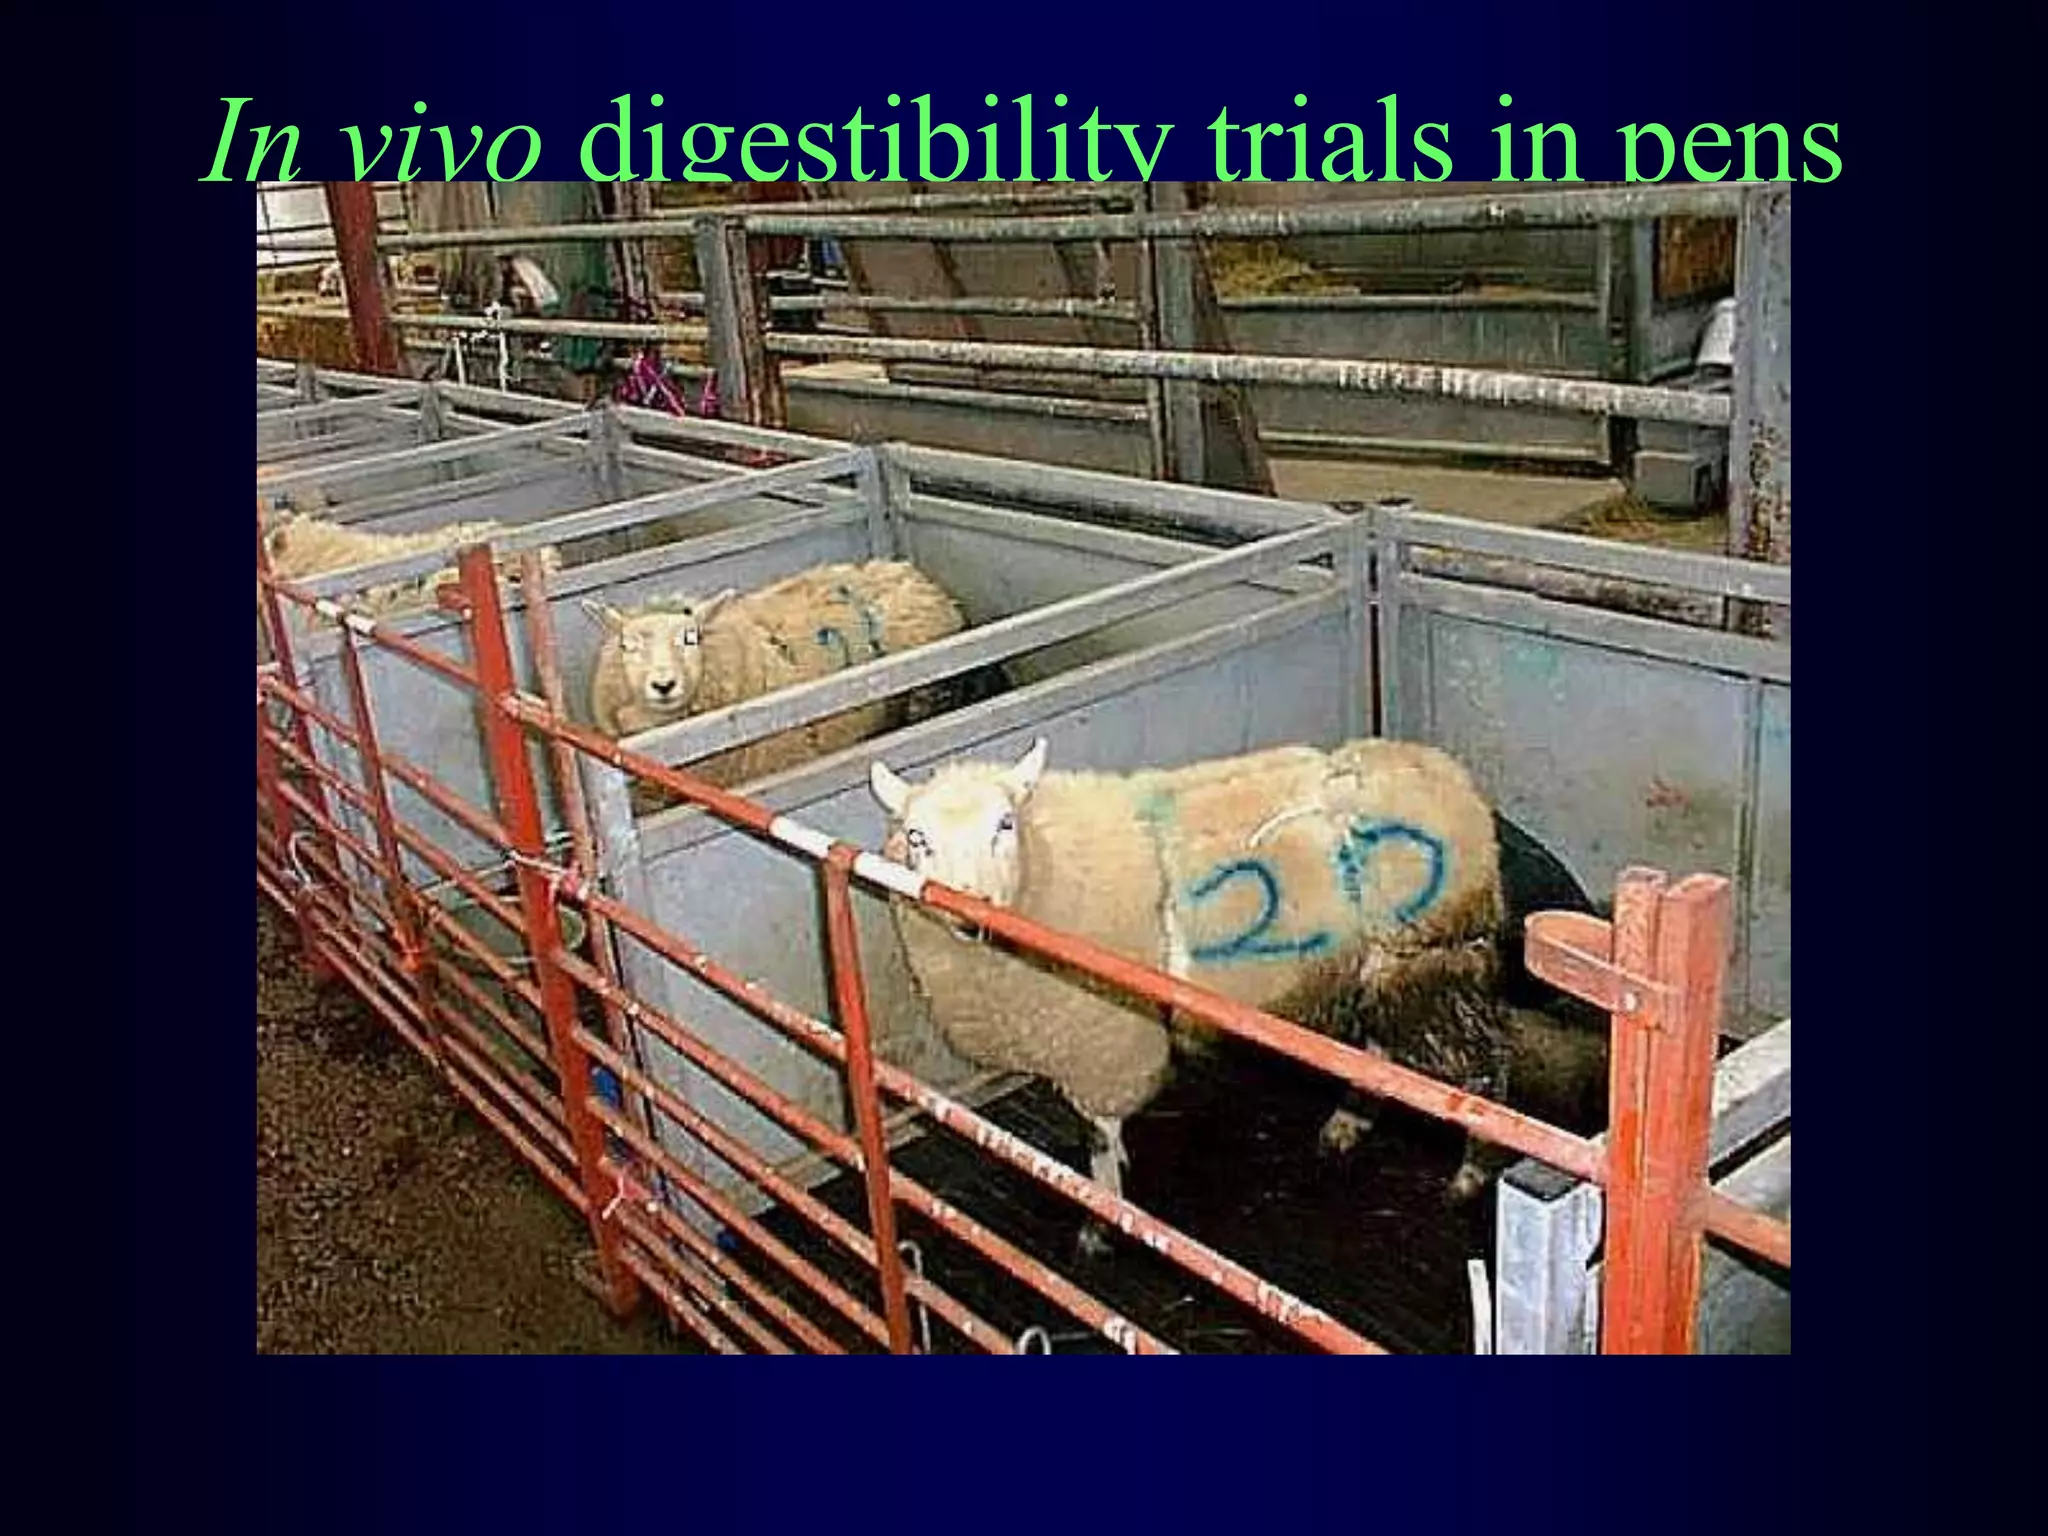
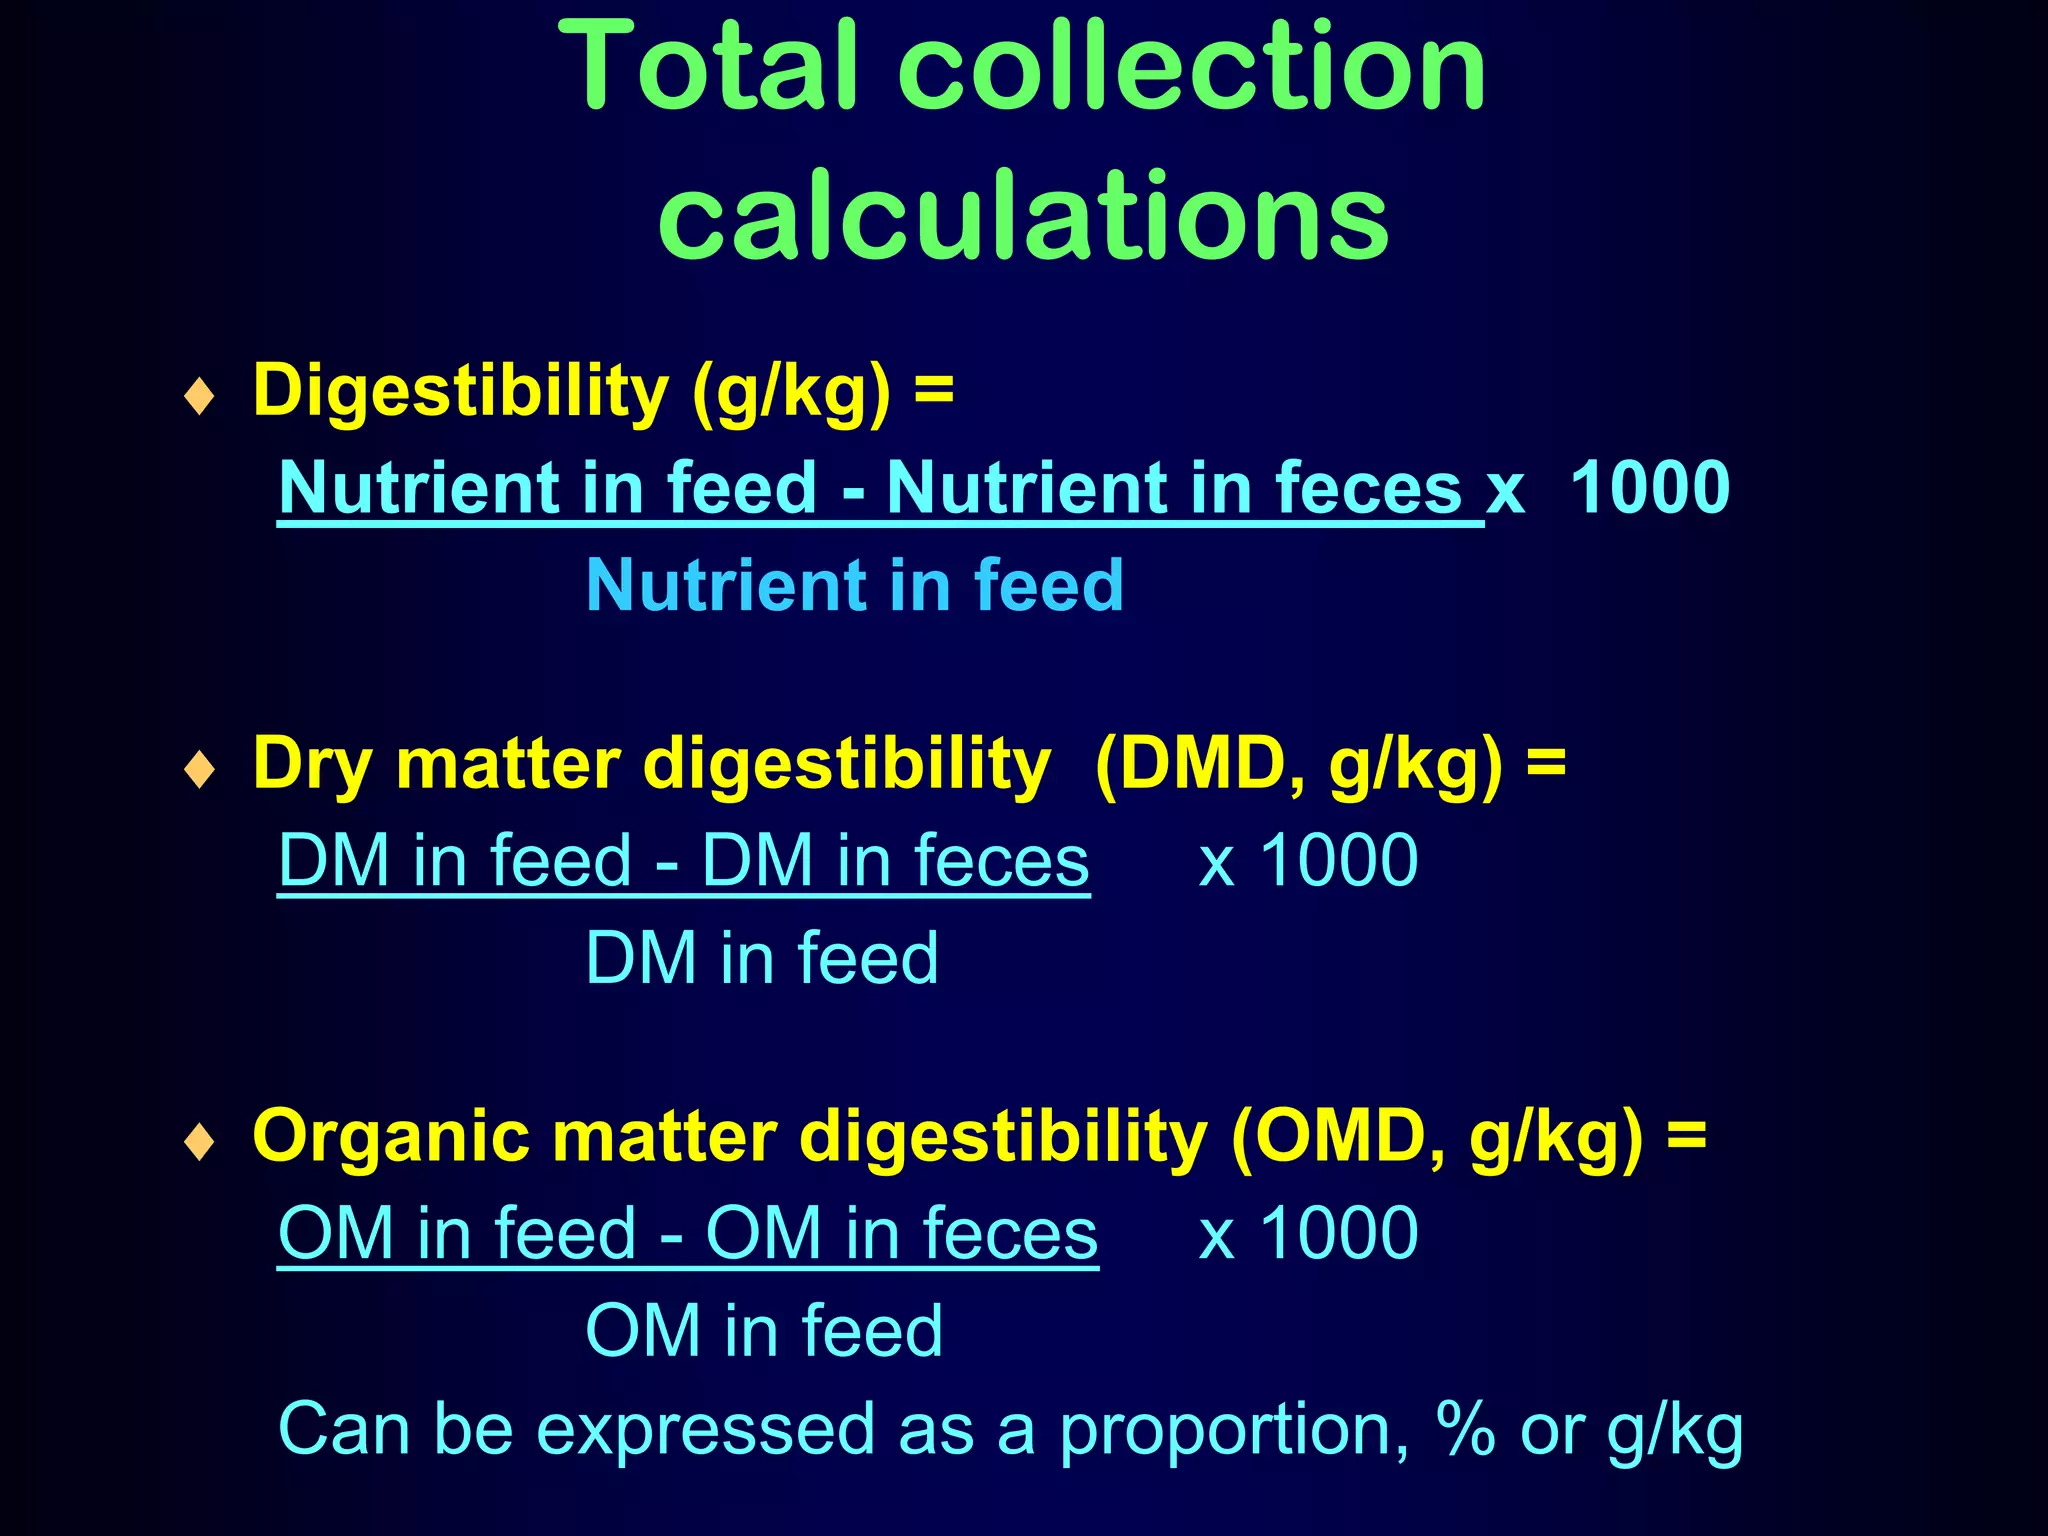
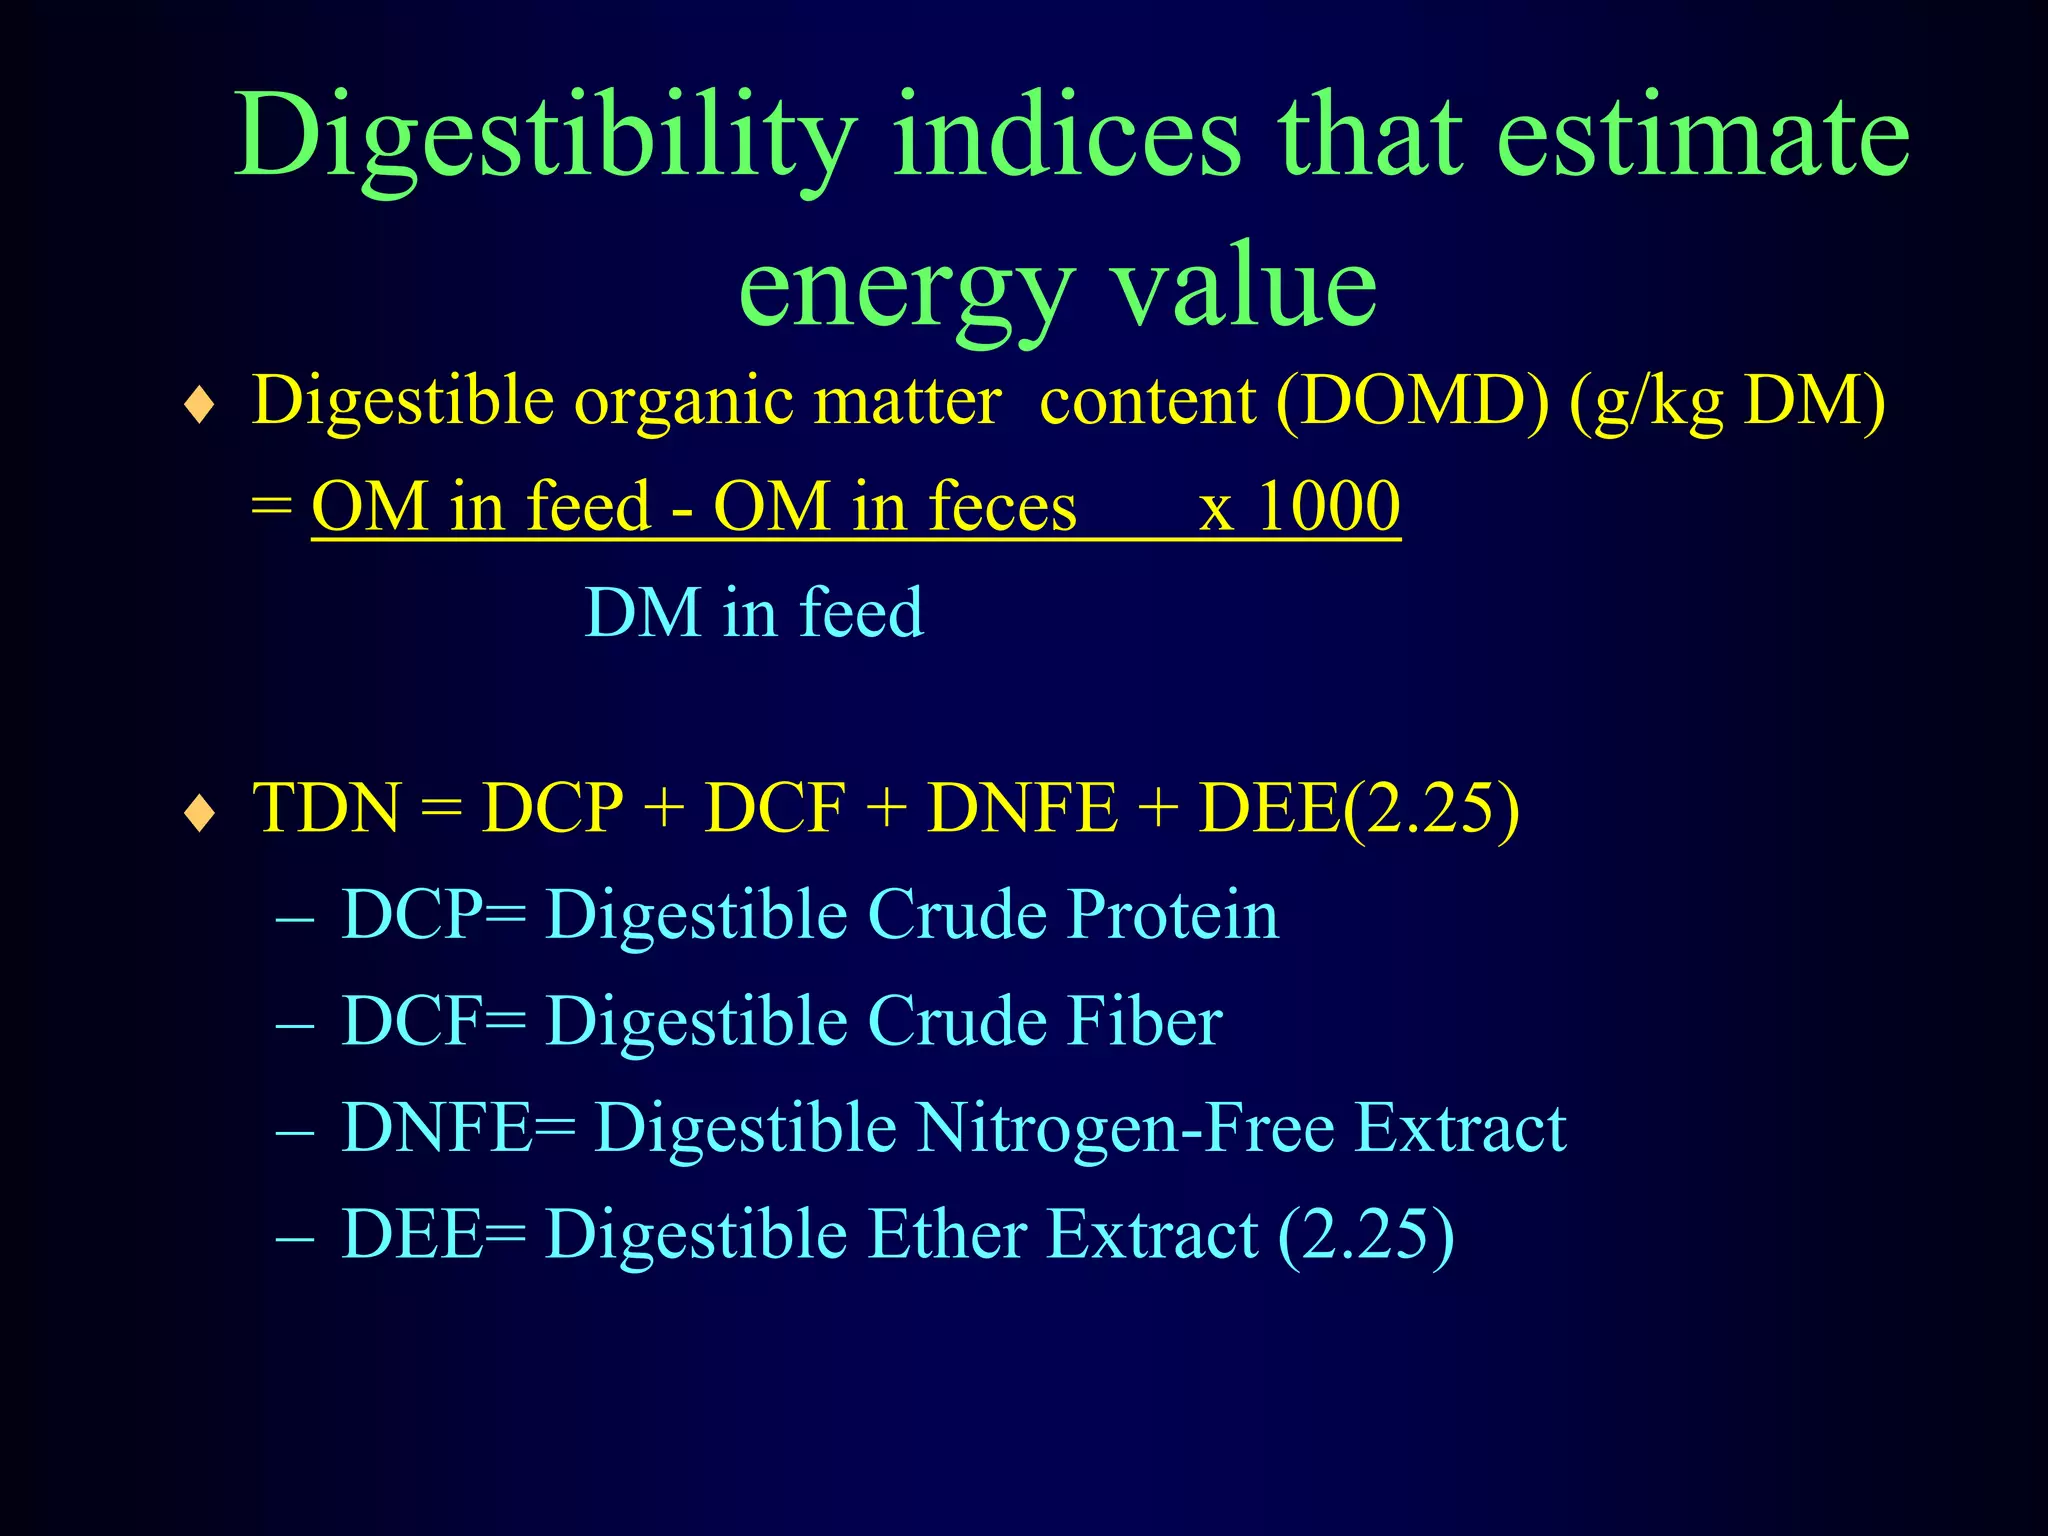
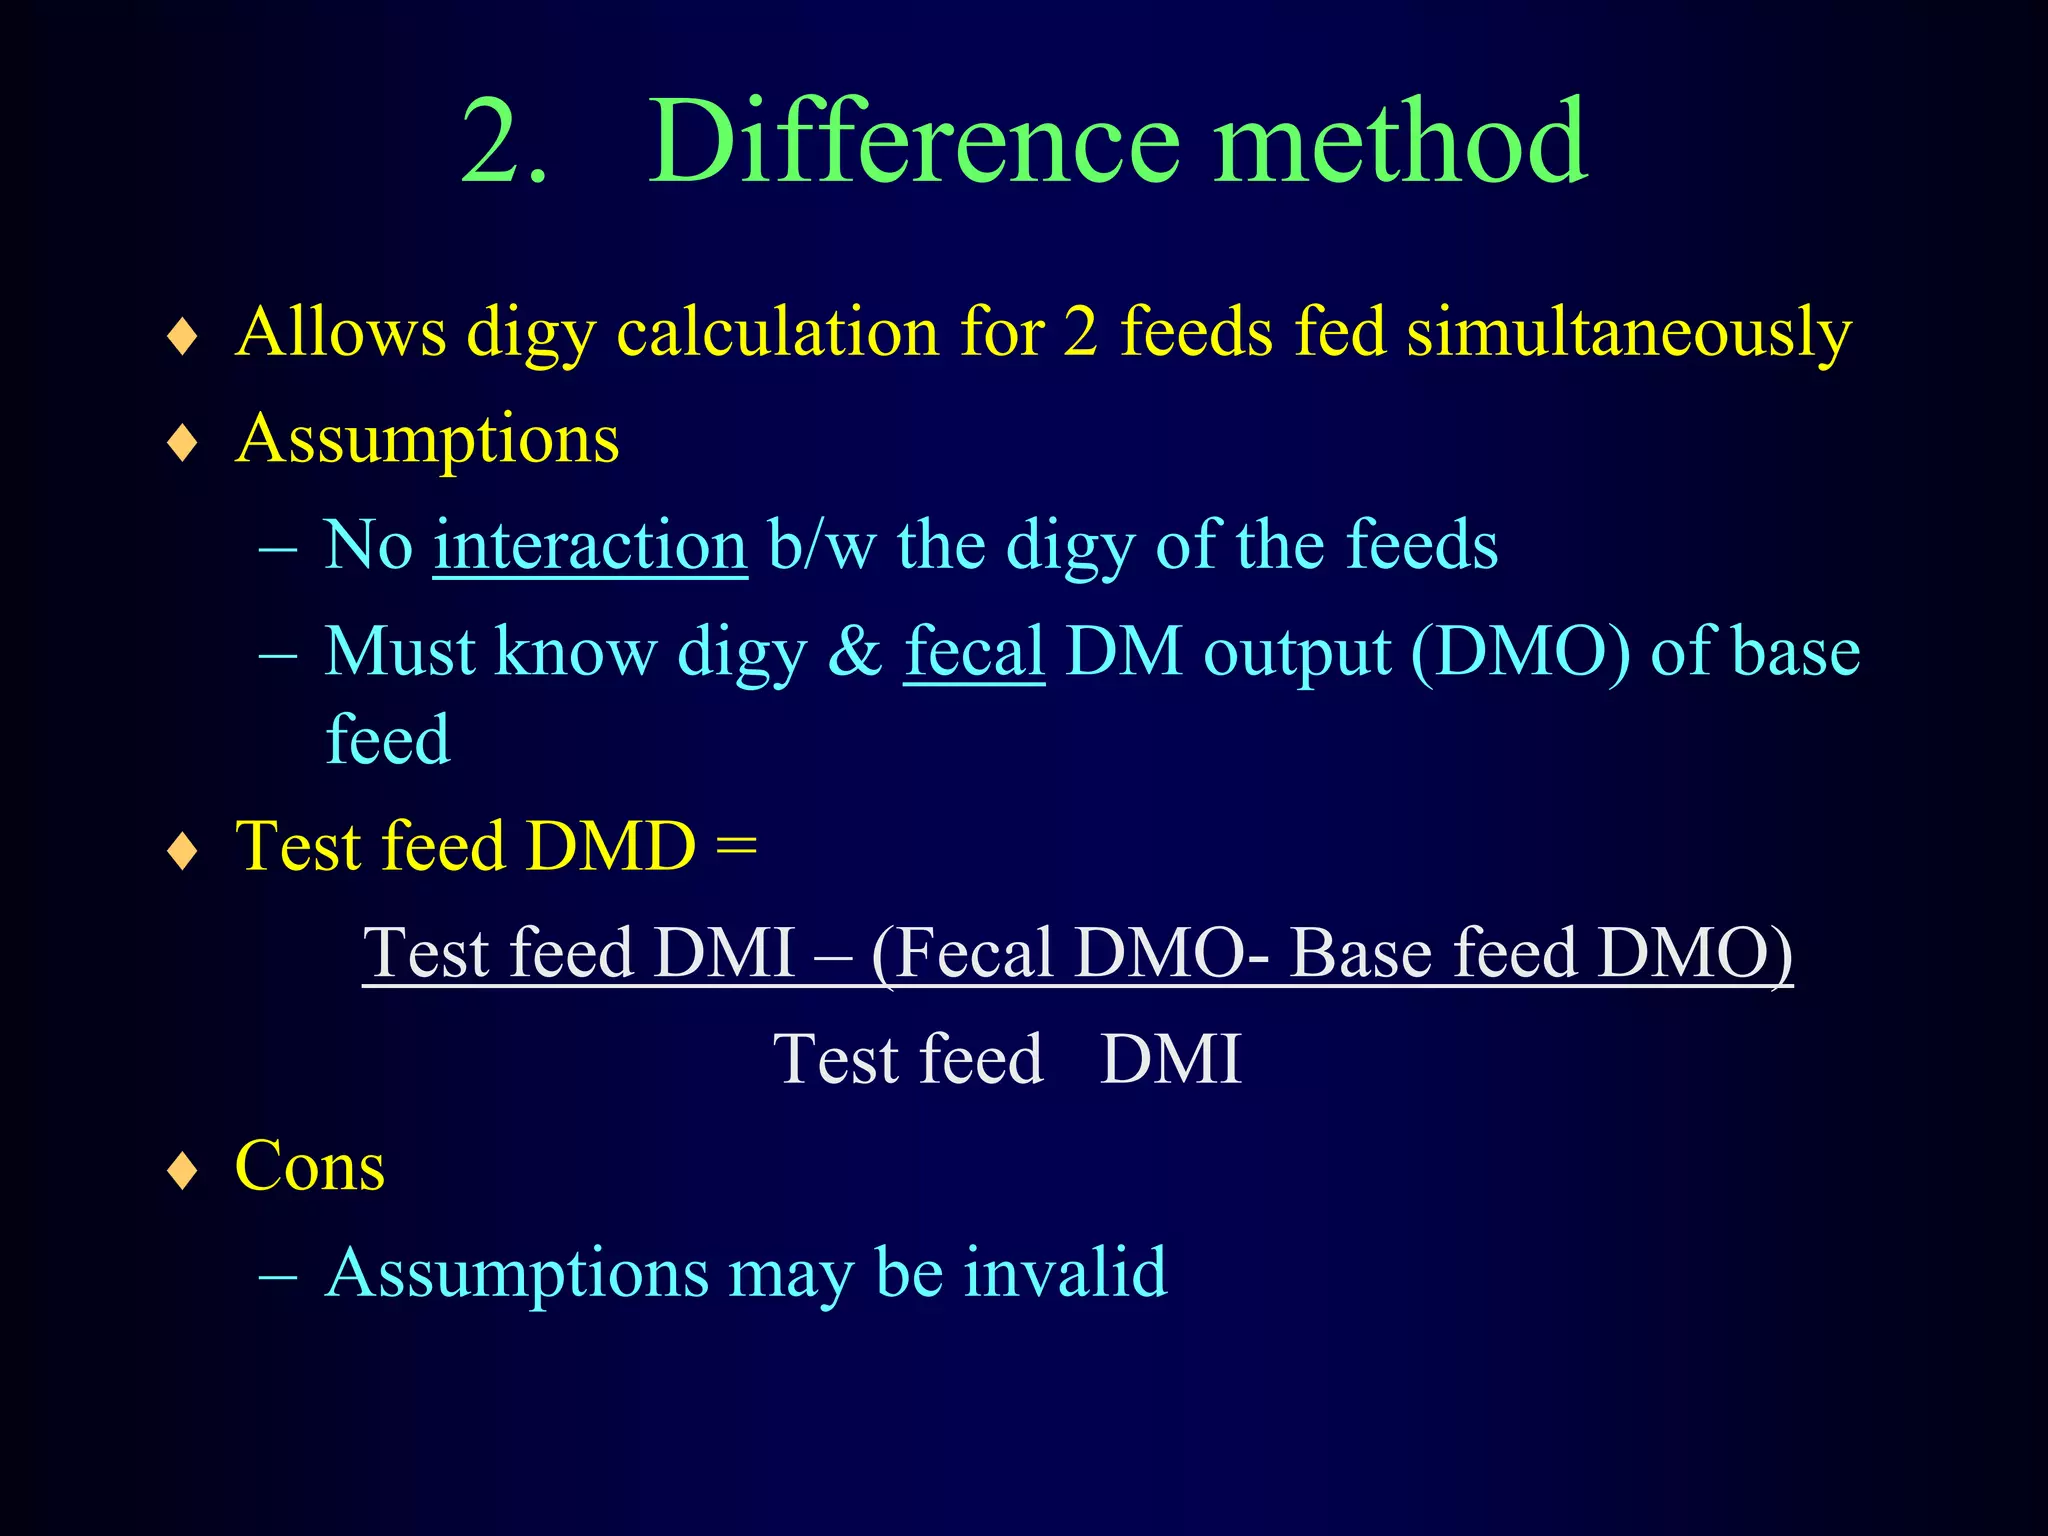
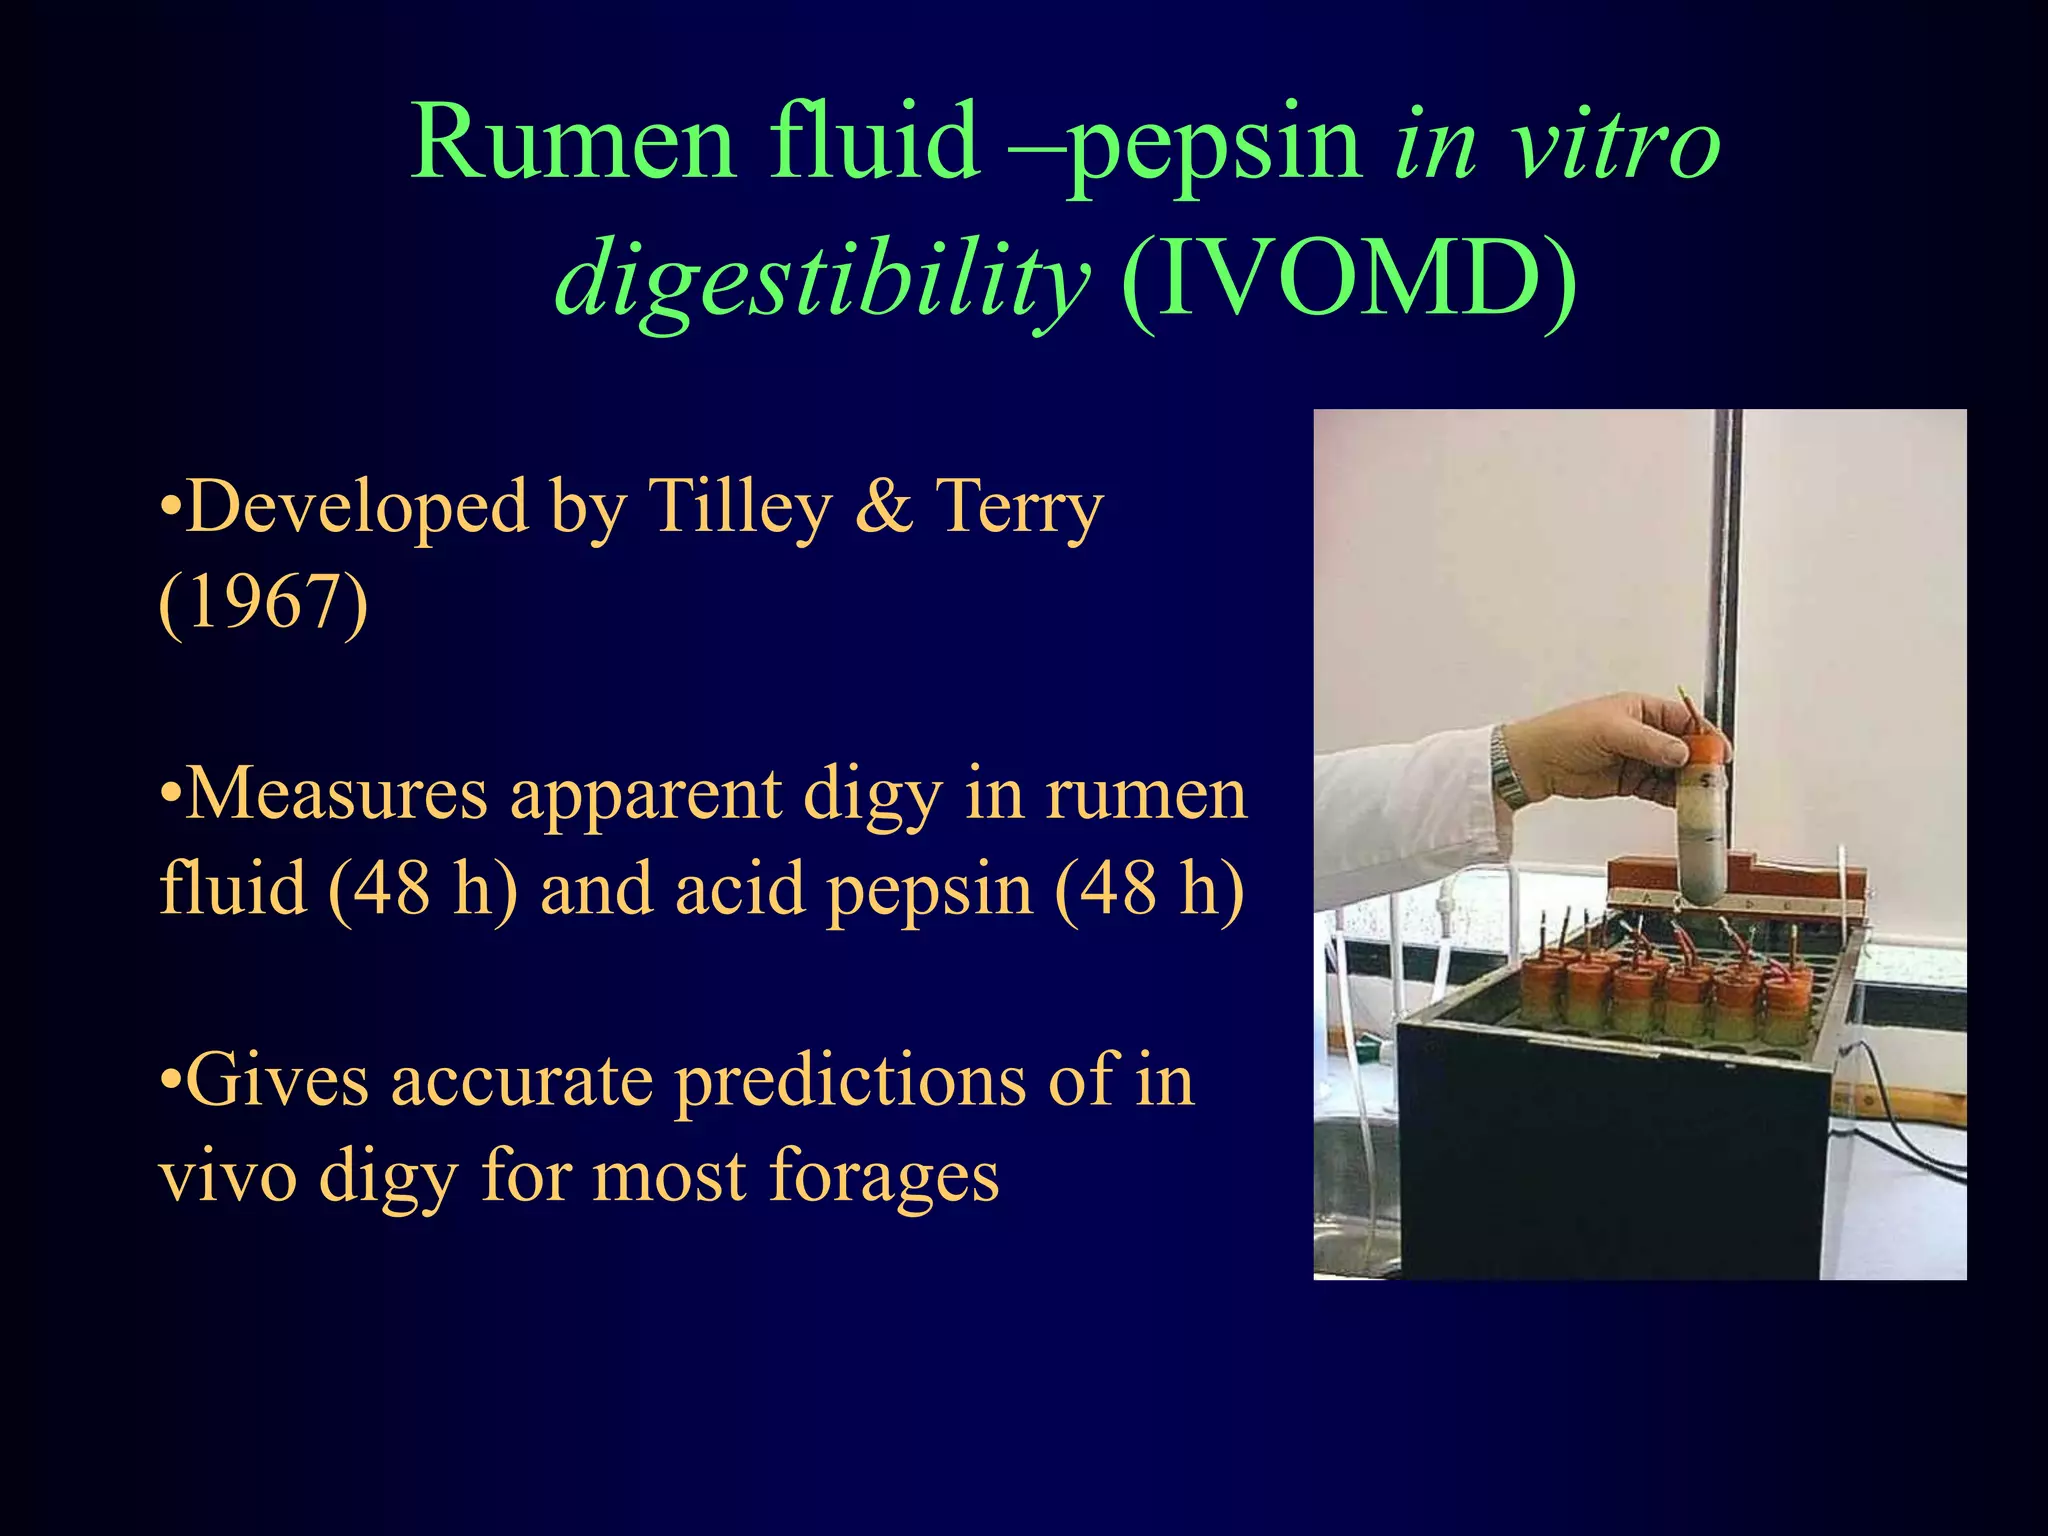
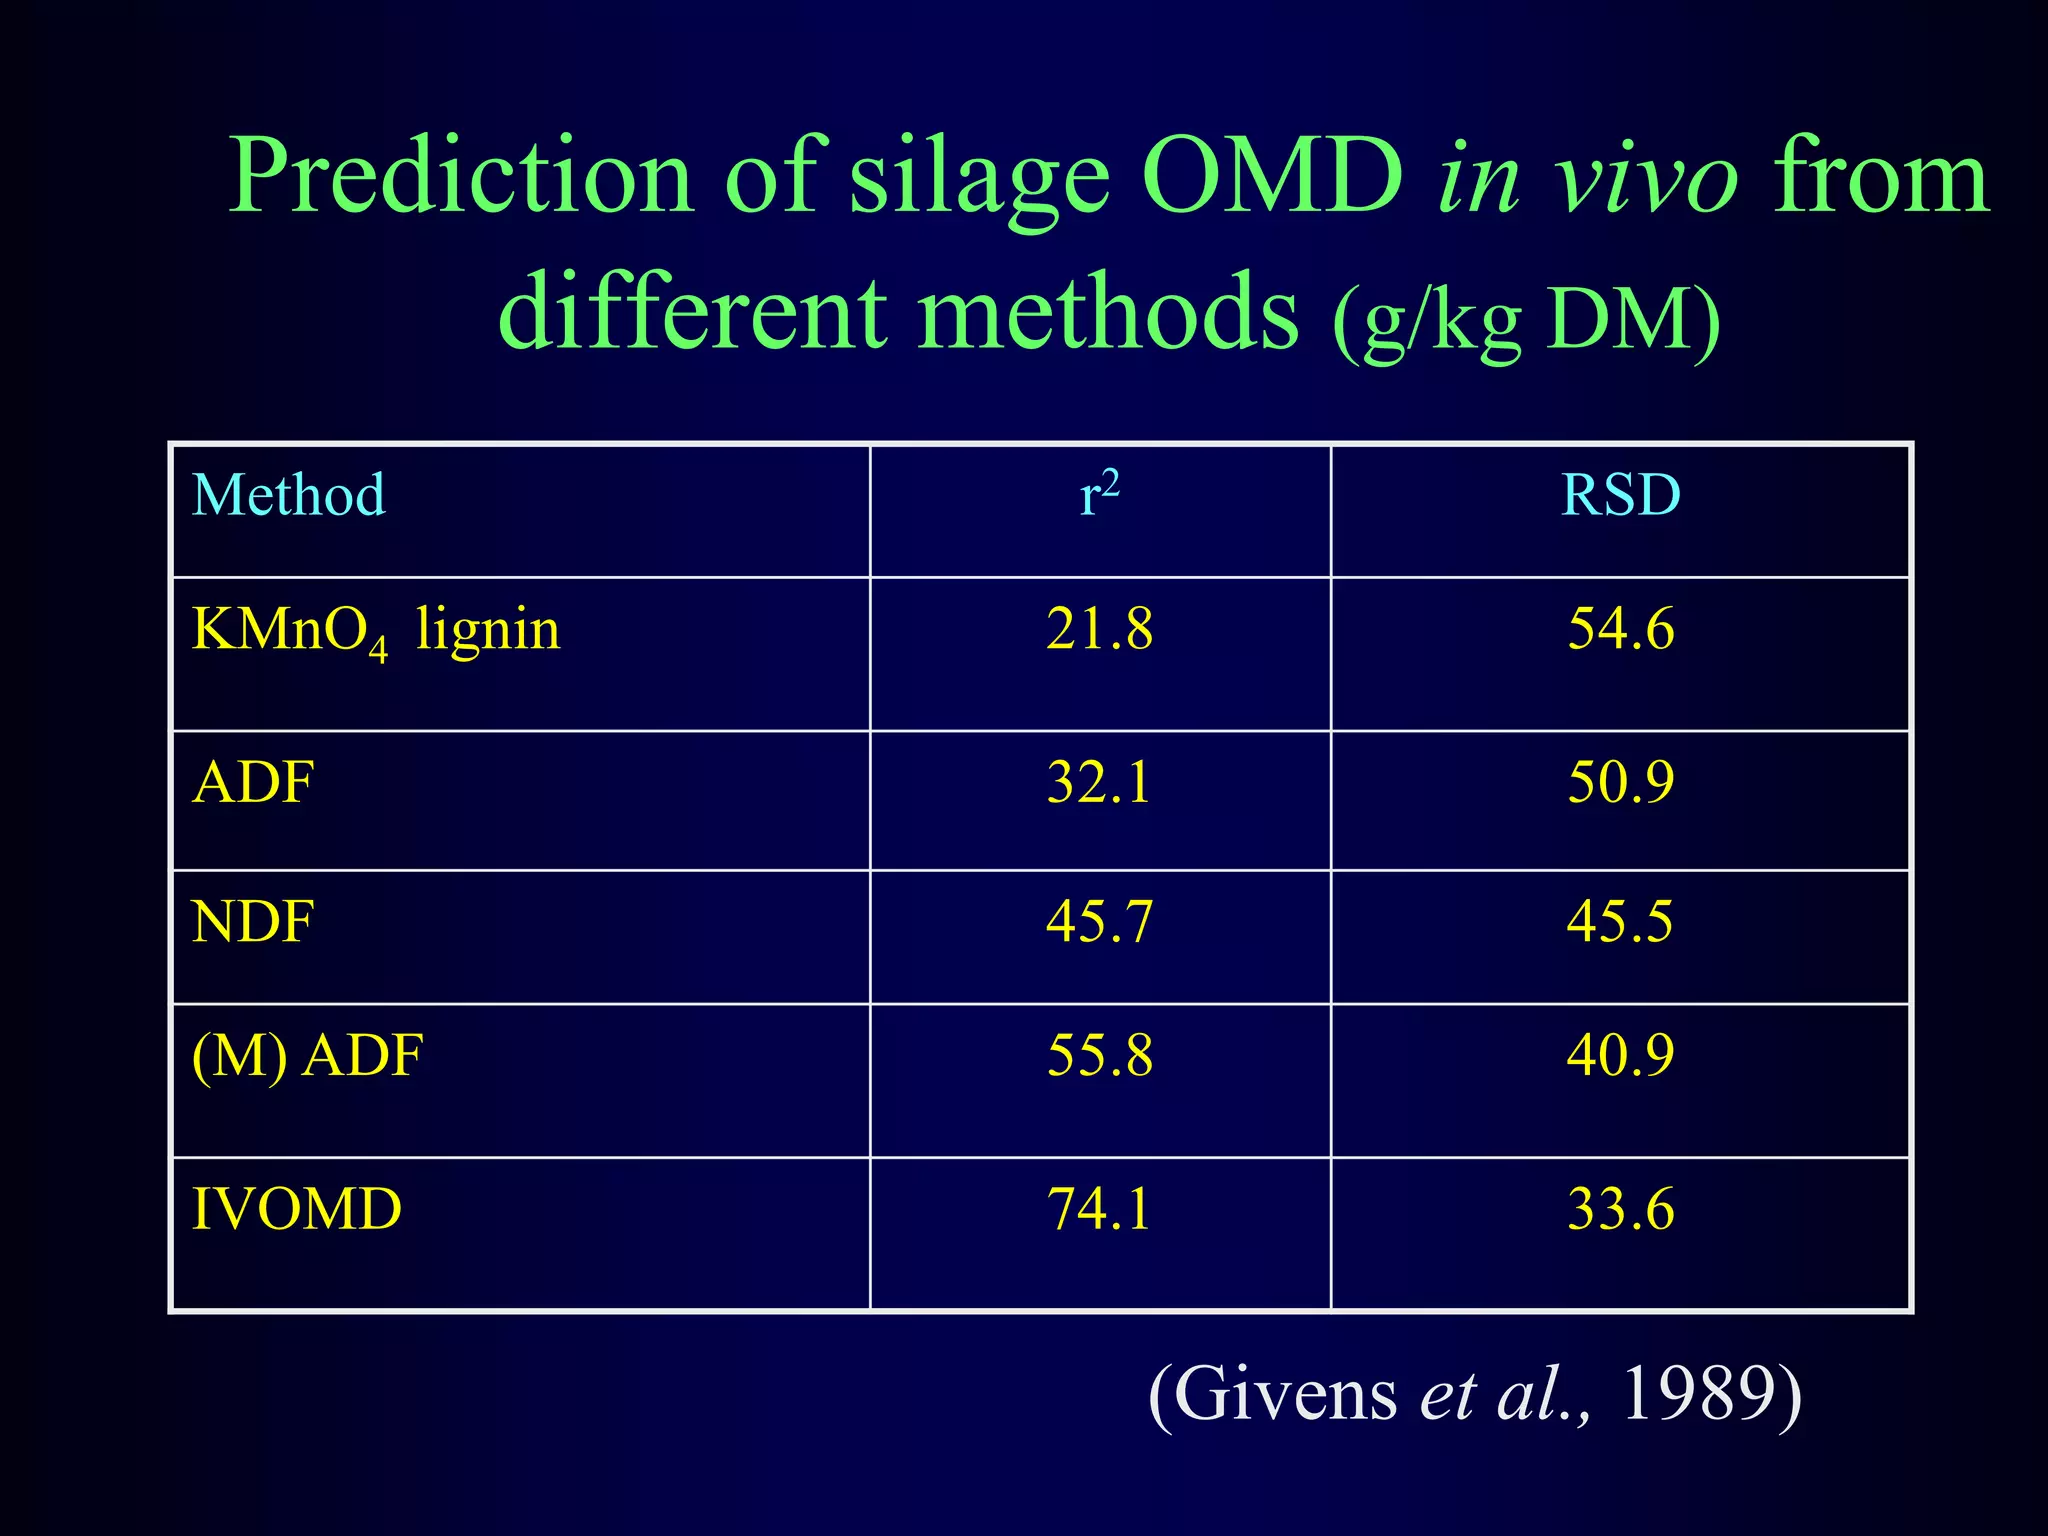
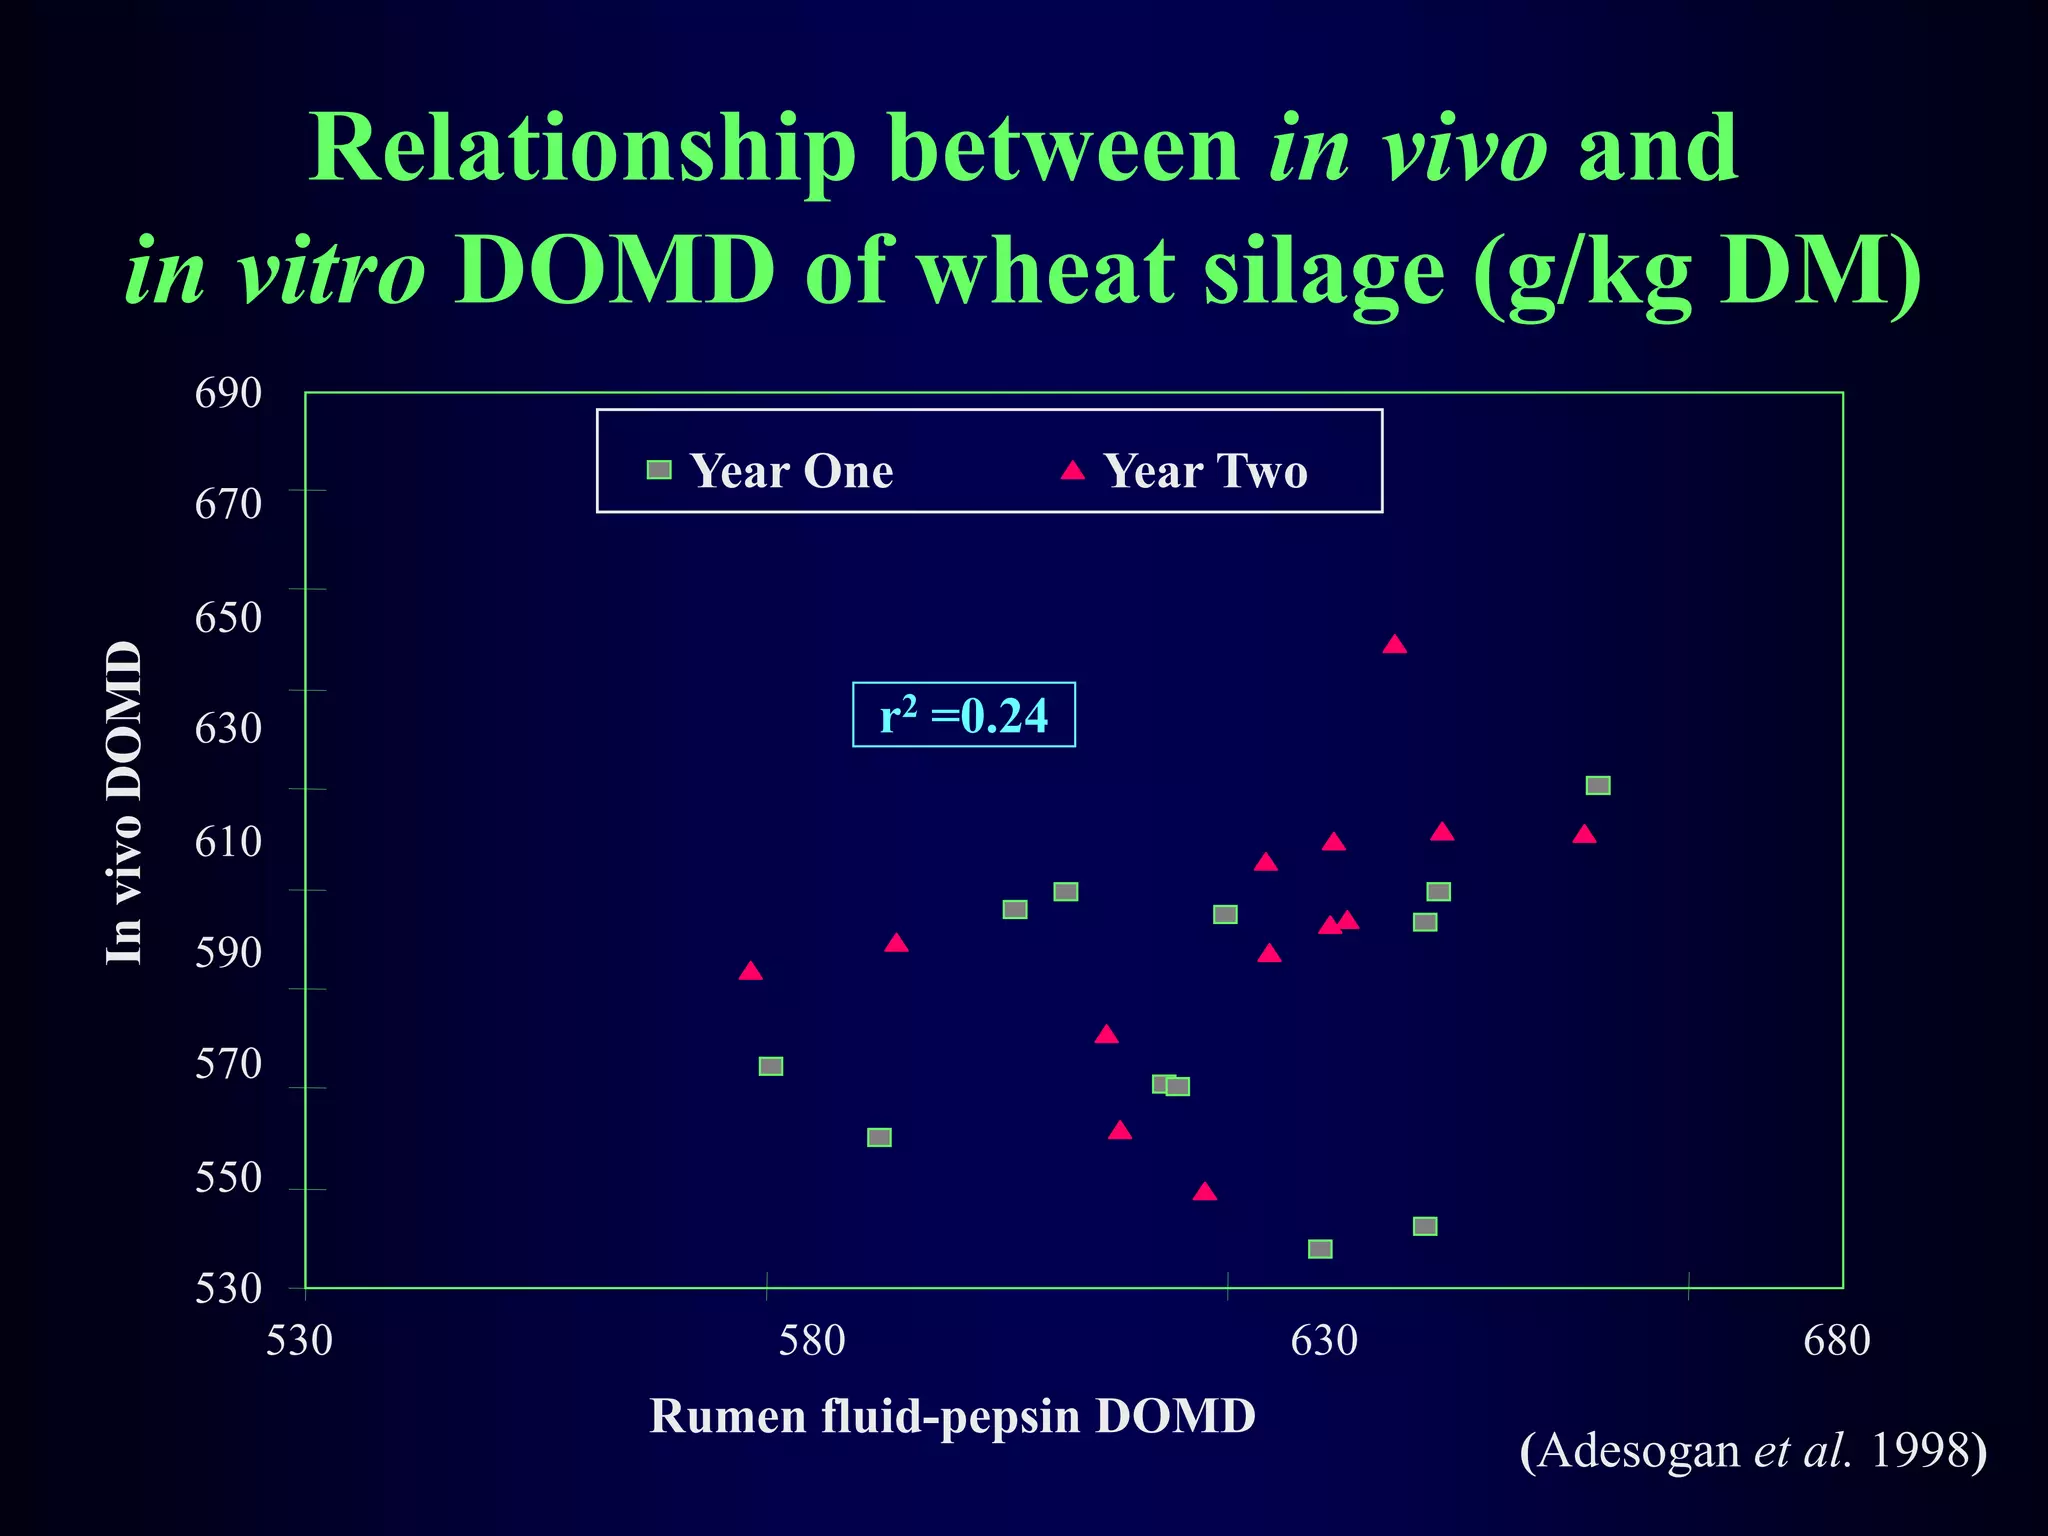
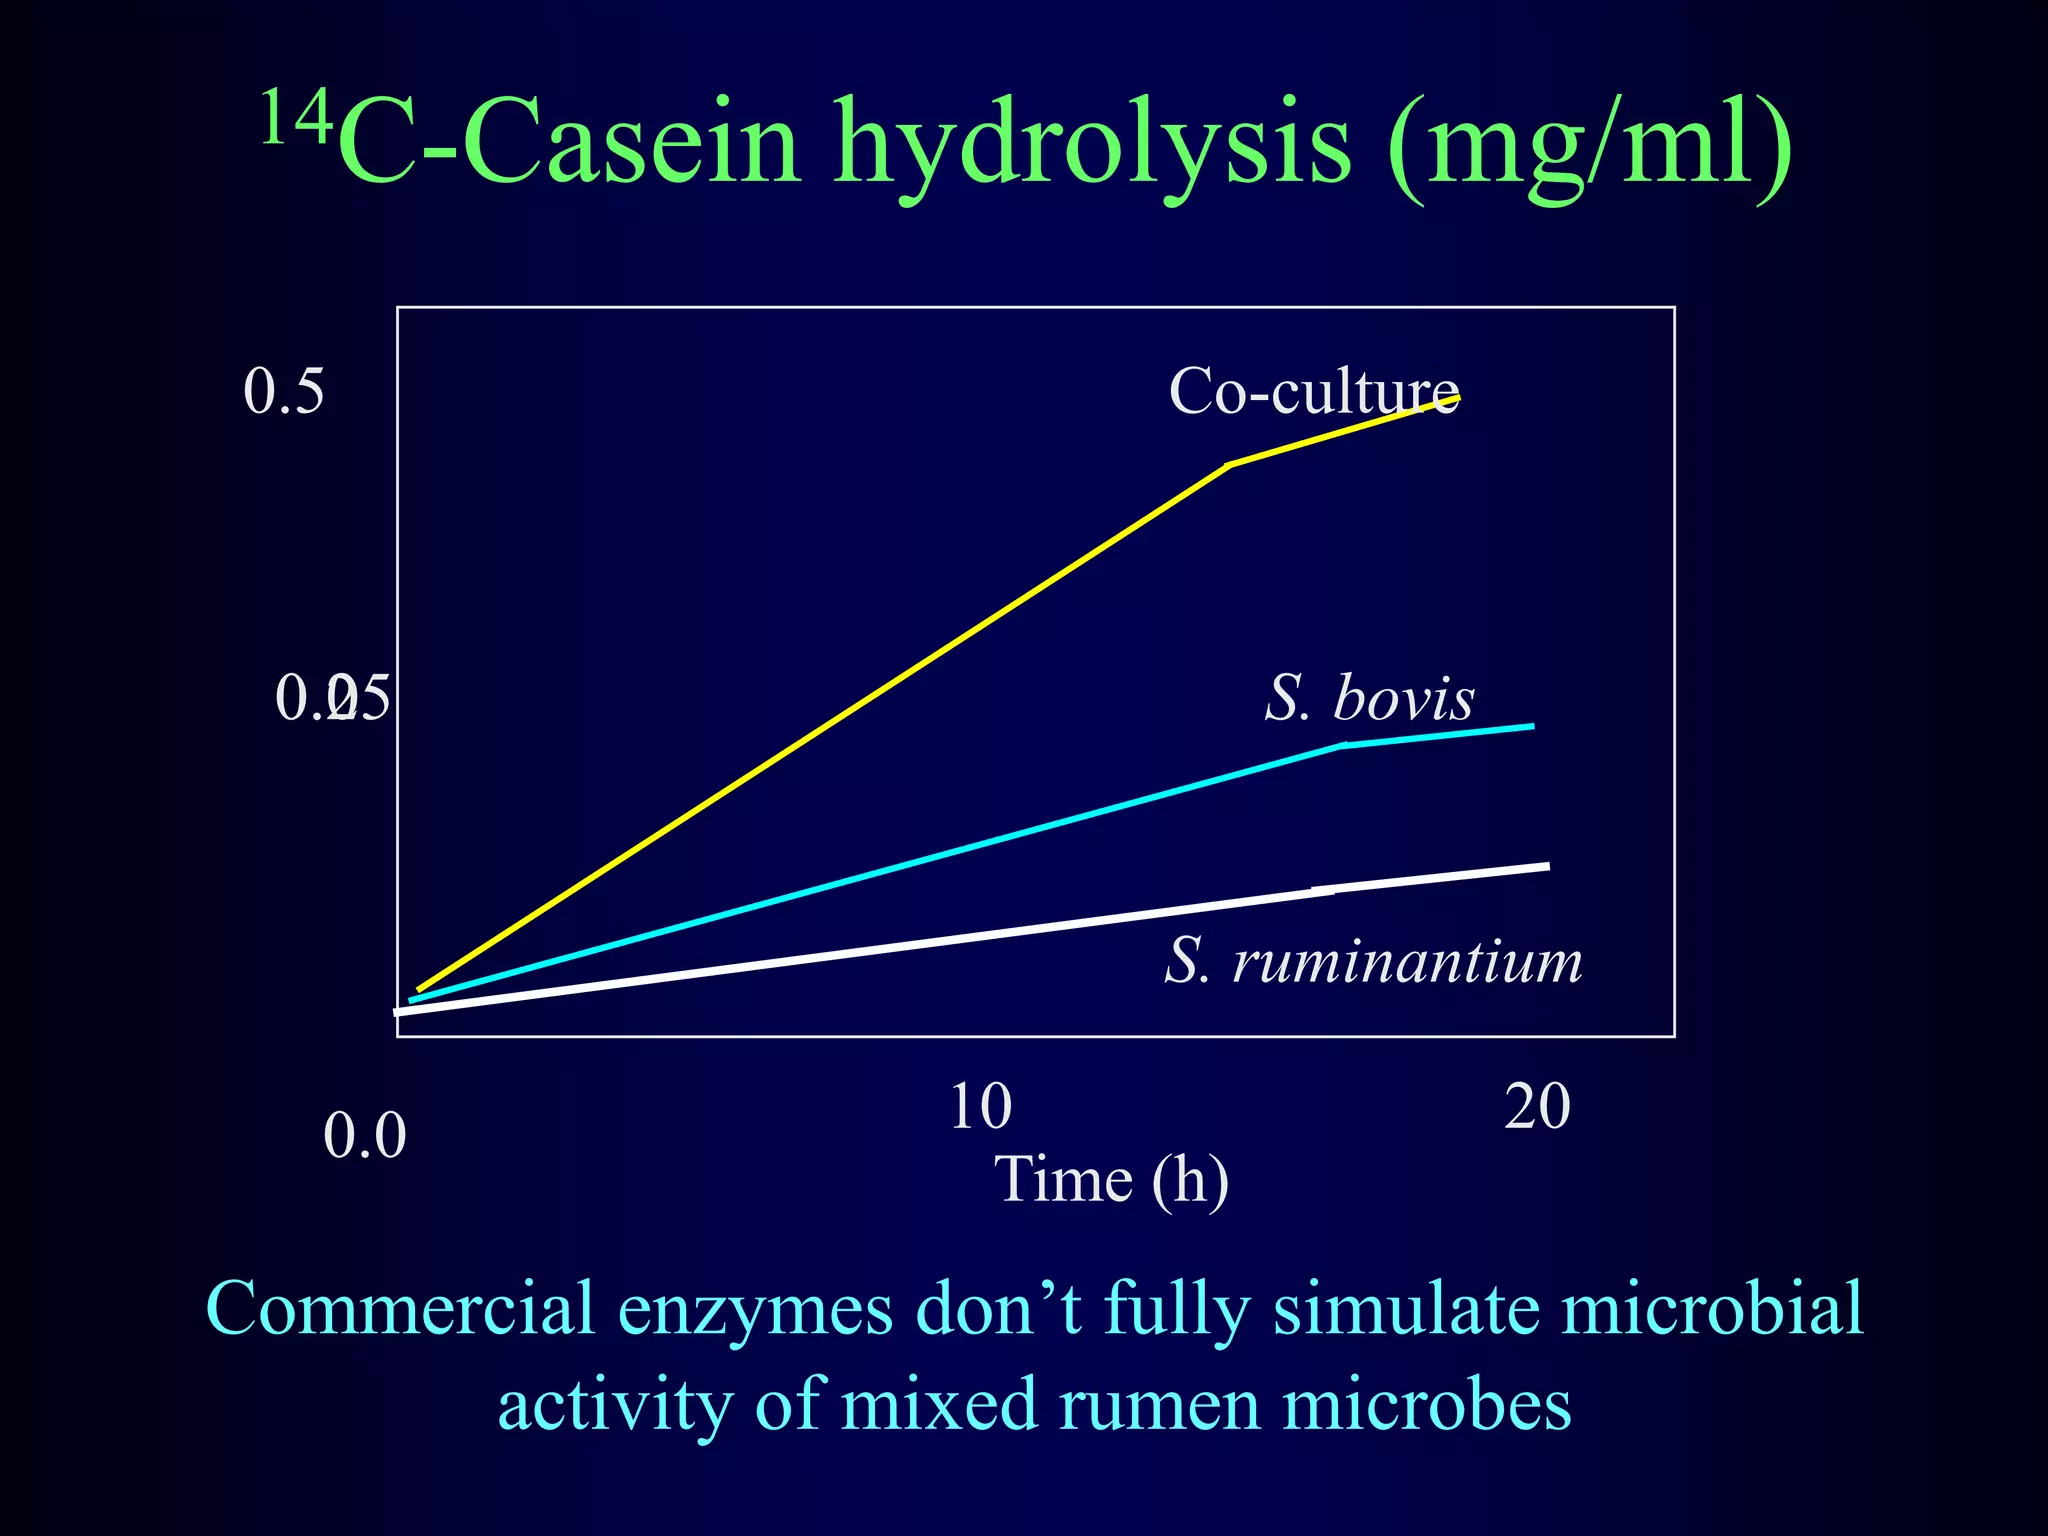
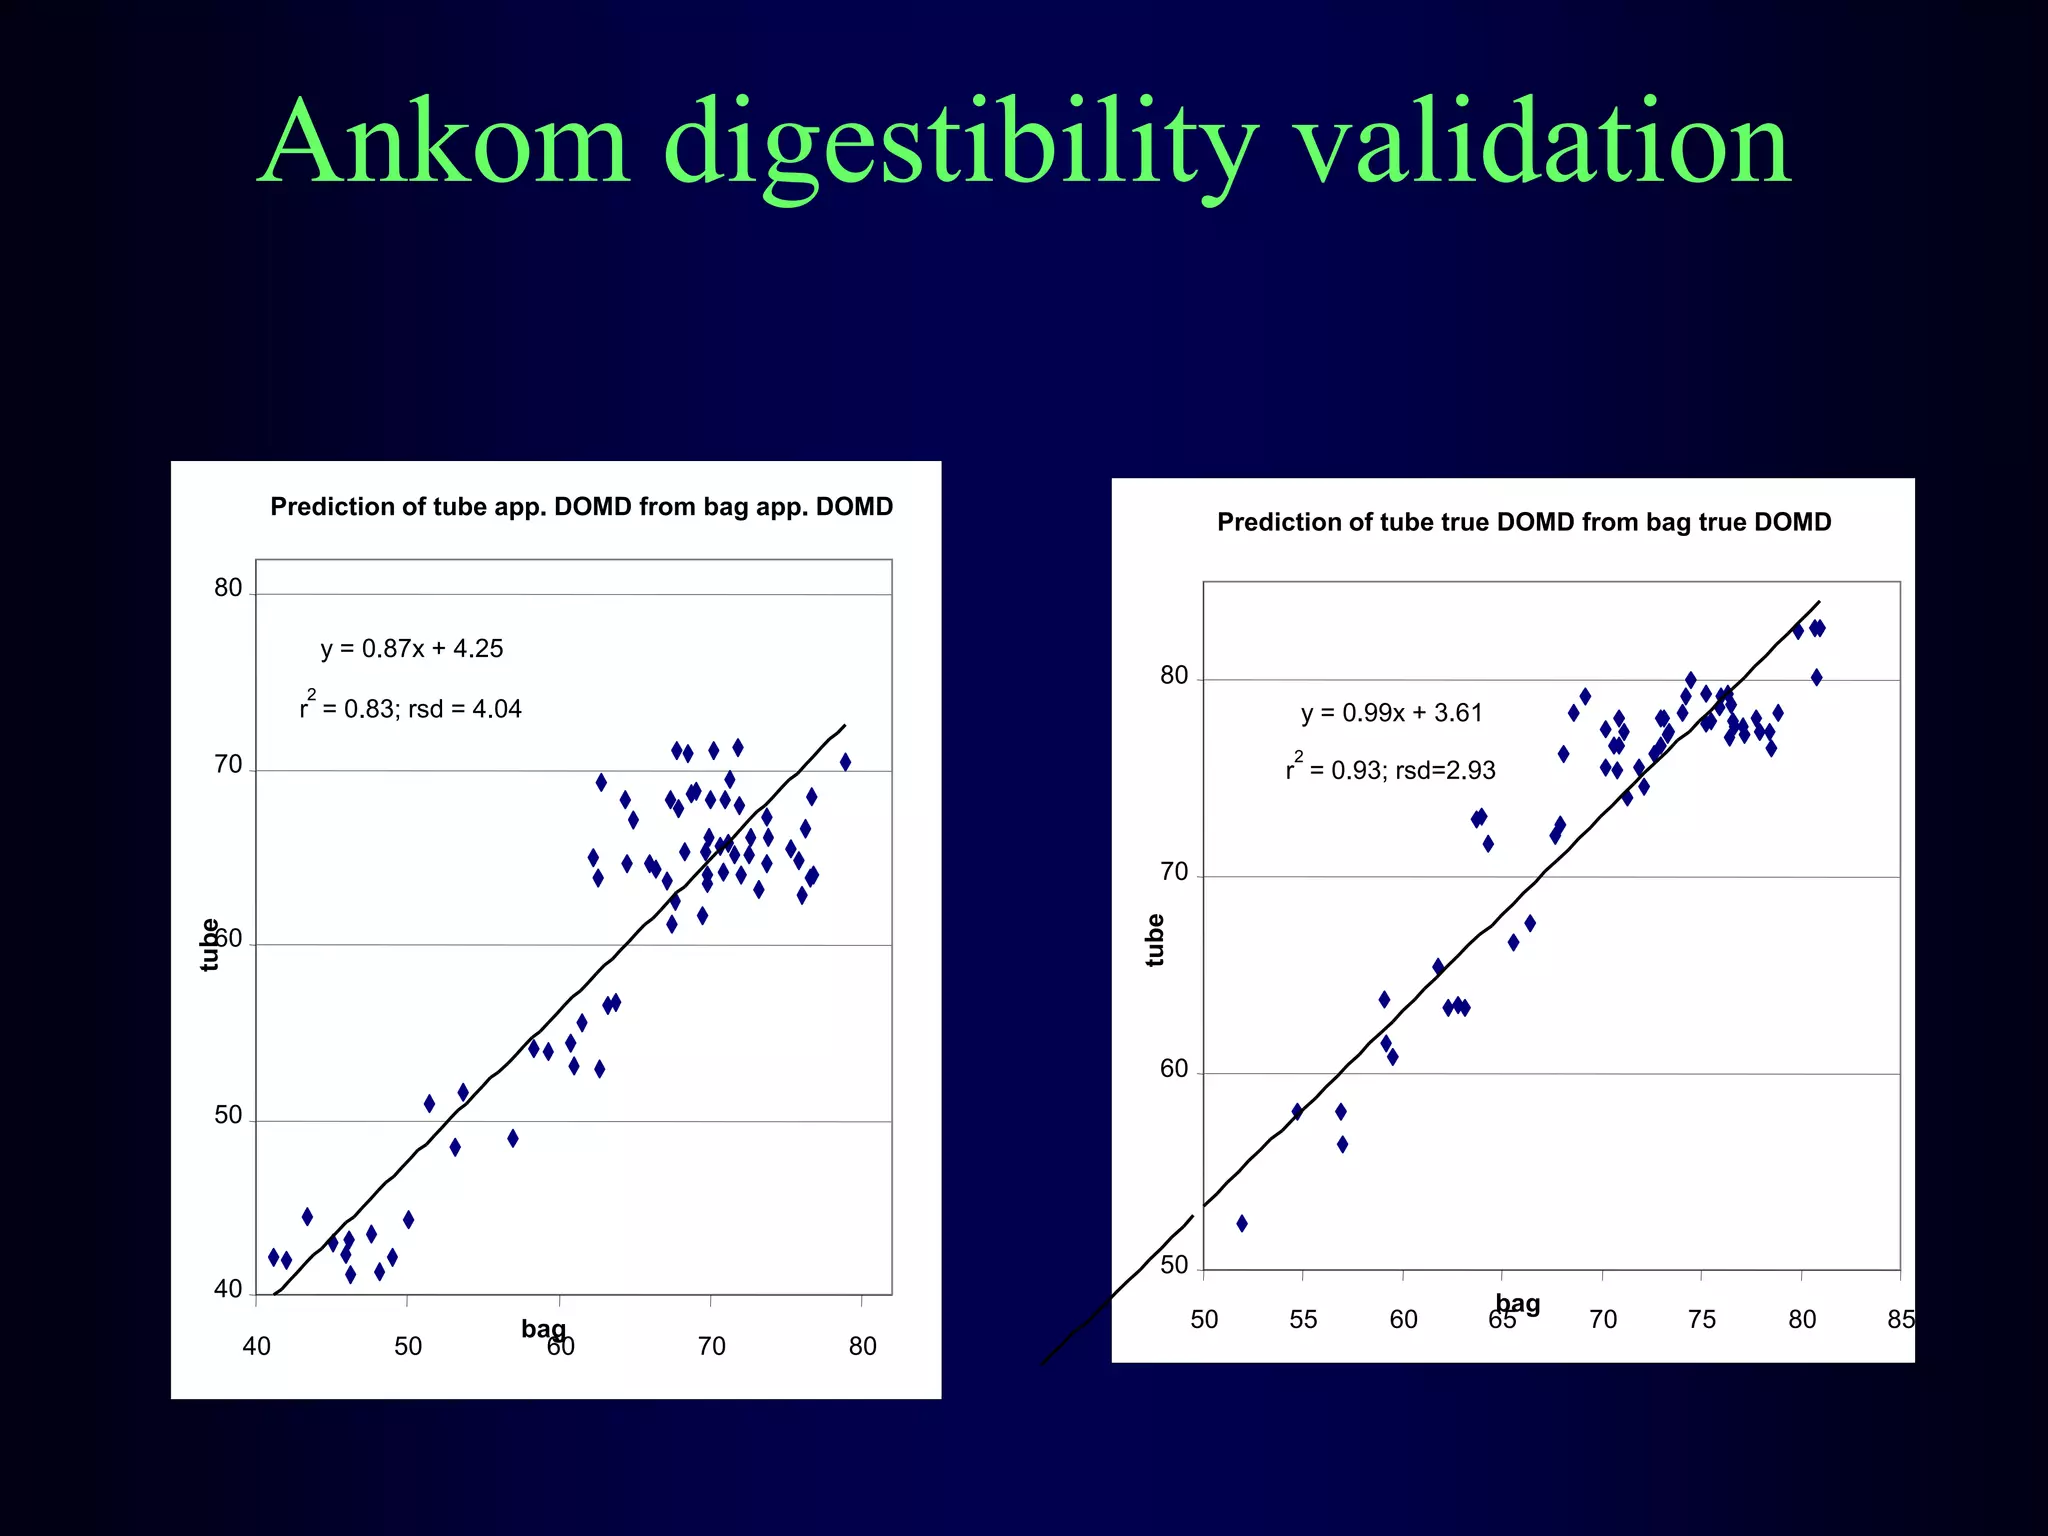

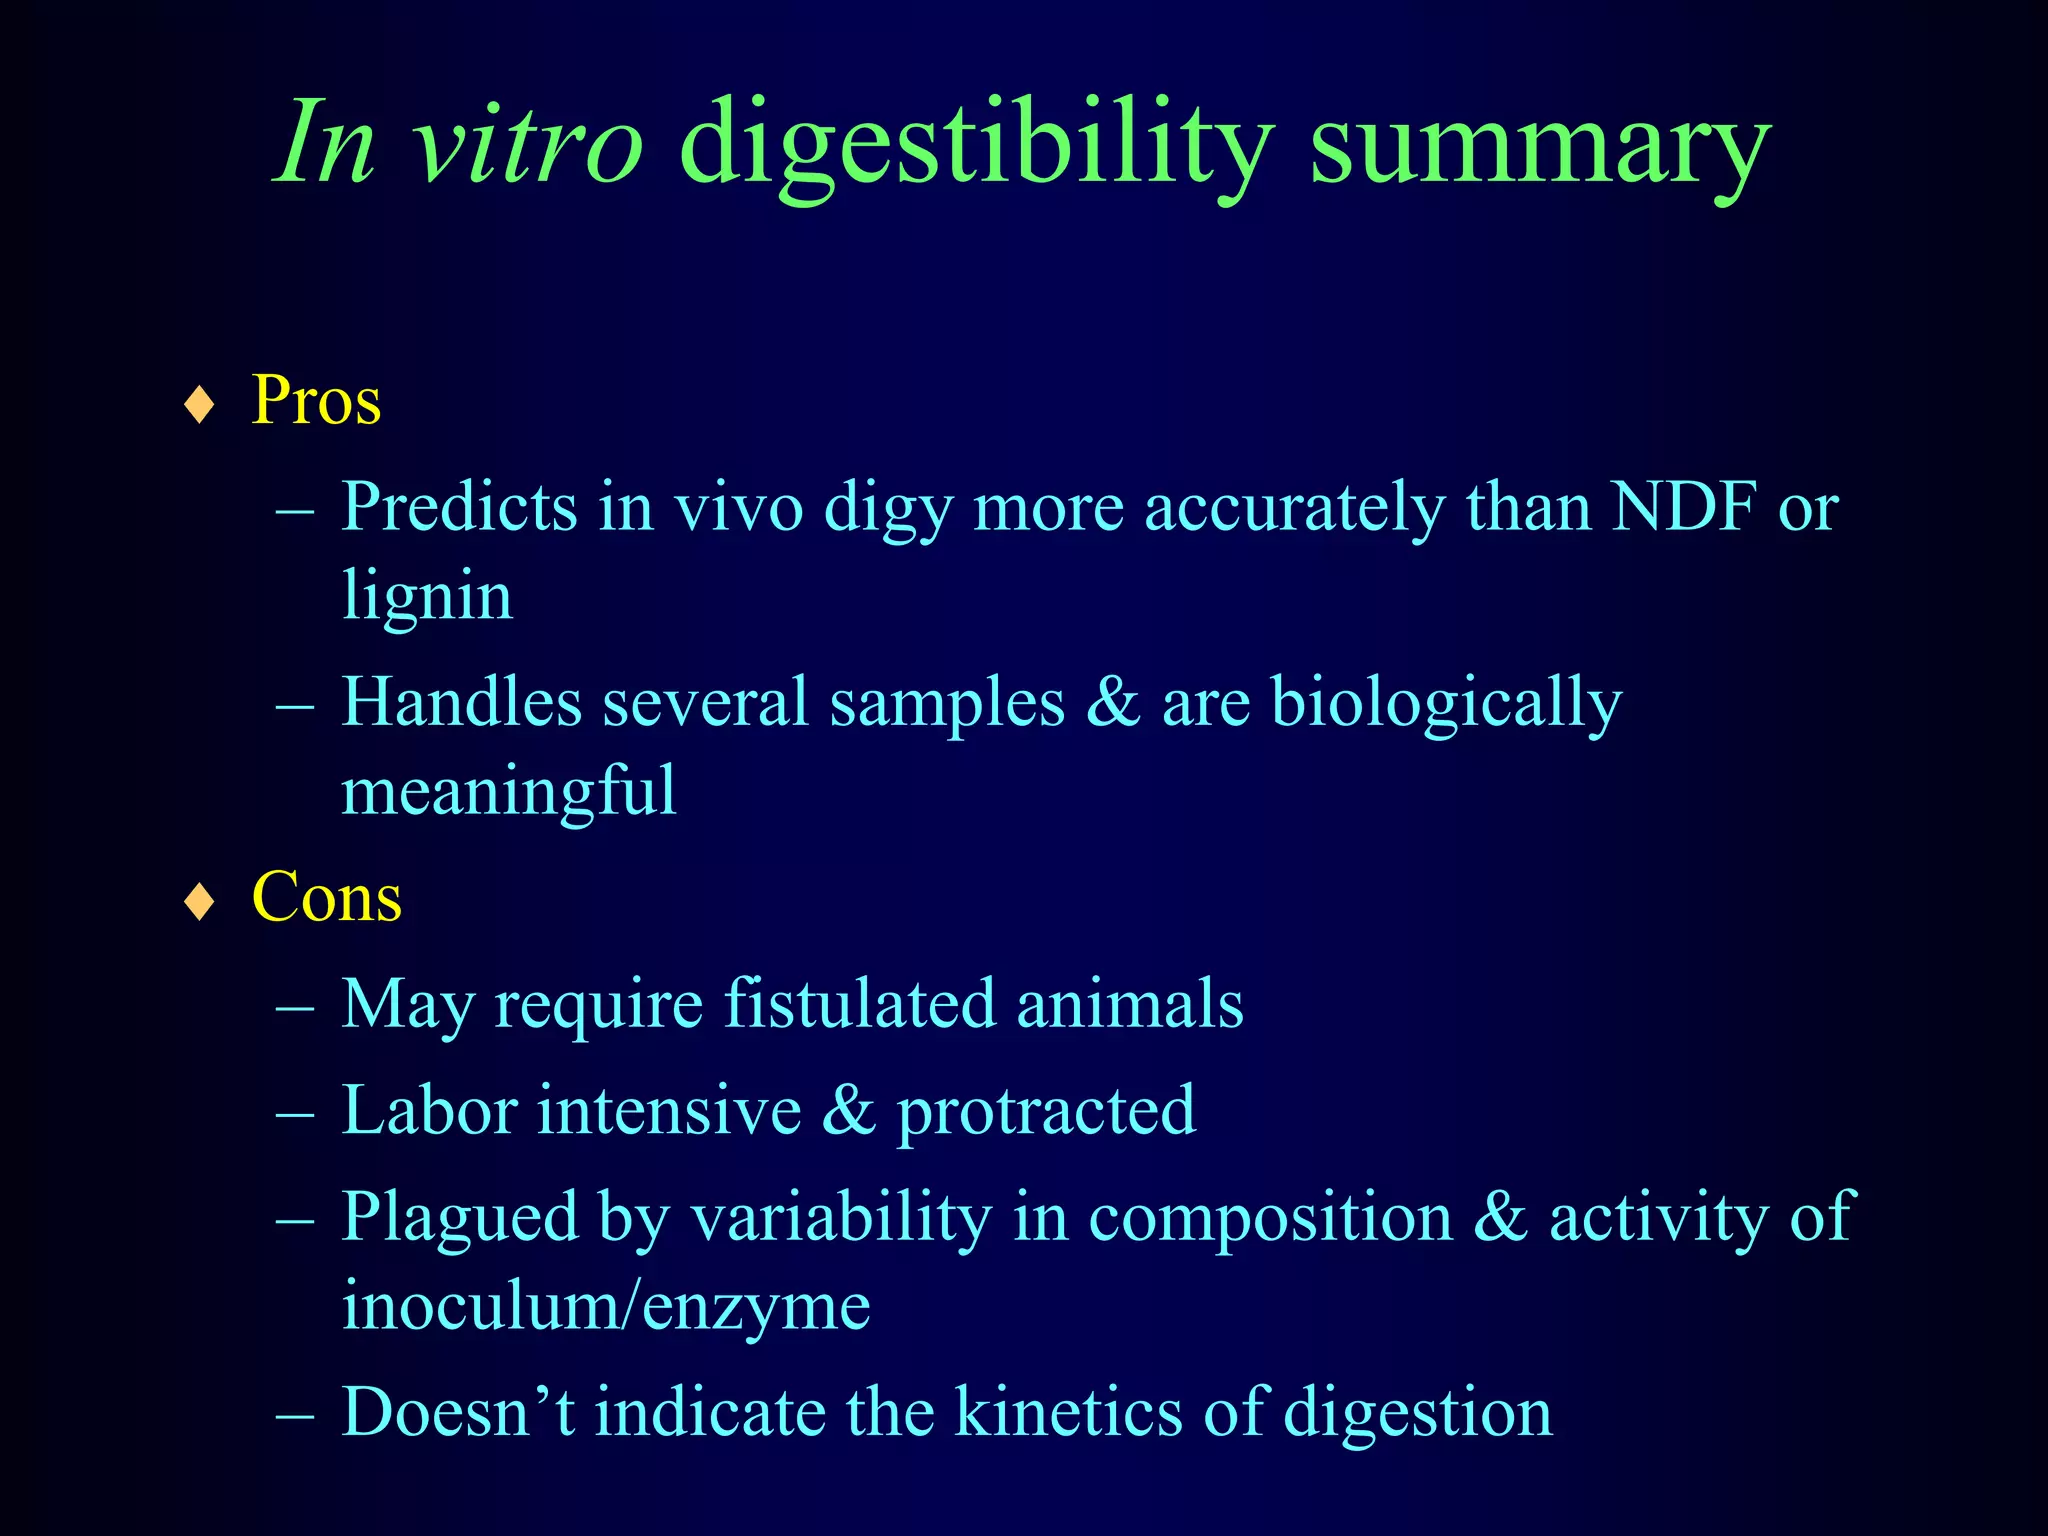

In vivo and in vitro methods are used to determine the digestibility of feeds for ruminants. True digestibility involves correcting for endogenous losses, while apparent digestibility does not. The rumen fluid-pepsin in vitro digestibility method provides accurate predictions of in vivo digestibility for most forages but has issues with variability in rumen fluid composition and activity. Cell-free enzyme methods address some limitations but do not fully represent the microbial activity in the rumen. Validation is needed to improve accuracy and consistency of in vitro digestibility methods.


