Downloaded 1,320 times


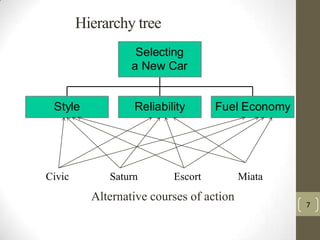
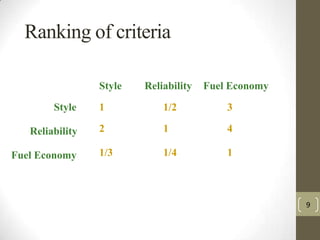
![Ranking of priorities
• Consider [Ax = maxx] where
• A is the comparison matrix of size n n, for n criteria, also called the priority matrix.
• x is the Eigenvector of size n 1, also called the priority vector.
• max is the Eigenvalue.
• To find the ranking of priorities, namely the Eigen Vector X:
1) Normalize the column entries by dividing each entry by the sum of the column.
2) Take the overall row averages.
A=
1
0.5 3
2
1
4
0.33 0.25 1.0
Column sums 3.33 1.75
8.00
Normalized
Column Sums
0.30
0.60
0.10
0.28
0.57
0.15
0.37
0.51
0.12
1.00
1.00
1.00
Row
averages
X=
0.32
0.56
0.12
Priority vector
10](https://image.slidesharecdn.com/analytichierarchyprocess-131203053620-phpapp01/85/Analytic-hierarchy-process-10-320.jpg)

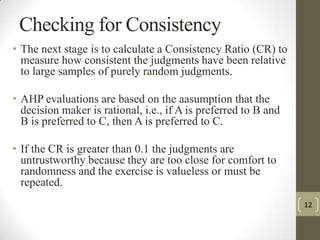
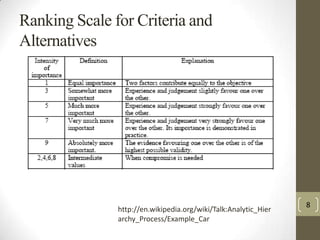
![Calculation of Consistency Ratio
• The next stage is to calculate max so as to lead to the
Consistency Index and the Consistency Ratio.
• Consider [Ax = max x] where x is the Eigenvector.
A
1
0.5
2
1
0.333 0.25
x
3
4
1.0
Ax
x
0.32
0.56
0.12
0.98
1.68
0.36
0.32
0.56
0.12
=
=
max
λmax=average{0.98/0.32, 1.68/0.56, 0.36/0.12}=3.04
Consistency index , CI is found by
CI=(λmax-n)/(n-1)=(3.04-3)/(3-1)= 0.02
13](https://image.slidesharecdn.com/analytichierarchyprocess-131203053620-phpapp01/85/Analytic-hierarchy-process-13-320.jpg)


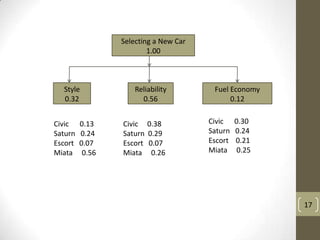


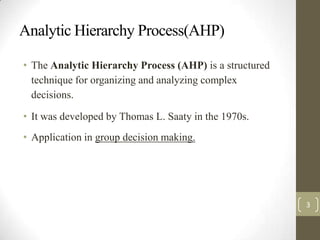
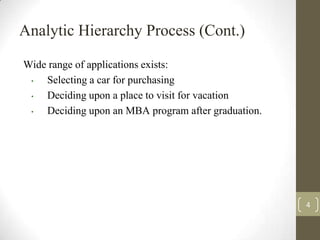
The document describes the Analytic Hierarchy Process (AHP), which is a structured technique for organizing and analyzing complex decisions. AHP involves constructing a hierarchy of criteria and alternatives, then making pairwise comparisons between elements to determine their relative importance. These comparisons are used to calculate weights for criteria and priorities for alternatives. The document provides an example of using AHP to select a car based on style, reliability, and fuel economy criteria. It also outlines the steps to determine criteria weights, alternative priorities, and consistency ratios in AHP.