Downloaded 72 times


![Future Findings
We will compare our results found in AHP with other methods such as :
TOPSIS
FUZZY
REFERENCES
[1] Saaty, T.L., 1980. “The Analytic Hierarchy Process.” McGraw-Hill, New York
[2] Wikipedia for problem definition of AHP.
[3] Saaty@katz.pitt.edu
[4] T. L. Saaty, Inconsistency and rank preservation. J. math. Psychol. 28(2),
2055214 (1984).
[5] R. Venkatarao phd (Decision Making in the Manufacturing Environment)
[6] Expert Choice, software package. Decision Support Software, McLean, Va.
[7] Exam cell of KGCE from where we collected the result statistics for matrix
evaluation](https://image.slidesharecdn.com/ahppptltcenew-160508144402/85/Decision-Making-Using-The-Analytic-Hierarchy-Process-19-320.jpg)


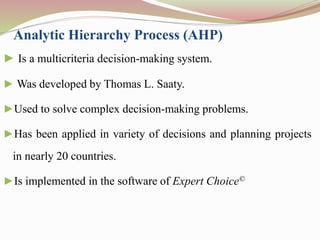
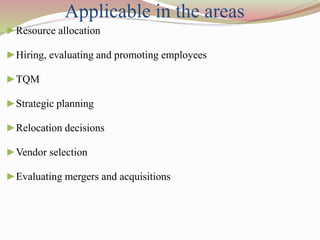
The document presents the Analytic Hierarchy Process (AHP), a multi-criteria decision-making system developed by Thomas L. Saaty, used for solving complex decision problems across various fields, including education and business. It outlines a systematic methodology involving the structuring of a hierarchy, making pairwise comparisons of alternatives and criteria, and synthesizing results to determine the best decision based on weighted priorities. The paper emphasizes its application in evaluating academic branches based on results over several years, highlighting the IT department's superior performance and discussing future comparisons with other decision-making methods.