The document provides an illustrated guide to the Analytic Hierarchy Process (AHP), a decision-making tool developed by Dr. Thomas L. Saaty. The AHP breaks down complex decisions into a hierarchy, with criteria and alternatives at each level. Pairwise comparisons are used to determine the relative importance of criteria and preferences of alternatives under each criterion. Eigenvector calculations then provide a ranking of the alternatives based on the weights. The example walks through choosing a new car using AHP, evaluating style, reliability, and fuel economy criteria to determine the Renault Clio is the highest ranked option.
The document contains messages from family members mourning the loss of their son/brother Darren. Michael expresses how Darren was the only one to call him by his nickname and how much he will miss him. Samantha says Darren was the most like her and she will forever miss and love him. Darren's father says he has always loved Darren and will see him again one day. Darren's mother is grateful to have had Darren as her son and will always keep his smile and laughter in her heart. Darren's sister Emily says he changed everyone's hearts, especially the family's, and they will always love him.
The cases shown are of different grades ofoohmyhairs
This document discusses different types and grades of hair loss such as baldness, burn marks, alopecia areata, dermatitis, vitiligo, and hyperpigmentation. It promotes a natural and homoeopathic treatment approach for hair loss by Dr. Anoop Maheshwari that has produced highly appreciable results compared to other treatments, is highly affordable, safe for all ages, and includes dietary advice for long-term hair regrowth and maintenance.
This document provides a brief introduction to basic R features such as starting R, entering commands, importing and manipulating data, creating vectors and data frames, and performing summary statistics and visualizations. Key points covered include starting R, entering commands and comments, arithmetic operations, creating sequences and assigning objects, importing data from files, subsetting and manipulating vectors and data frames, and creating histograms, boxplots and other plots. Examples are provided using the built-in FlightDelays data set.
Este documento describe la fisiopatología de las quemaduras. Explica que las quemaduras extensas pueden afectar múltiples sistemas del cuerpo. Describe las tres zonas de una quemadura (coagulación, estasis e hiperemia) y cómo los mediadores químicos como la tromboxano A2 y las prostaglandinas afectan la respuesta inflamatoria local. También explica cómo las quemaduras extensas pueden causar una respuesta inflamatoria sistémica que altera casi todos los sistemas del cuerpo y ca
The document summarizes a research journal article that analyzes factors affecting gross margin return on investment (GMROI) for FMCG companies in India. It examines the relationship between GMROI and inventory turnover, gross margin, firm size, and capital intensity using a panel data analysis of multiple listed Indian retail firms from 1999-2009. The research tests hypotheses about the correlation between these variables and GMROI. The analysis finds the productivity of inventory depends on these factors. Management decisions for inventory management can be informed by understanding the effects of these variables.
The document proposes a cloud-based centralized ERP solution to address gaps in the current fragmented ERP architecture of a large manufacturing company. It identifies problems in various stages like manufacturing, procurement, retail, and between the company and suppliers/customers. The proposed solution is a cloud ERP with customized apps for visibility and communication. Benefits include reduced costs, increased efficiency and visibility. Challenges of adoption are also discussed along with examples of similar implementations and cost estimates.
SJSoM Pratiman Case Study Competition 2013Rajib Layek
Computech Technologies should launch CBA & CFM or CPBA & CFM first to maximize profit and minimize risk. These combinations require the fewest number of students (around 23) to break even based on their costs. CBA & CFM is preferred because it requires around 3 students per course, which is a safe assumption for the untested brand.
A logistic regression model was created using 341 data points to predict enrollment in 3-month courses. The model found that only age was a significant predictor, with older customers less likely to enroll. The optimal model has a constant of 5.622 and an age coefficient of -0.133. This indicates the target profile for these short courses should be younger consumers.
Business Market Research on Instant Messaging -2013Rajib Layek
The document discusses a social research study conducted to derive a model for measuring loyalty of IIT Masters and PhD students in using instant messaging on mobile. It aimed to verify if the model used in a Malaysian university study could be applied here. The researchers broke down loyalty into usefulness and satisfaction constructs, then further into variables like network size, perceived usefulness, and more. They tested the reliability and independence of questionnaire responses to validate the constructs. Factor and regression analyses showed satisfaction is defined by attention focus and perceived complementarity, while usefulness is defined by network size, perceived enjoyment and complementarity. The final standardized model showed loyalty is defined by satisfaction and usefulness.
1. Voyages Soleil, a Canadian tour operator, must decide on a hedging strategy by April 1st to deal with $60 million in payables due in October denominated in US dollars, exposing the company to foreign exchange risk.
2. The company has three alternatives: do nothing and take the exchange rate risk, hedge using forward contracts, or borrow in Canadian dollars and invest in US dollars.
3. Hedging using forward contracts at a rate of $1.59 Canadian dollars per $1 US dollar locks in the payment at $95.68 million Canadian dollars and eliminates exchange rate risk, making it the recommended alternative.
MothersonSumi Systems (MSSL) is an Indian automotive components maker with a presence in mirrors, wiring harnesses, and molded plastic parts. It services multiple automakers across geographies. The Indian auto components sector is poised to benefit from recovery in overseas sales and continued domestic auto growth. Streamlining costs and improving productivity have led to stronger financials for companies like MSSL. Diversification into non-auto segments and wider exports are new revenue drivers. Moreover, India retains an edge over China as a low-cost manufacturing base due to better intellectual property protections. Key growth drivers for MSSL include sustained two-wheeler demand, India's role as a small car hub, replacement demand, and overseas
GAMESTAGE is a fully online B2B event that allows mobile game developers to showcase pre-release games to global publishers without needing to leave their office or sign NDAs. The event will take place from December 1-14, 2014 and allow developers and publishers to view each other's profiles, download test builds of games, and message one another directly. GAMESTAGE Season 1 helped 20 developers and 13 publishers save money and time while creating new partnerships.
This document provides information about GAME STAGE, an online B2B Korean mobile game showcase from August 25-31 for overseas publishers and investors. It will feature around 50 pre-release mobile game companies. Developers can network with publishers, receive feedback, and distribute test builds of their games through a secure online platform. Publishers and investors can discover new game trends, network with developers, and test unpublished game builds. Registration is $100 with a $50 fee for translation services and requires applicants be verified publishers or investors.
India is the world’s largest two-wheeler market and despite the losses suffered by bike makers in India during the shift to BS-IV, the industry recovered well with a massive growth of 14.80 percent. Overall the two-wheeler industry saw a total sales of over 2.01 cr. units sold in the Indian domestic market and exports from the country also shot up by over 20 percent. Within the Two Wheelers segment, Motorcycles grew by 13.69 percent respectively.(Financial Express). From that report we can conclude that every 5th person owns a 2-wheeler and it is a vast market. So we try to understand the decision making part which done before buy a bike. We took five criteria to which helps customers to take decision and five alternative choice from which customer can choose their final product.
The document discusses production possibilities curves and opportunity cost. It provides examples of production possibility curves showing the tradeoffs between producing two goods, like economy cars and luxury cars. It explains that points on a production possibilities curve represent efficient use of resources, while points inside or outside the curve represent inefficient use of resources. If new technologies increase resources, the production possibilities curve will shift outward, allowing more total production. The opportunity cost of producing a given amount of one good is the amount of the other good that cannot be produced as a result.
The document provides sample problems and discussion questions for each week of an economics course, including problems related to production functions, demand and elasticity, forecasting, and the global economy. Students are asked to analyze scenarios and data, calculate economic measures, and discuss how managers could apply the economic concepts when making business decisions to maximize profitability.
This document provides an overview of the course materials and assignments for ECO 550 at Strayer University. It includes sample problems from chapters 1-3 and 5-6 that focus on topics like the principal-agent problem, elasticity, demand and supply analysis, and forecasting models. Students are asked to complete problems, discussions, and a quiz on these economics fundamentals each week. The course uses managerial decision-making scenarios to explore how businesses use economic analysis for issues like pricing, costs, demand estimation and forecasting.
This project is made up of 4 different parts. The dataset for alrochellwa9f
This project is made up of 4 different parts. The dataset for all 4 parts is given in the table below. Students are encouraged to use software (Minitab, excel etc.) to complete the project. For more help see your professor.
CARS: A sample of 20 cars, including measurements of fuel consumption (city mi/gal and highway mi/gal), weight (pounds), number of cylinders, engine displacement (in liters), amount of greenhouse gases emitted (in tons/year), and amount of tailpipe emissions of NOx (in lb/yr).
CAR
CITY
HWY
WEIGHT
CYLINDERS
DISPLACEMENT
MAN/AUTO
GHG
NOX
Chev. Camaro
19
30
3545
6
3.8
M
12
34.4
Chev. Cavalier
23
31
2795
4
2.2
A
10
25.1
Dodge Neon
23
32
2600
4
2
A
10
25.1
Ford Taurus
19
27
3515
6
3
A
12
25.1
Honda Accord
23
30
3245
4
2.3
A
11
25.1
Lincoln Cont.
17
24
3930
8
4.6
A
14
25.1
Mercury Mystique
20
29
3115
6
2.5
A
12
34.4
Mitsubishi Eclipse
22
33
3235
4
2
M
10
25.1
Olds. Aurora
17
26
3995
8
4
A
13
34.4
Pontiac Grand Am
22
30
3115
4
2.4
A
11
25.1
Toyota Camry
23
32
3240
4
2.2
M
10
25.1
Cadillac DeVille
17
26
4020
8
4.6
A
13
34.4
Chev. Corvette
18
28
3220
8
5.7
M
12
34.4
Chrysler Sebring
19
27
3175
6
2.5
A
12
25.1
Ford Mustang
20
29
3450
6
3.8
M
12
34.4
BMW 3-Series
19
27
3225
6
2.8
A
12
34.4
Ford Crown Victoria
17
24
3985
8
4.6
A
14
25.1
Honda Civic
32
37
2440
4
1.6
M
8
25.1
Mazda Protege
29
34
2500
4
1.6
A
9
25.1
Hyundai Accent
28
37
2290
4
1.5
A
9
34.4
Part I
Generally the first step to analyze a dataset that is given to you is to identify the type of data, and picture the data using graphs etc. Use the data set above to answer the following questions:
1. Assume that the
car
column represents all car models. Use the random number Table B, to generate a simple random sample of 15 car models from the set above.
2. Classify all the columns: car, city, HWY, weight, cylinders, displacement man/auto GHG NOX according to the following:
i. Categorical or quantitative
ii. Discrete or continuous or none
iii. Levels of measurement: nominal, ordinal, interval or ratio.
3. Make a frequency distribution for MAN/AUTO
4. Make a frequency distribution for DISPLACEMENT. (also include the column for cumulative frequency)
5. Make a bar graph or pie chart for MAN/AUTO.
6. Make a histogram for DISPLACEMENT.
i. Determine the type of skewness- left, right, symmetric or none.
ii. Determine the variability-high or low.
7. Make a stemplot for CITY
i. Determine the type of skewness- left, right, symmetric or none.
ii. Determine the variability-high or low or none.
8. Make a dotplot for CYLINDER.
i. Determine t ...
The document provides an overview of microeconomics and macroeconomics concepts. It defines microeconomics as focusing on individual components of the economy like specific markets or firms, while macroeconomics examines the overall economy as a whole. It discusses the production possibilities curve and how it illustrates scarcity and tradeoffs between allocating resources to different goods. Economic growth is demonstrated as a shift of the production possibilities curve outward, allowing for more total output.
The document discusses various aspects of petrophysical uncertainty analysis including:
1) Purely statistical analysis can produce unrealistic uncertainty ranges that do not reflect reality or dependencies between parameters.
2) Different subsurface models may produce different views of uncertainty that should be considered.
3) It is important to define uncertainty, risk, and how changes in uncertainty may impact project decisions and risks in order to determine the value of collecting more data to reduce uncertainty.
SPE Aberdeen - The Astonishing Simplicity of Offshore Energy Risk Management ...George Grangeon-Amaral
This document discusses risk management and collaboration in the offshore energy industry. It begins by stating that operators and supply chain companies are in the business of managing risk. It then discusses traditional risk allocation models and notes that these models are increasingly being challenged by offshore oil and gas and wind industries demanding more supply chain accountability. Finally, it concludes that a relationship management strategy on its own is unlikely to succeed in a tight money environment without also incorporating effective collaborative risk management to improve project efficiencies.
The document provides information about an economics revision workshop, including sessions on how markets work and elasticities, market failure and government intervention, measuring UK economic performance, demand and supply side policies, and policy conflicts. It gives exam advice on answering questions and provides a glossary of key macroeconomic terms.
This document provides an assignment question paper for a Managerial Economics course. It includes 6 questions related to topics like production functions, consumer demand estimation techniques, cost curves, inflation, price and income elasticity of demand, and revenue. The questions range from 3 to 10 marks and require explanations of concepts, definitions, types, and relationships with examples and diagrams as needed. Students are instructed to answer all questions and target approximately 400 words for 10 mark questions. Each question is followed by an evaluation scheme.
The document discusses the concept of volatility and risk in financial markets. It defines volatility as a measure of risk based on the standard deviation of returns. While a lower standard deviation is typically seen as less risky, the document argues that high volatility does not always indicate higher risk. It provides examples showing that assuming returns follow a normal distribution can underestimate the risk of extreme events. The document advocates considering alternative risk measures that account for potential "fat tails" in return distributions.
This document provides an overview of Antero Resources Corporation. It begins with forward-looking statements and disclosures, noting that the document contains projections that may not come to pass. It then provides updates to slides presented in a prior September 2016 presentation, including improved well economics from lower costs and longer laterals, higher estimated ultimate recoveries, and updated financial information. The document highlights Antero's large core acreage position, growing production and improving well returns, leading realized prices due to premium sales contracts, and strong balance sheet with significant liquidity. It presents Antero as well positioned for sustainable growth in the Appalachian basin.
Multiple Linear Regression Applications Automobile Pricinginventionjournals
This document describes using multiple linear regression to predict automobile prices. The response variable is price from Kelley Blue Book for 470 cars. Potential explanatory variables are mileage, make, type, liter size, cruise control, upgraded speakers, and leather seats. Preliminary analysis finds mileage and liter have significant correlations with price. The final regression model finds price is best predicted by an equation involving liter size and mileage as the most important factors. The model explains over 80% of price variation and provides a way for buyers and sellers to estimate reasonable car prices.
This document provides advice and tips for achieving strong exam performance in A2 Microeconomics. It emphasizes using economic concepts and contextualizing answers with diagrams and data. Key points include defining terms, explaining answers thoroughly, annotating diagrams, and including critical evaluations. Sample multiple choice questions are provided as examples of structured responses. The document also directs students to online resources for additional help from teachers and fellow students on social media.
The document discusses relevant costs for decision making. It provides examples of identifying relevant costs when deciding whether to replace an old loader with a new one, whether to accept a special order, and whether to outsource the production of in-flight desserts. Relevant costs are those that differ between alternatives and affect the decision. Sunk costs and future costs that do not differ between alternatives are never relevant.
Monte-Carlo simulations - Kim BENNI @ ComRisk London May 2017Kim Benni
Monte-Carlo simulation and what-if scenarios are both methods used to analyze market and price risk. Monte-Carlo simulation involves running many trials using random variables and probabilities to generate scenarios. It requires selecting an appropriate data set and price evolution model. The results can be used to determine values like VaR. What-if scenarios lay out specific hypothetical scenarios but may lack imagination. Monte-Carlo provides a more systematic approach but requires significant calibration and maintenance of the model.
Rising fuel prices, new regulations, increased demand and a shrinking driver pool are raising the stakes and creating new headaches for shippers looking to keep their supply chains running smoothly. By taking steps now, you can take advantage of cost- and time-saving options to help you stay ahead of the competition.
The document summarizes a webinar on energy procurement and risk management presented by E&C America Inc. It included a presentation on how energy markets work and the benefits of risk management strategies for companies. The webinar consisted of a presentation followed by a question and answer session. Key topics covered in the presentation included historical natural gas price trends, US LNG export projects, electricity generation trends, and Clean Power Plan implementation. Various risk management strategies and hedging techniques were also discussed to help companies manage volatility in energy markets.
3 Simple Steps To Buy Verified Payoneer Account In 2024SEOSMMEARTH
Buy Verified Payoneer Account: Quick and Secure Way to Receive Payments
Buy Verified Payoneer Account With 100% secure documents, [ USA, UK, CA ]. Are you looking for a reliable and safe way to receive payments online? Then you need buy verified Payoneer account ! Payoneer is a global payment platform that allows businesses and individuals to send and receive money in over 200 countries.
If You Want To More Information just Contact Now:
Skype: SEOSMMEARTH
Telegram: @seosmmearth
Gmail: seosmmearth@gmail.com
At Techbox Square, in Singapore, we're not just creative web designers and developers, we're the driving force behind your brand identity. Contact us today.
The 10 Most Influential Leaders Guiding Corporate Evolution, 2024.pdfthesiliconleaders
In the recent edition, The 10 Most Influential Leaders Guiding Corporate Evolution, 2024, The Silicon Leaders magazine gladly features Dejan Štancer, President of the Global Chamber of Business Leaders (GCBL), along with other leaders.
Top mailing list providers in the USA.pptxJeremyPeirce1
Discover the top mailing list providers in the USA, offering targeted lists, segmentation, and analytics to optimize your marketing campaigns and drive engagement.
Discover timeless style with the 2022 Vintage Roman Numerals Men's Ring. Crafted from premium stainless steel, this 6mm wide ring embodies elegance and durability. Perfect as a gift, it seamlessly blends classic Roman numeral detailing with modern sophistication, making it an ideal accessory for any occasion.
https://rb.gy/usj1a2
Zodiac Signs and Food Preferences_ What Your Sign Says About Your Tastemy Pandit
Know what your zodiac sign says about your taste in food! Explore how the 12 zodiac signs influence your culinary preferences with insights from MyPandit. Dive into astrology and flavors!
LA HUG - Video Testimonials with Chynna Morgan - June 2024Lital Barkan
Have you ever heard that user-generated content or video testimonials can take your brand to the next level? We will explore how you can effectively use video testimonials to leverage and boost your sales, content strategy, and increase your CRM data.🤯
We will dig deeper into:
1. How to capture video testimonials that convert from your audience 🎥
2. How to leverage your testimonials to boost your sales 💲
3. How you can capture more CRM data to understand your audience better through video testimonials. 📊
Storytelling is an incredibly valuable tool to share data and information. To get the most impact from stories there are a number of key ingredients. These are based on science and human nature. Using these elements in a story you can deliver information impactfully, ensure action and drive change.
Taurus Zodiac Sign: Unveiling the Traits, Dates, and Horoscope Insights of th...my Pandit
Dive into the steadfast world of the Taurus Zodiac Sign. Discover the grounded, stable, and logical nature of Taurus individuals, and explore their key personality traits, important dates, and horoscope insights. Learn how the determination and patience of the Taurus sign make them the rock-steady achievers and anchors of the zodiac.
Tata Group Dials Taiwan for Its Chipmaking Ambition in Gujarat’s DholeraAvirahi City Dholera
The Tata Group, a titan of Indian industry, is making waves with its advanced talks with Taiwanese chipmakers Powerchip Semiconductor Manufacturing Corporation (PSMC) and UMC Group. The goal? Establishing a cutting-edge semiconductor fabrication unit (fab) in Dholera, Gujarat. This isn’t just any project; it’s a potential game changer for India’s chipmaking aspirations and a boon for investors seeking promising residential projects in dholera sir.
Visit : https://www.avirahi.com/blog/tata-group-dials-taiwan-for-its-chipmaking-ambition-in-gujarats-dholera/
Evgen Osmak: Methods of key project parameters estimation: from the shaman-in...
Analytics
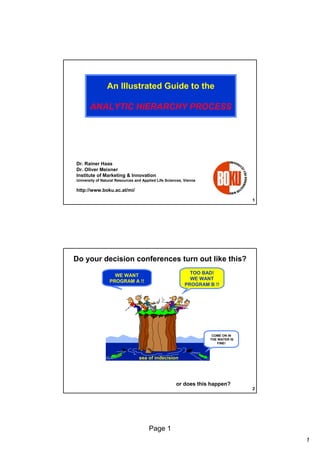
1. An Illustrated Guide to the
ANALYTIC HIERARCHY PROCESS
Dr. Rainer Haas
Dr. Oliver Meixner
Institute of Marketing & Innovation
University of Natural Resources and Applied Life Sciences, Vienna
http://www.boku.ac.at/mi/
1
Do your decision conferences turn out like this?
TOO BAD!
WE WANT
PROGRAM B !!
WE WANT
PROGRAM A !!
COME ON IN
THE WATER IS
FINE!
sea of indecision
or does this happen?
2
Page 1
1
2. DO YOUR RECOMMENDATIONS
TURN OUT LIKE THIS?
BUT BOSS...
THAT WAS MY
BEST GUESS!
GUESS AGAIN
MAYBE YOU NEED A
NEW APPROACH
3
... another way of decision making
I THINK I ‘LL TRY THE
ANALYTIC HIERARCHY
PROCESS (AHP) !!!
4
Page 2
2
3. OKAY TELL US
ABOUT AHP
DR THOMAS L.
SAATY DEVELOPED
THE PROCESS IN
THE EARLY 1970’S
AND...
5
THE PROCESS HAS BEEN USED TO
ASSIST NUMEROUS CORPORATE AND
GOVERNMENT DECISION MAKERS.
Some examples of decision problems:
choosing a telecommunication system
formulating a drug policy
choosing a product marketing strategy
...
6
Page 3
3
4. Let’s show
how it works
PROBLEMS ARE
DECOMPOSED INTO A
HIERARCHY OF CRITERIA AND
ALTERNATIVES
Problem
Criterion 1
Criterion 1.1
...
Criterion 2
Criterion n
...
...
Alternative 1
Alternative 2
...
Alternative n
7
OKAY, HERE’S A DECISION
PROBLEM WE FACE IN OUR
PERSONAL LIVES
8
Page 4
4
5. I SEE A NEW CAR
IN YOUR FUTURE
9
AN IMPORTANT PART OF THE
PROCESS IS TO ACCOMPLISH THESE
THREE STEPS
• STATE THE OBJECTIVE:
– SELECT A NEW CAR
• DEFINE THE CRITERIA:
– STYLE, RELIABILITY, FUEL ECONOMY
• PICK THE ALTERNATIVES:
– CIVIC COUPE, SATURN COUPE, FORD ESCORT,
RENAULT CLIO
WHAT ABOUT COST?
(BE QUIET, WE’LL TALK ABOUT THAT LATER)
10
SKEPTIC-GATOR
Page 5
5
6. THIS INFORMATION IS THEN ARRANGED
IN A HIERARCHICAL TREE
OBJECTIVE
CRITERIA
Select a
new car
Style
ALTERNATIVES
Reliability
Civic
Saturn
Escort
Clio
Civic
Saturn
Escort
Clio
Fuel
Economy
Civic
Saturn
Escort
Clio
11
THE INFORMATION
IS THEN
SYNTHESIZED TO
DETERMINE
RELATIVE
RANKINGS OF
ALTERNATIVES
BOTH QUALITATIVE
AND QUANTITATIVE
CRITERIA CAN BE
COMPARED USING
INFORMED
JUDGMENTS TO
DERIVE WEIGHTS
AND PRIORITIES
12
Page 6
6
7. HOW DO YOU DETERMINE THE RELATIVE
IMPORTANCE OF THE CRITERIA?
Here’s one way !
STYLE
RELIABILITY
FUEL ECONOMY
13
Hmm, I think reliability is the most
important followed by style and fuel
economy is least importeant so I will
make the following judgements ....
HERE’S ANOTHER WAY
USING JUDGMENTS TO
DETERMINE THE RANKING
OF THE CRITERIA
1. RELIABILITY IS 2 TIMES AS IMPORTANT AS STYLE
2. STYLE IS 3 TIMES AS IMPORTANT AS FUEL ECONOMY
3. RELIABILITY IS 4 TIMES AS IMPORTANT AS FUEL ECONOMY
he’s not very consistent here ... that’s o.k.
14
Page 7
7
8. A
Pairwise Comparisons
B
USING PAIRWISE COMPARISONS, THE RELATIVE IMPORTANCE
OF ONE CRITERION OVER ANOTHER CAN BE EXPRESSED
15
A
Pairwise Comparisons
B
USING PAIRWISE COMPARISONS, THE RELATIVE IMPORTANCE
OF ONE CRITERION OVER ANOTHER CAN BE EXPRESSED
1 equal 3 moderate 5 strong 7 very strong 9 extreme
STYLE
STYLE
RELIABILITY
1/1
FUEL ECONOMY
FUEL ECONOMY
3/1
1/1
RELIABILITY
1/2
4/1
1/1
16
Page 8
8
9. A
Pairwise Comparisons
B
USING PAIRWISE COMPARISONS, THE RELATIVE IMPORTANCE
OF ONE CRITERION OVER ANOTHER CAN BE EXPRESSED
1 equal 3 moderate 5 strong 7 very strong 9 extreme
STYLE
RELIABILITY
FUEL ECONOMY
STYLE
1/1
1/2
3/1
RELIABILITY
2/1
1/1
4/1
FUEL ECONOMY
1/3
1/4
1/1
17
How do you turn this MATRIX
into ranking of criteria?
STYLE
RELIABILITY
FUEL ECONOMY
STYLE
1/1
1/2
3/1
RELIABILITY
2/1
1/1
4/1
FUEL ECONOMY
1/3
1/4
1/1
18
Page 9
9
10. HOW DO YOU GET A RANKING OF PRIORITIES FROM A
PAIRWISE MATRIX?
AND THE
SURVEY SAYS
EIGENVECTOR !!
ACTUALLY...
DR THOMAS L. SAATY, CURRENTLY WITH THE UNIVERSITY OF
PITTSBURGH, DEMONSTRATED MATHEMATICALLY THAT THE
EIGENVECTOR SOLUTION WAS THE BEST APPROACH.
REFERENCE : THE ANALYTIC HIERARCHY PROCESS, 1990, THOMAS L. SAATY
19
HERE’S HOW TO SOLVE FOR THE EIGENVECTOR:
1. A SHORT COMPUTATIONAL WAY TO OBTAIN THIS RANKING
IS TO RAISE THE PAIRWISE MATRIX TO POWERS THAT ARE
SUCCESSIVELY SQUARED EACH TIME.
2. THE ROW SUMS ARE THEN CALCULATED AND NORMALIZED.
3. THE COMPUTER IS INSTRUCTED TO STOP WHEN THE
DIFFERENCE BETWEEN THESE SUMS IN TWO CONSECUTIVE
CALCULATIONS IS SMALLER THAN A PRESCRIBED VALUE.
SAY WHAT!
SHOW ME AN
EXAMPLE
20
Page 10
10
11. IT’S MATRIX ALGEBRA TIME !!!
STYLE
RELIABILITY
FUEL ECONOMY
STYLE
1/1
1/2
3/1
RELIABILITY
2/1
1/1
4/1
FUEL ECONOMY
1/3
1/4
1/1
FOR NOW, LET’S REMOVE THE NAMES AND
CONVERT THE FRACTIONS TO DECIMALS :
1.0000
0.5000
3.0000
2.0000
1.0000
4.0000
0.3333
0.2500
1.0000
21
STEP 1: SQUARING THE MATRIX
1.0000
2.0000
1.0000
4.0000
0.2500
1.0000
1.0000
0.5000
3.0000
2.0000
1.0000
4.0000
0.3333
THIS
3.0000
0.3333
THIS TIMES
0.5000
0.2500
1.0000
I.E. (1.0000 * 1.0000) + (0.5000 * 2.0000) +(3.0000 * 0.3333) = 3.0000
3.0000
RESULTS
IN THIS
1.7500
8.0000
5.3332
3.0000
14.0000
1.1666
0.6667
3.0000
22
Page 11
11
12. STEP 2 : NOW, LET’S COMPUTE OUR FIRST EIGENVECTOR
(TO FOUR DECIMAL PLACES)
FIRST, WE SUM THE ROWS
3.0000
+
1.7500
+
8.0000
= 12.7500
0.3194
5.3332
+
3.0000
+
14.0000
= 22.3332
0.5595
1.1666
+
0.6667
+
3.0000
=
4.8333
0.1211
39.9165
1.0000
SECOND, WE SUM THE ROW TOTALS
FINALLY, WE NORMALIZE BY DIVIDING
THE ROW SUM BY THE ROW TOTALS
(I.E. 12.7500 DIVIDED BY 39.9165 EQUALS 0.3194)
0.3194
THE RESULT IS OUR EIGENVECTOR
( A LATER SLIDE WILL EXPLAIN THE
MEANING IN TERMS OF OUR EXAMPLE)
0.5595
0.1211
23
THIS PROCESS MUST BE ITERATED UNTIL THE EIGENVECTOR
SOLUTION DOES NOT CHANGE FROM THE PREVIOUS ITERATION
(REMEMBER TO FOUR DECIMAL PLACES IN OUR EXAMPLE)
CONTINUING OUR EXAMPLE,
AGAIN, STEP 1: WE SQUARE THIS MATRIX
3.0000
1.7500
8.0000
5.3332
3.0000
14.0000
1.1666
0.6667
3.0000
27.6653
WITH THIS RESULT
15.8330
72.4984
48.3311
27.6662
126.6642
10.5547
6.0414
27.6653
24
Page 12
12
13. AGAIN STEP 2 : COMPUTE THE EIGENVECTOR (TO FOUR DECIMAL PLACES)
27.6653
+
15.8330
+
72.4984
= 115.9967
0.3196
48.3311
+
27.6662
+ 126.6642
= 202.6615
0.5584
10.5547
+
6.0414
+
=
44.2614
0.1220
TOTALS 362.9196
COMPUTE THE DIFFERENCE OF THE
PREVIOUS COMPUTED EIGENVECTOR
TO THIS ONE:
0.3194
= - 0.0002
0.3196
1.0000
27.6653
0.5595
0.5584
=
0.0011
0.1211
0.1220
= - 0.0009
TO FOUR DECIMAL PLACES THERE’S NOT MUCH DIFFERENCE
HOW ABOUT ONE MORE ITERATION?
25
I SURRENDER !!
DON’T MAKE ME COMPUTE
ANOTHER EIGENVECTOR
OKAY,OKAY
ACTUALLY, ONE MORE
ITERATION WOULD
SHOW NO DIFFERENCE
TO FOUR DECIMAL
PLACES
LET’S NOW LOOK AT
THE MEANING OF THE
EIGENVECTOR
26
Page 13
13
14. HERE’S OUR PAIRWISE
MATRIX WITH THE NAMES
STYLE
RELIABILITY
FUEL ECONOMY
STYLE
1/1
1/2
3/1
RELIABILITY
2/1
1/1
4/1
FUEL ECONOMY
1/3
1/4
1/1
AND THE COMPUTED EIGENVECTOR GIVES US THE RELATIVE
RANKING OF OUR CRITERIA
STYLE
0.3196
THE SECOND MOST IMPORTANT CRITERION
RELIABILITY
0.5584
THE MOST IMPORTANT CRITERION
FUEL ECONOMY
0.1220
THE LEAST IMPORTANT CRITERION
NOW BACK TO THE HIEARCHICAL TREE...
27
HERE’S THE TREE
WITH THE CRITERIA
WEIGHTS
OBJECTIVE
CRITERIA
Select a new
car
1.00
Style
.3196
ALTERNATIVES
Civic
Saturn
Escort
Clio
Reliability
.5584
Civic
Saturn
Escort
Clio
Fuel Economy
.1220
Civic
Saturn
Escort
Clio
WHAT ABOUT THE ALTERNATIVES?
I’M GLAD YOU ASKED...
28
SKEPTIC-GATOR
Page 14
14
15. IN TERMS OF STYLE, PAIRWISE COMPARISONS
DETERMINES THE PREFERENCE
OF EACH ALTERNATIVE OVER ANOTHER
STYLE
CIVIC SATURN ESCORT CLIO
CIVIC
1/1
1/4
4/1
1/6
SATURN
4/1
1/1
4/1
1/4
ESCORT
1/4
1/4
1/1
1/5
CLIO
6/1
4/1
5/1
1/1
AND...
29
IN TERMS OF RELIABILITY, PAIRWISE
COMPARISONS DETERMINES THE PREFERENCE
OF EACH ALTERNATIVE OVER ANOTHER
RELIABILITY
CIVIC SATURN ESCORT CLIO
CIVIC
1/1
2/1
5/1
1/1
SATURN
1/2
1/1
3/1
2/1
ESCORT
1/5
1/3
1/1
1/4
CLIO
1/1
1/2
4/1
1/1
ITS MATRIX ALGEBRA TIME!!!
30
Page 15
15
16. COMPUTING THE EIGENVECTOR
DETERMINES THE RELATIVE
RANKING OF ATERNATIVES
UNDER EACH CRITERION
RANKING
STYLE
RELIABILITY
RANKING
3
CIVIC
.1160
1
CIVIC
.3790
2
SATURN
.2470
2
SATURN
.2900
4
ESCORT
.0600
4
ESCORT
.0740
1
CLIO
.5770
3
CLIO
.2570
WHAT ABOUT FUEL ECONOMY?
ANOTHER GOOD QUESTION...
31
SKEPTIC-GATOR
AS STATED EARLIER,
AHP CAN COMBINE BOTH QUALITATIVE
AND QUANITATIVE INFORMATION
FUEL ECONOMY INFORMATION IS OBTAINED FOR EACH
ALTERNATIVE:
FUEL ECONOMY
(MILES/GALLON)
CIVIC
34
34 / 113 =
.3010
SATURN
27
27 / 113 =
.2390
ESCORT
24
24 / 113 =
.2120
CLIO
28
28 / 113 =
.2480
113
1.0000
NORMALIZING THE FUEL ECONOMY INFO
ALLOWS US TO USE IT WITH OTHER RANKINGS
32
Page 16
16
17. HERE’S THE TREE
WITH ALL THE
WEIGHTS
OBJECTIVE
CRITERIA
Select a new
car
1.00
Style
.3196
ALTERNATIVES
Civic
Saturn
Escort
Clio
Reliability
.5584
.1160
.2470
.0600
.5770
Civic
Saturn
Escort
Clio
Fuel Economy
.1220
.3790
.2900
.0740
.2570
Civic
Saturn
Escort
Clio
.3010
.2390
.2120
.2480
OKAY, NOW WHAT ? I THINK WE’RE READY
FOR THE ANSWER...
33
A LITTLE MORE MATRIX ALGEBRA GIVES US THE SOLUTION:
STYLE
RELIFUEL
ABILITY ECONOMY
CIVIC
.1160
.3790
.3010
SATURN
.2470
.2900
.2390
ESCORT
.0600
.0740
.2120
CLIO
.5770
.2570
.2480
CRITERIA
RANKING
0.3196
0.5584
RELIABILITY
0.1220
*
STYLE
FUEL ECONOMY
I.E. FOR THE CIVIC (.1160 * .3196) + (.3790 * .5584) + (.3010 * .1220) = .3060
Civic
=
.3060
Saturn
.2720
Escort
.0940
Clio
AND THE WINNER IS !!!
.3280
THE CLIO IS THE
HIGHEST RANKED CAR
34
Page 17
17
18. IN SUMMARY, THE ANALYTIC HIERARCHY
PROCESS PROVIDES A LOGICAL FRAMEWORK
TO DETERMINE THE BENEFITS OF EACH
ALTERNATIVE
1. Clio
.3280
2. Civic
.3060
3. Saturn
.2720
4. Escort
.0940
WHAT ABOUT COSTS?
WELL, I’LL TELL YOU...
SKEPTIC-GATOR
35
ALTHOUGH COSTS COULD HAVE BEEN
INCLUDED, IN MANY COMPLEX DECISIONS,
COSTS SHOULD BE SET ASIDE UNTIL THE
BENEFITS OF THE ALTERNATIVES ARE
EVALUATED
OTHERWISE THIS COULD HAPPEN...
YOUR PROGRAM COST TOO MUCH I
DON’T CARE ABOUT ITS BENEFITS
DISCUSSING COSTS
TOGETHER WITH BENEFITS
CAN SOMETIMES BRING FORTH
MANY POLITICAL AND
EMOTIONAL RESPONSES
36
Page 18
18
19. WAYS TO HANDLE BENEFITS
AND COSTS INCLUDE THE
FOLLOWING:
1. GRAPHING BENEFITS AND COSTS OF EACH ALTERNATIVE
.
BENEFITS
.
.
.
CHOSE ALTERNATIVE WITH LOWEST
COST AND HIGHEST BENEFIT
COSTS
2. BENEFIT TO COST RATIOS
3. LINEAR PROGRAMMING
4. SEPARATE BENEFIT AND COST HIERARCHICAL TREES
AND THEN COMBINE THE RESULTS
IN OUR EXAMPLE...
37
LET’S USE BENEFIT TO COST RATIOS
NORMALIZED
COSTS
BENEFIT - COST RATIOS
.3333
.3280 / .3333 = .9840
1. CLIO
COST $
18,000
2. CIVIC
12,000
.2222
.3060 / .2222 = 1.3771
3. SATURN
15,000
.2778
.2720 / .2778 =
.9791
4. ESCORT
9,000
.1667
.0940 / .1667 =
.5639
54,000
1.0000
(REMEMBER THE BENEFITS WERE DERIVED
EARLIER FROM THE AHP)
AND...
THE CIVIC IS THE WINNER WITH THE HIGHEST BENEFIT TO COST RATIO
38
Page 19
19
20. AHP CAN BE USED FOR VERY
COMPLEX DECISIONS
GOAL
MANY LEVELS OF CRITERIA
AND SUBCRITERIA CAN
BE INCLUDED
HERE’S SOME EXAMPLES
39
AHP CAN BE USED FOR A WIDE
VARIETY OF APPLICATIONS
STRATEGIC PLANNING
RESOURCE ALLOCATION
SOURCE SELECTION
BUSINESS/PUBLIC POLICY
PROGAM SELECTION
AND MUCH MUCH MORE...
40
Page 20
20