Download as PDF, PPTX


![Analytic Hierarchy Process Introduction
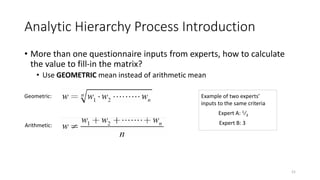
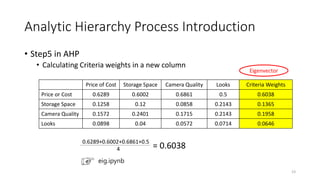
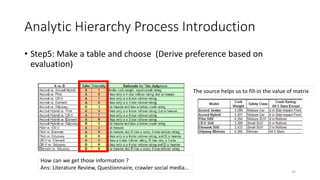
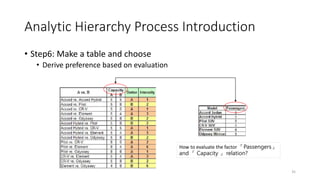
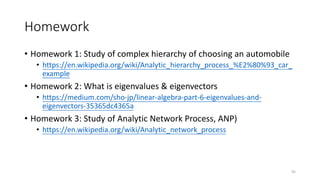
• Step4 in AHP
• Sum of columns and normalize them. (In ML we called feature scaling)
Price of Cost Storage Space Camera Quality Looks
Price or Cost 1/(1.59)=0.6289 5/(8.33)=0.6002 4/(5.83)=0.6861 7/14=0.5
Storage Space 1/5/(1.59)=0.1258 1/(8.33)=0.12 1/2/(5.83)=0.0858 3/14=0.2143
Camera Quality 1/4/(1.59)=0.1572 2/(8.33)=0.2401 1/(5.83)=0.1715 3/14=0.2143
Looks 1/7/(1.59)=0.0898 1/3/(8.33)=0.04 1/3/(5.83)=0.0572 1/14=0.0714
Sum 1.59 8.33 5.83 14
22
1.59 = 1+(1/5)+(1/4)+(1/7)
Normalization: Data will be rescaled so that the data will fall in the range of [0,1]
Standardization: Also called Z-score normalization, they’ll have the properties of a
standard normal distribution with mean(μ=0) and standard deviation(σ=1). This
scales the features in a way that they range between [-1,1]](https://image.slidesharecdn.com/5analytichierarchyprocess-210603100146/85/analytic-hierarchy_process-22-320.jpg)
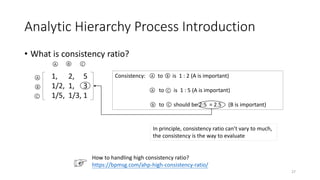
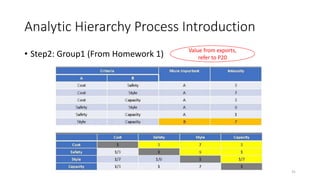


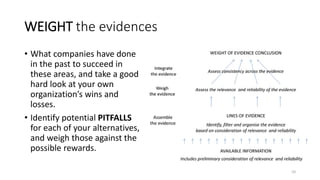
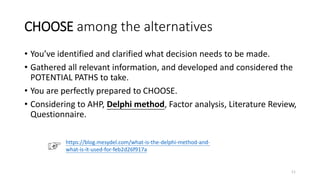
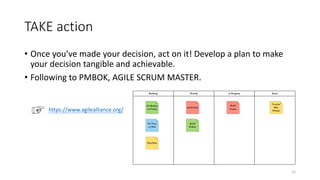
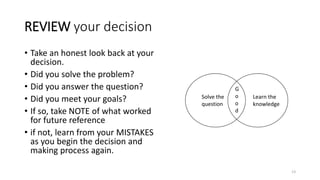
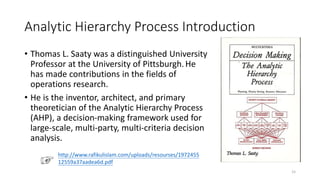
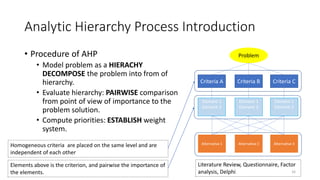
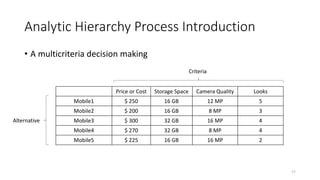
The document discusses the Analytic Hierarchy Process (AHP) decision-making method. It begins with an introduction to the speaker and overview of the tutorial. Then, it outlines the typical steps in the AHP decision-making process, including identifying the decision, gathering information, identifying alternatives, weighting criteria, choosing among alternatives, and reviewing the decision. The remainder of the document provides an in-depth explanation of applying the AHP process through pairwise comparisons and calculating weights and consistency. Examples are provided to illustrate how AHP can be used to evaluate multiple criteria in complex decision problems.