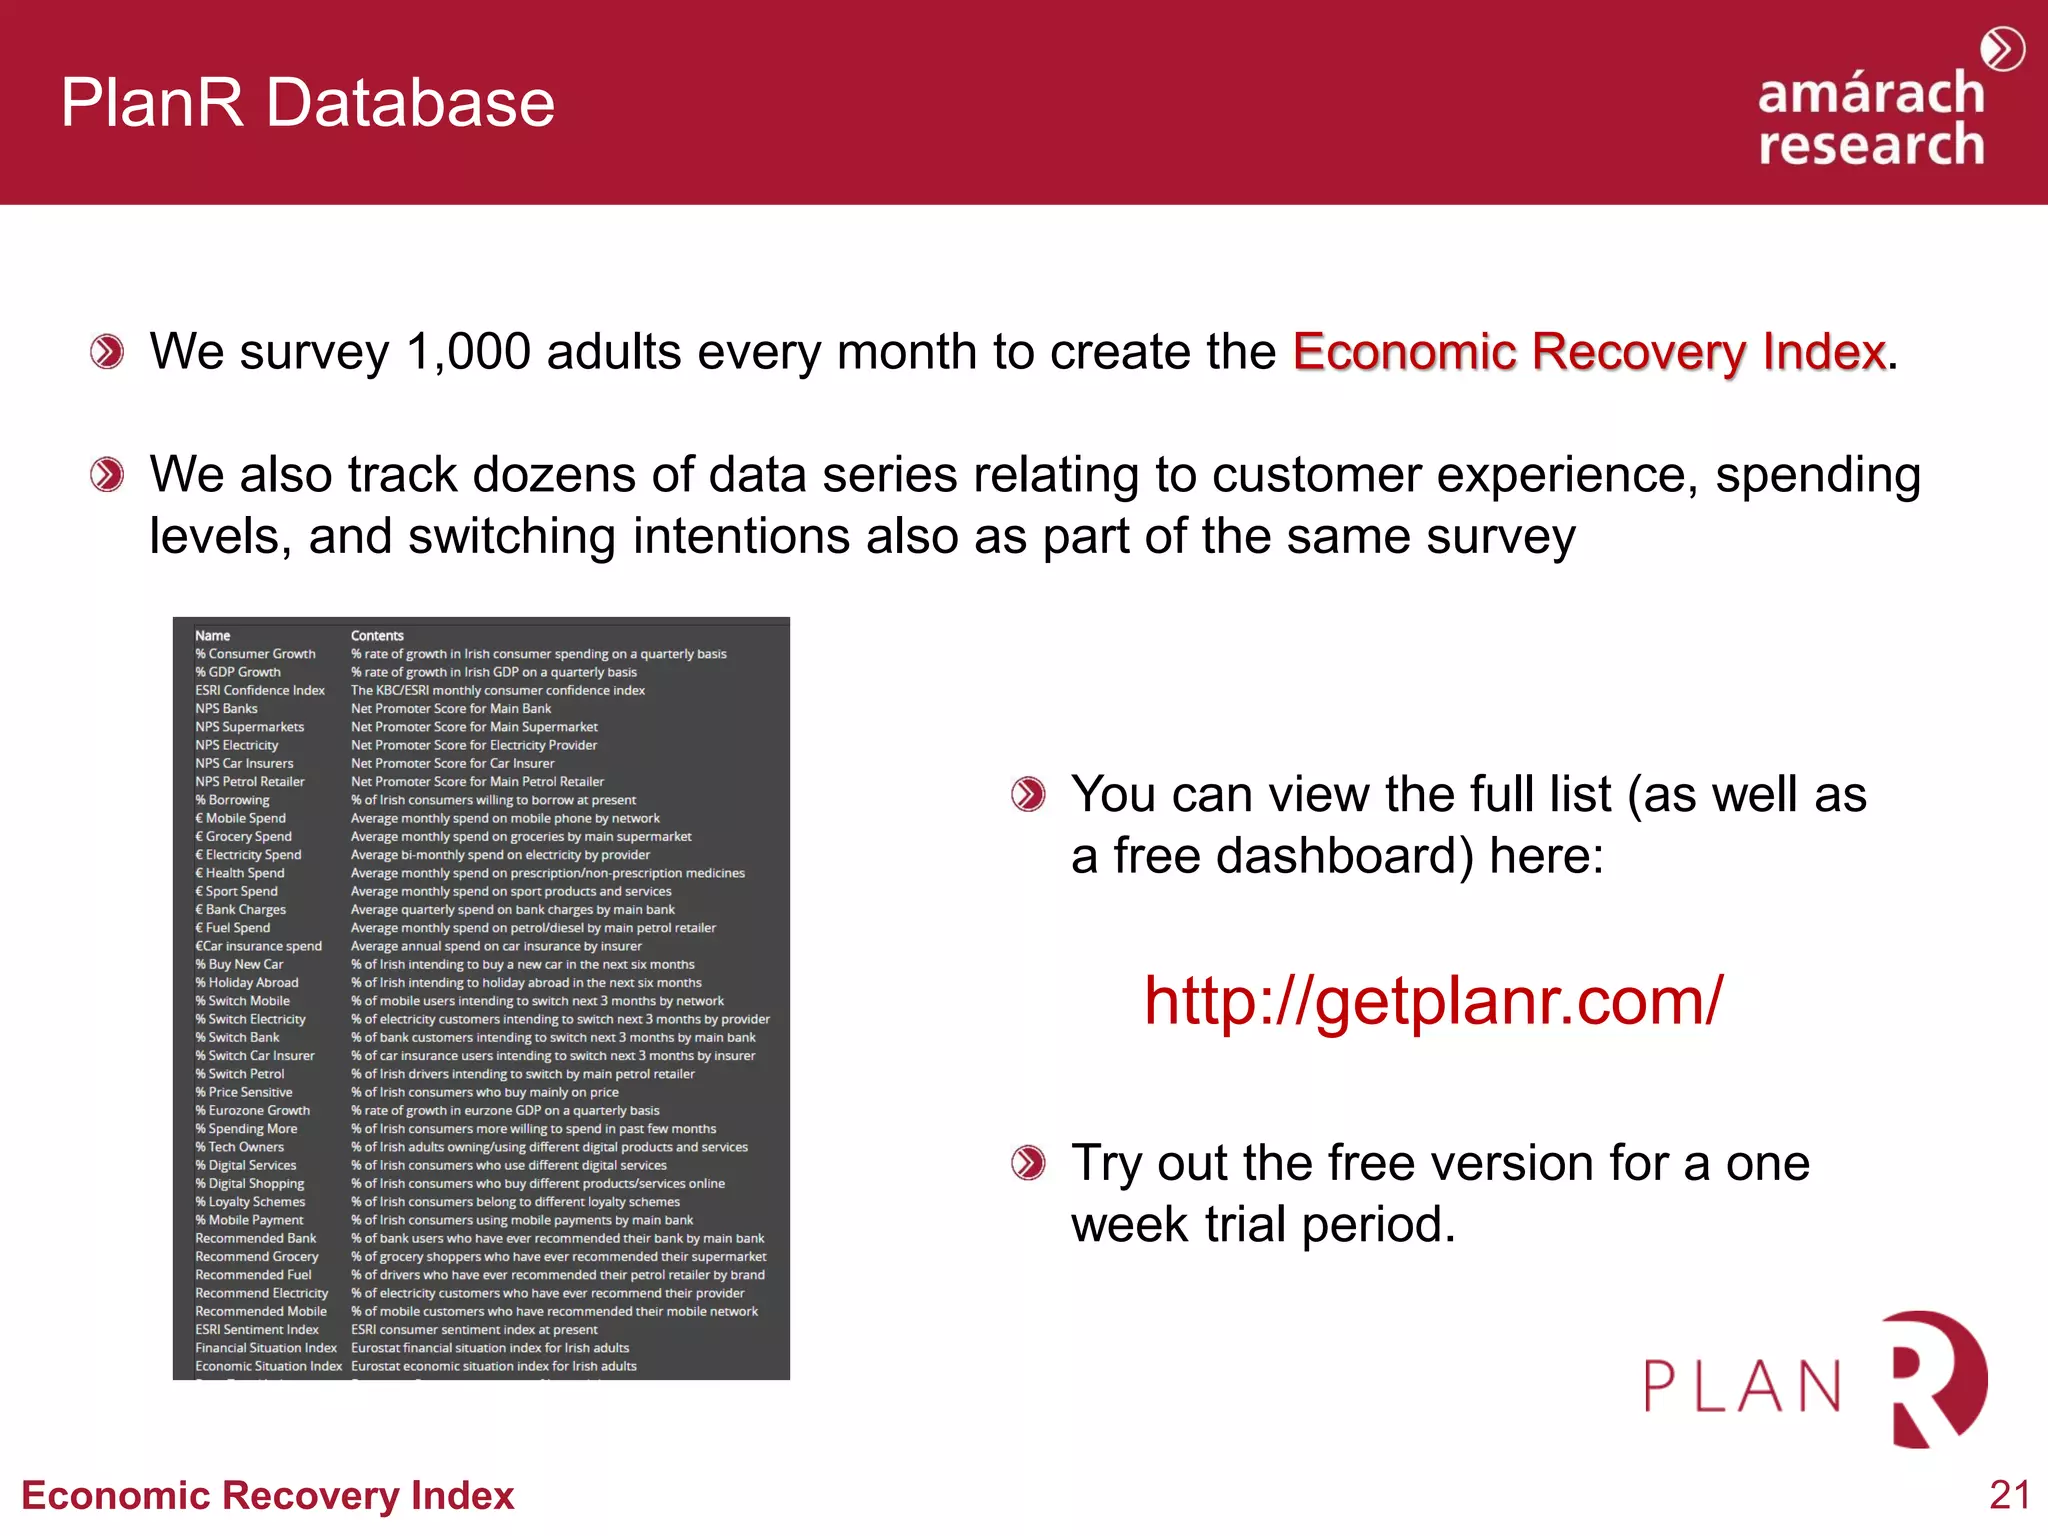
Download to read offline
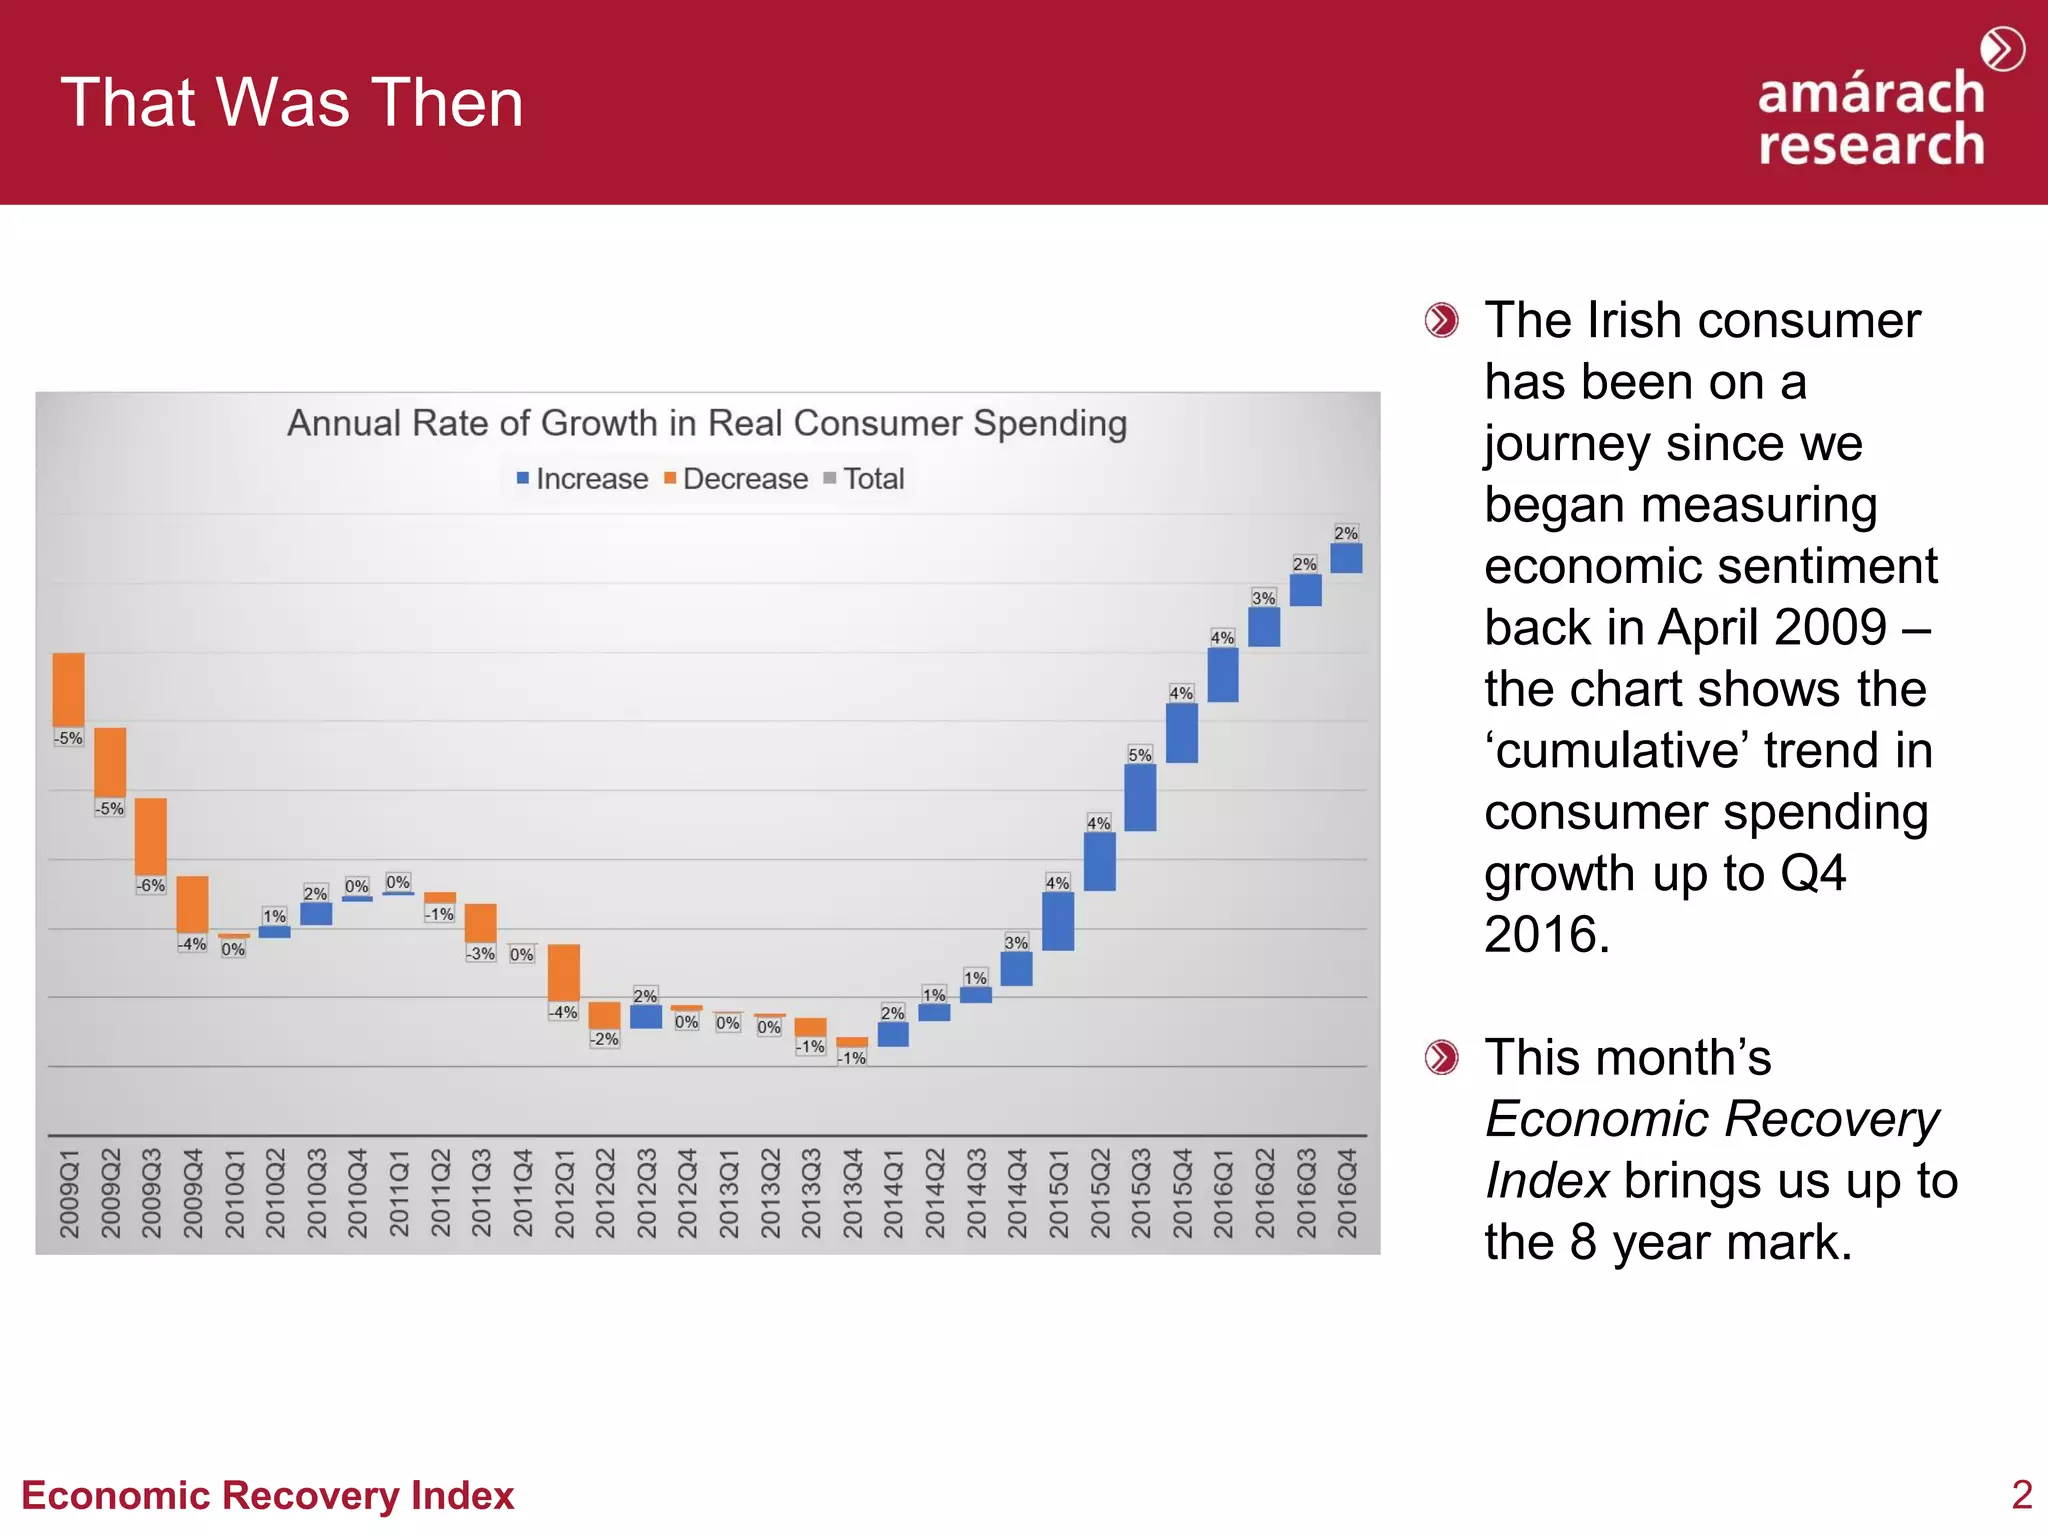
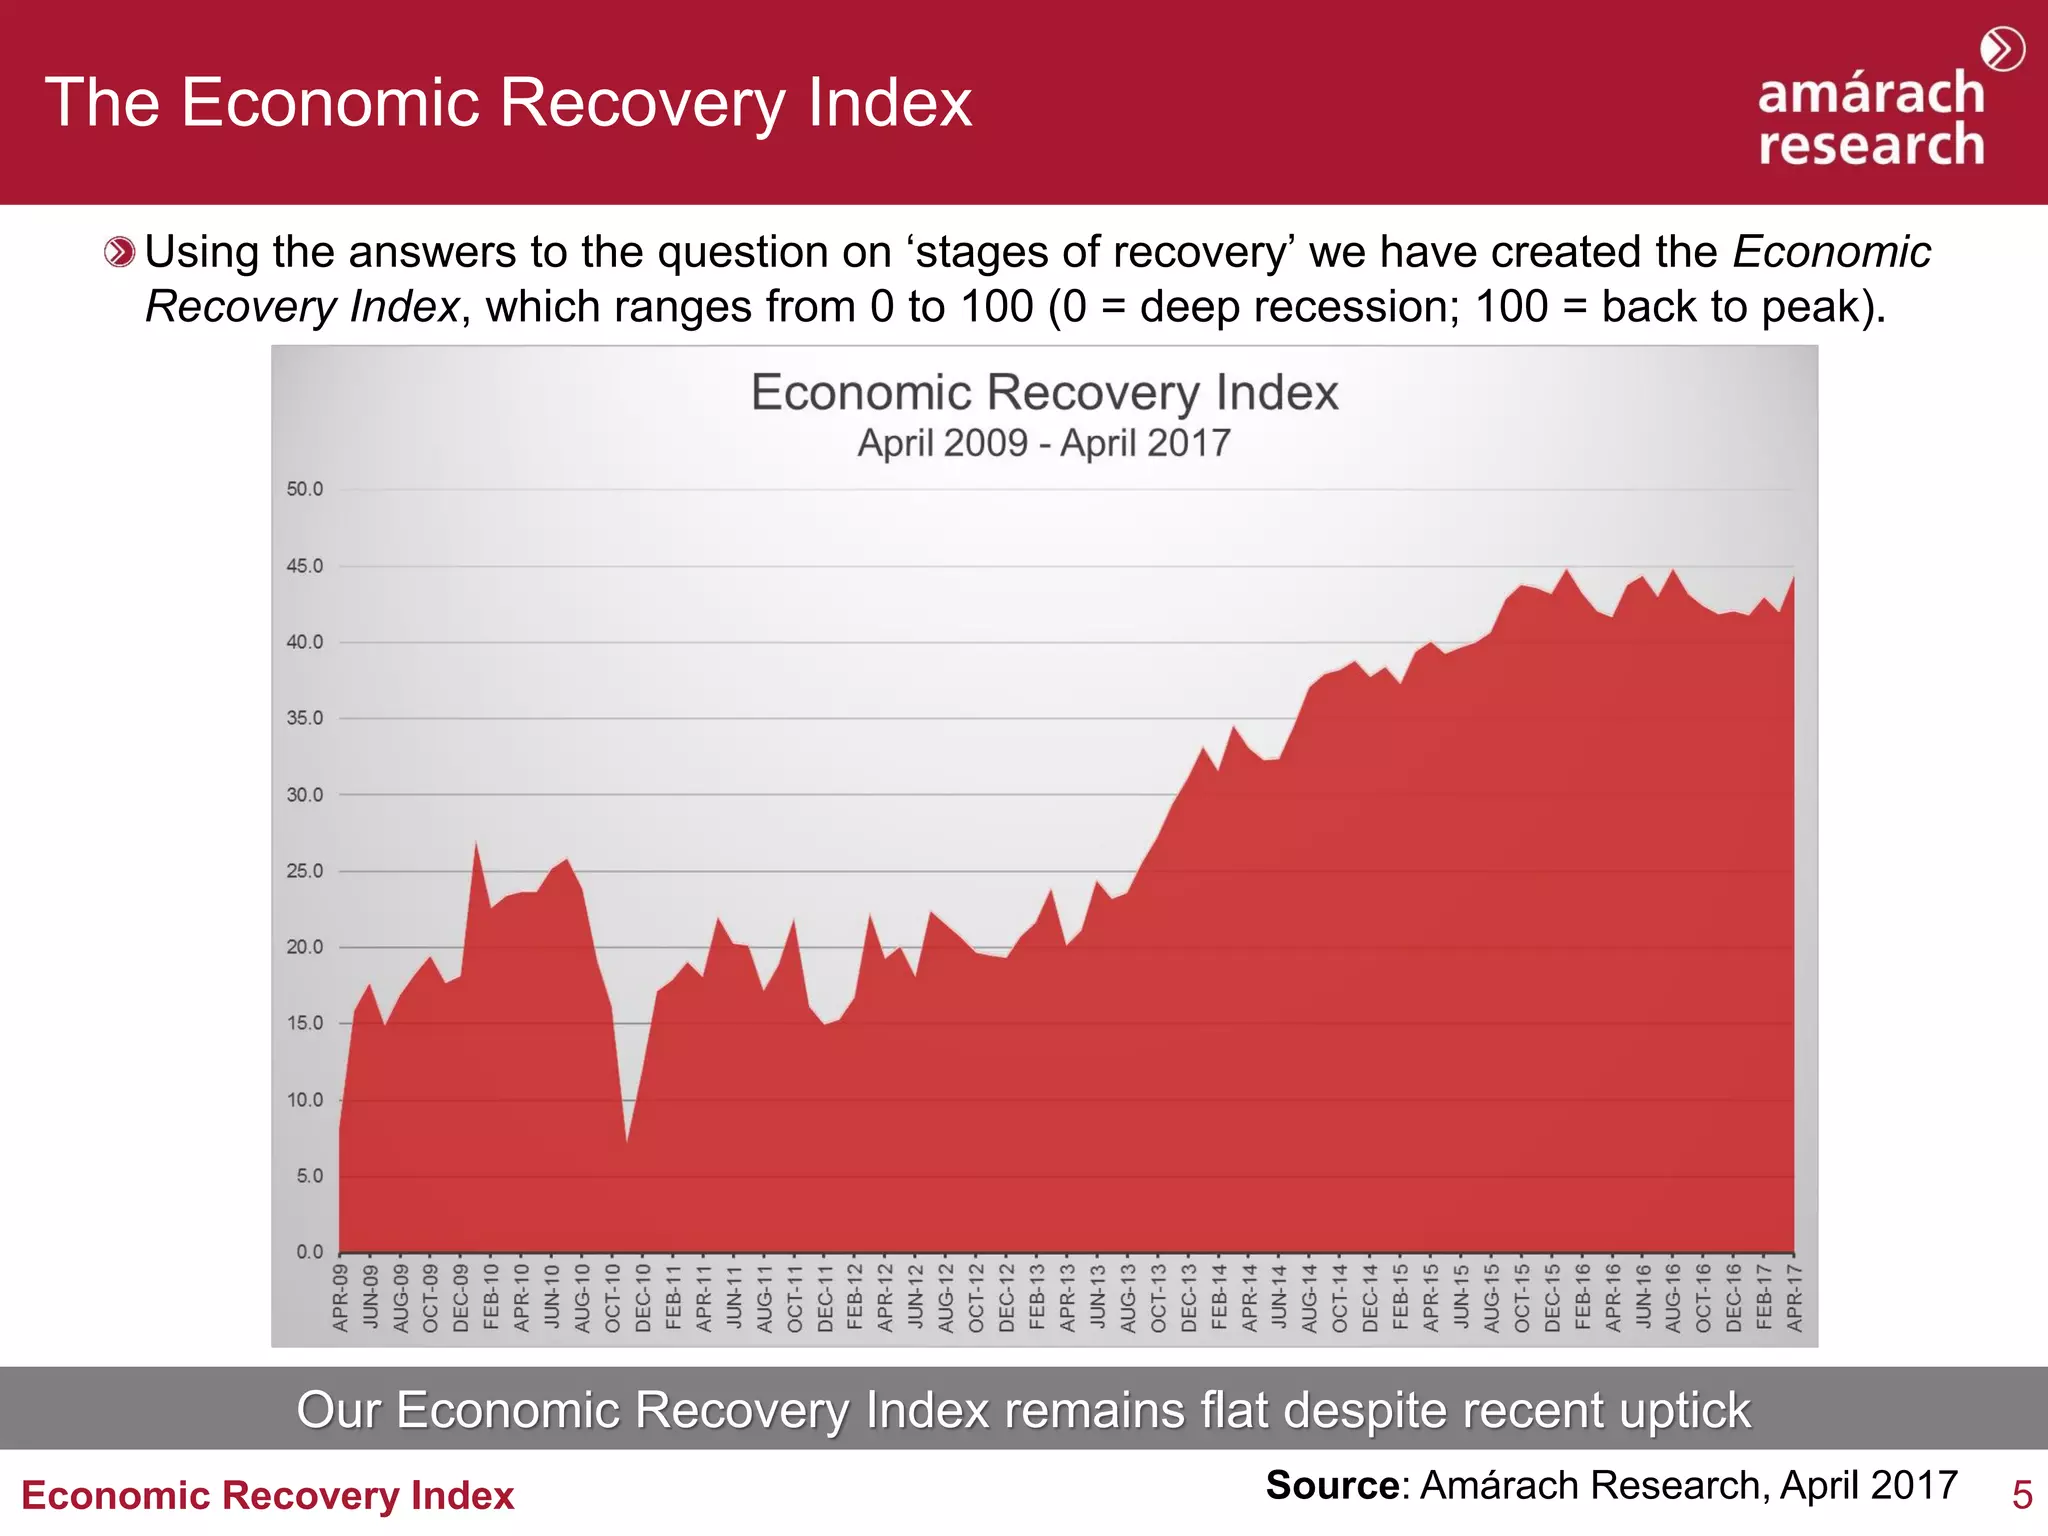
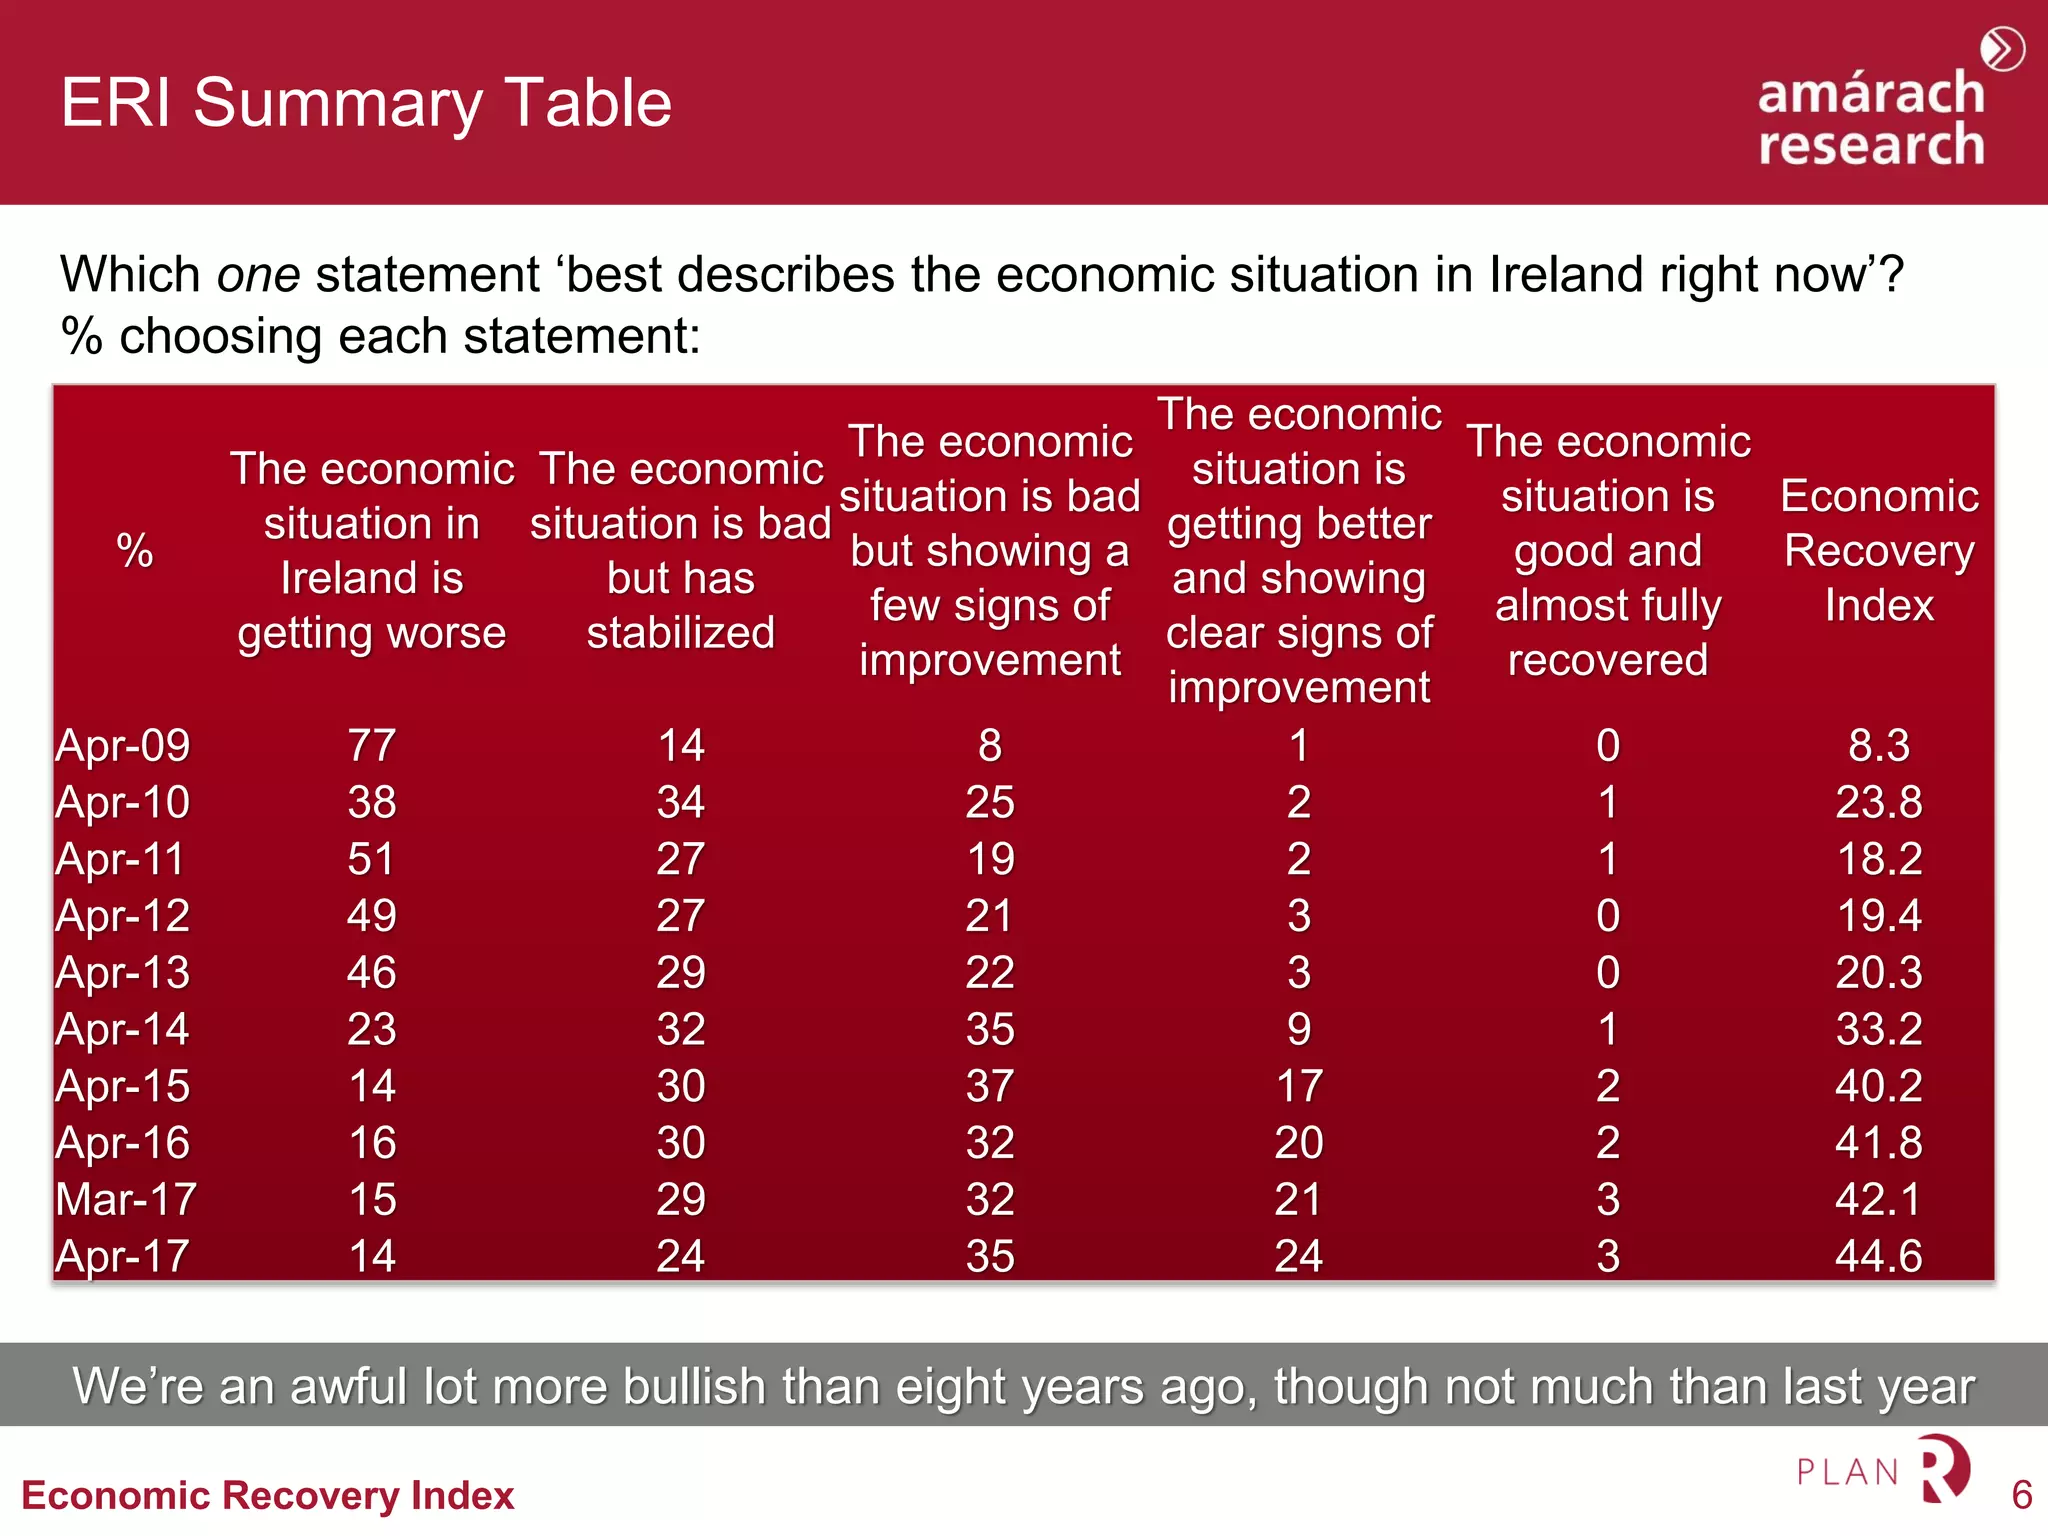
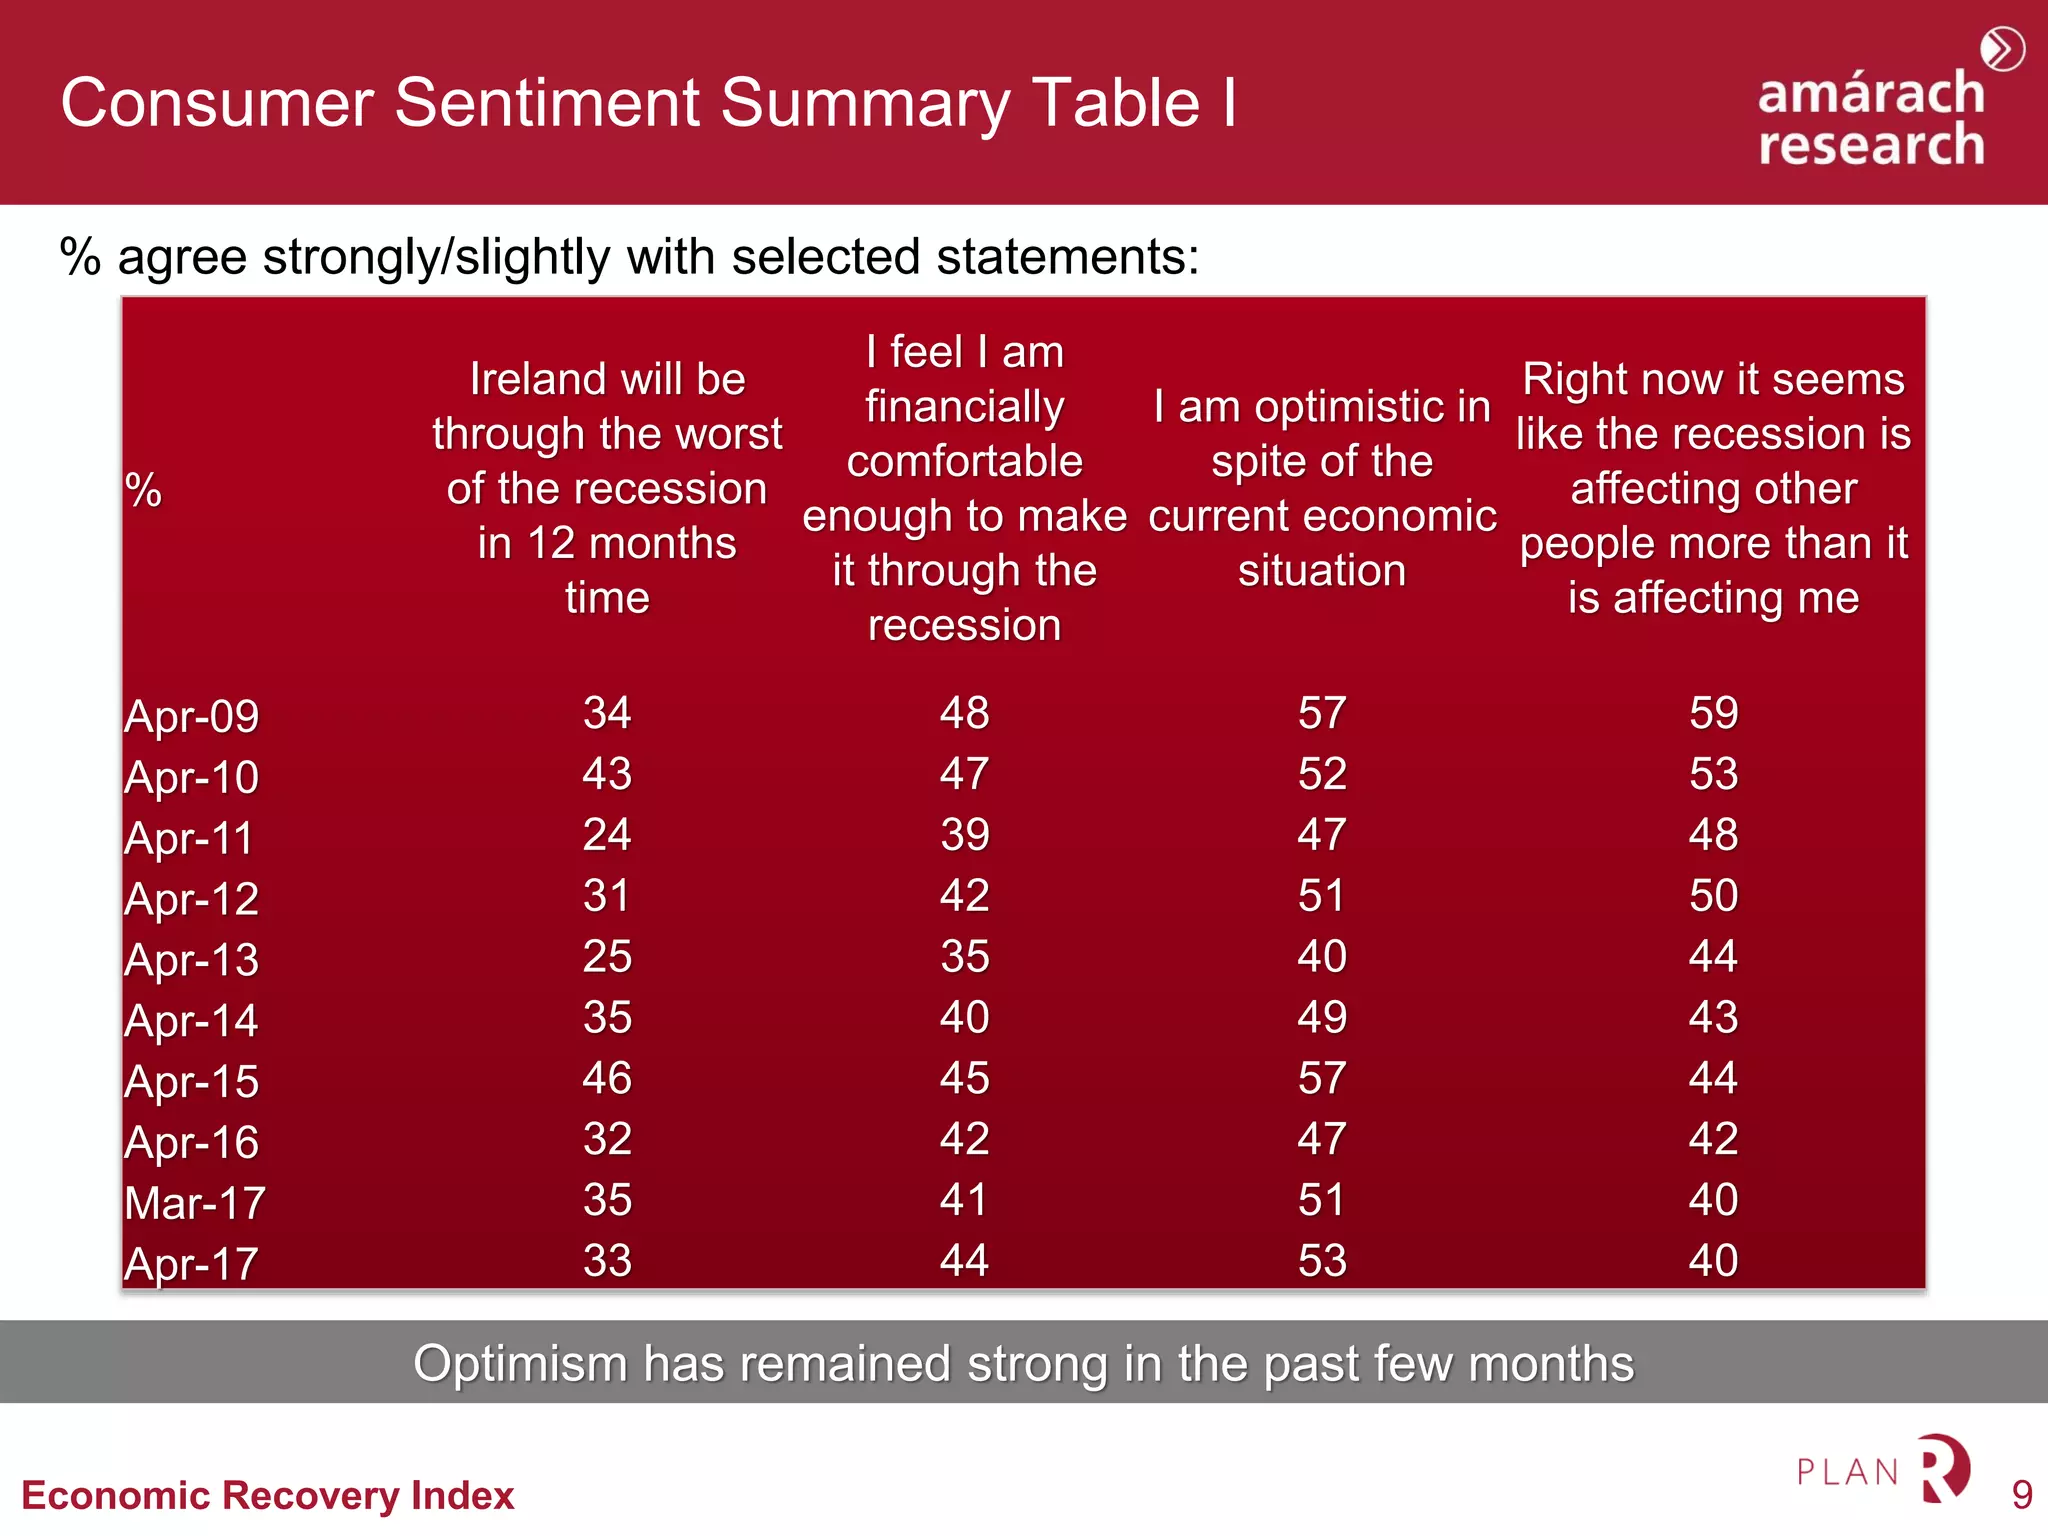
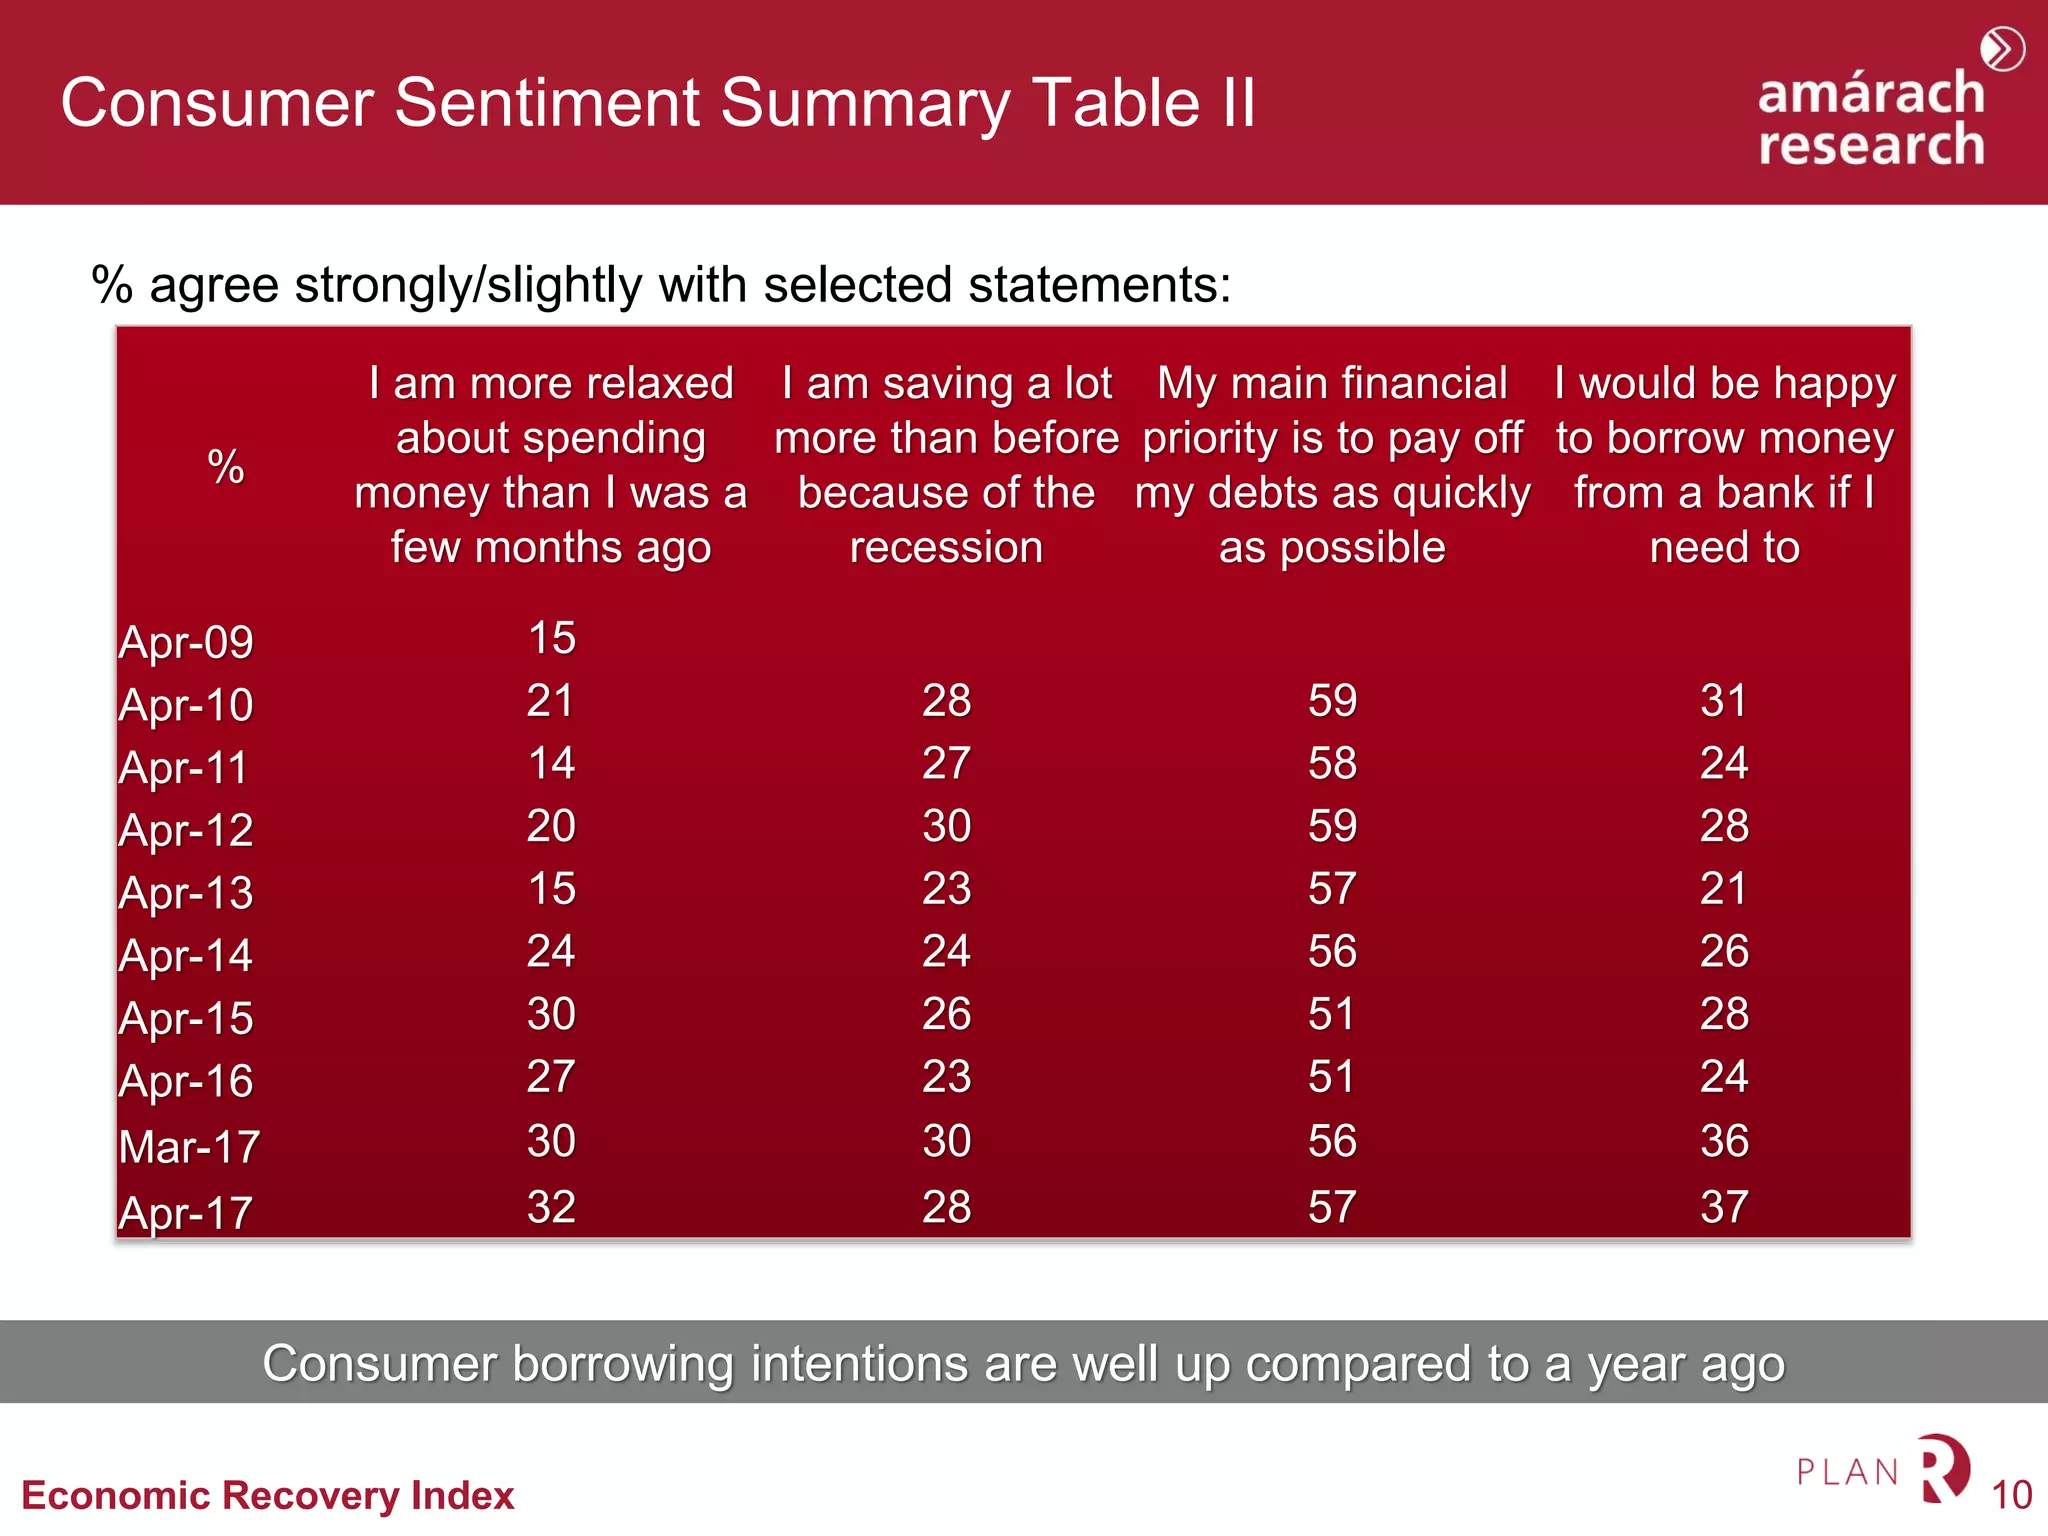
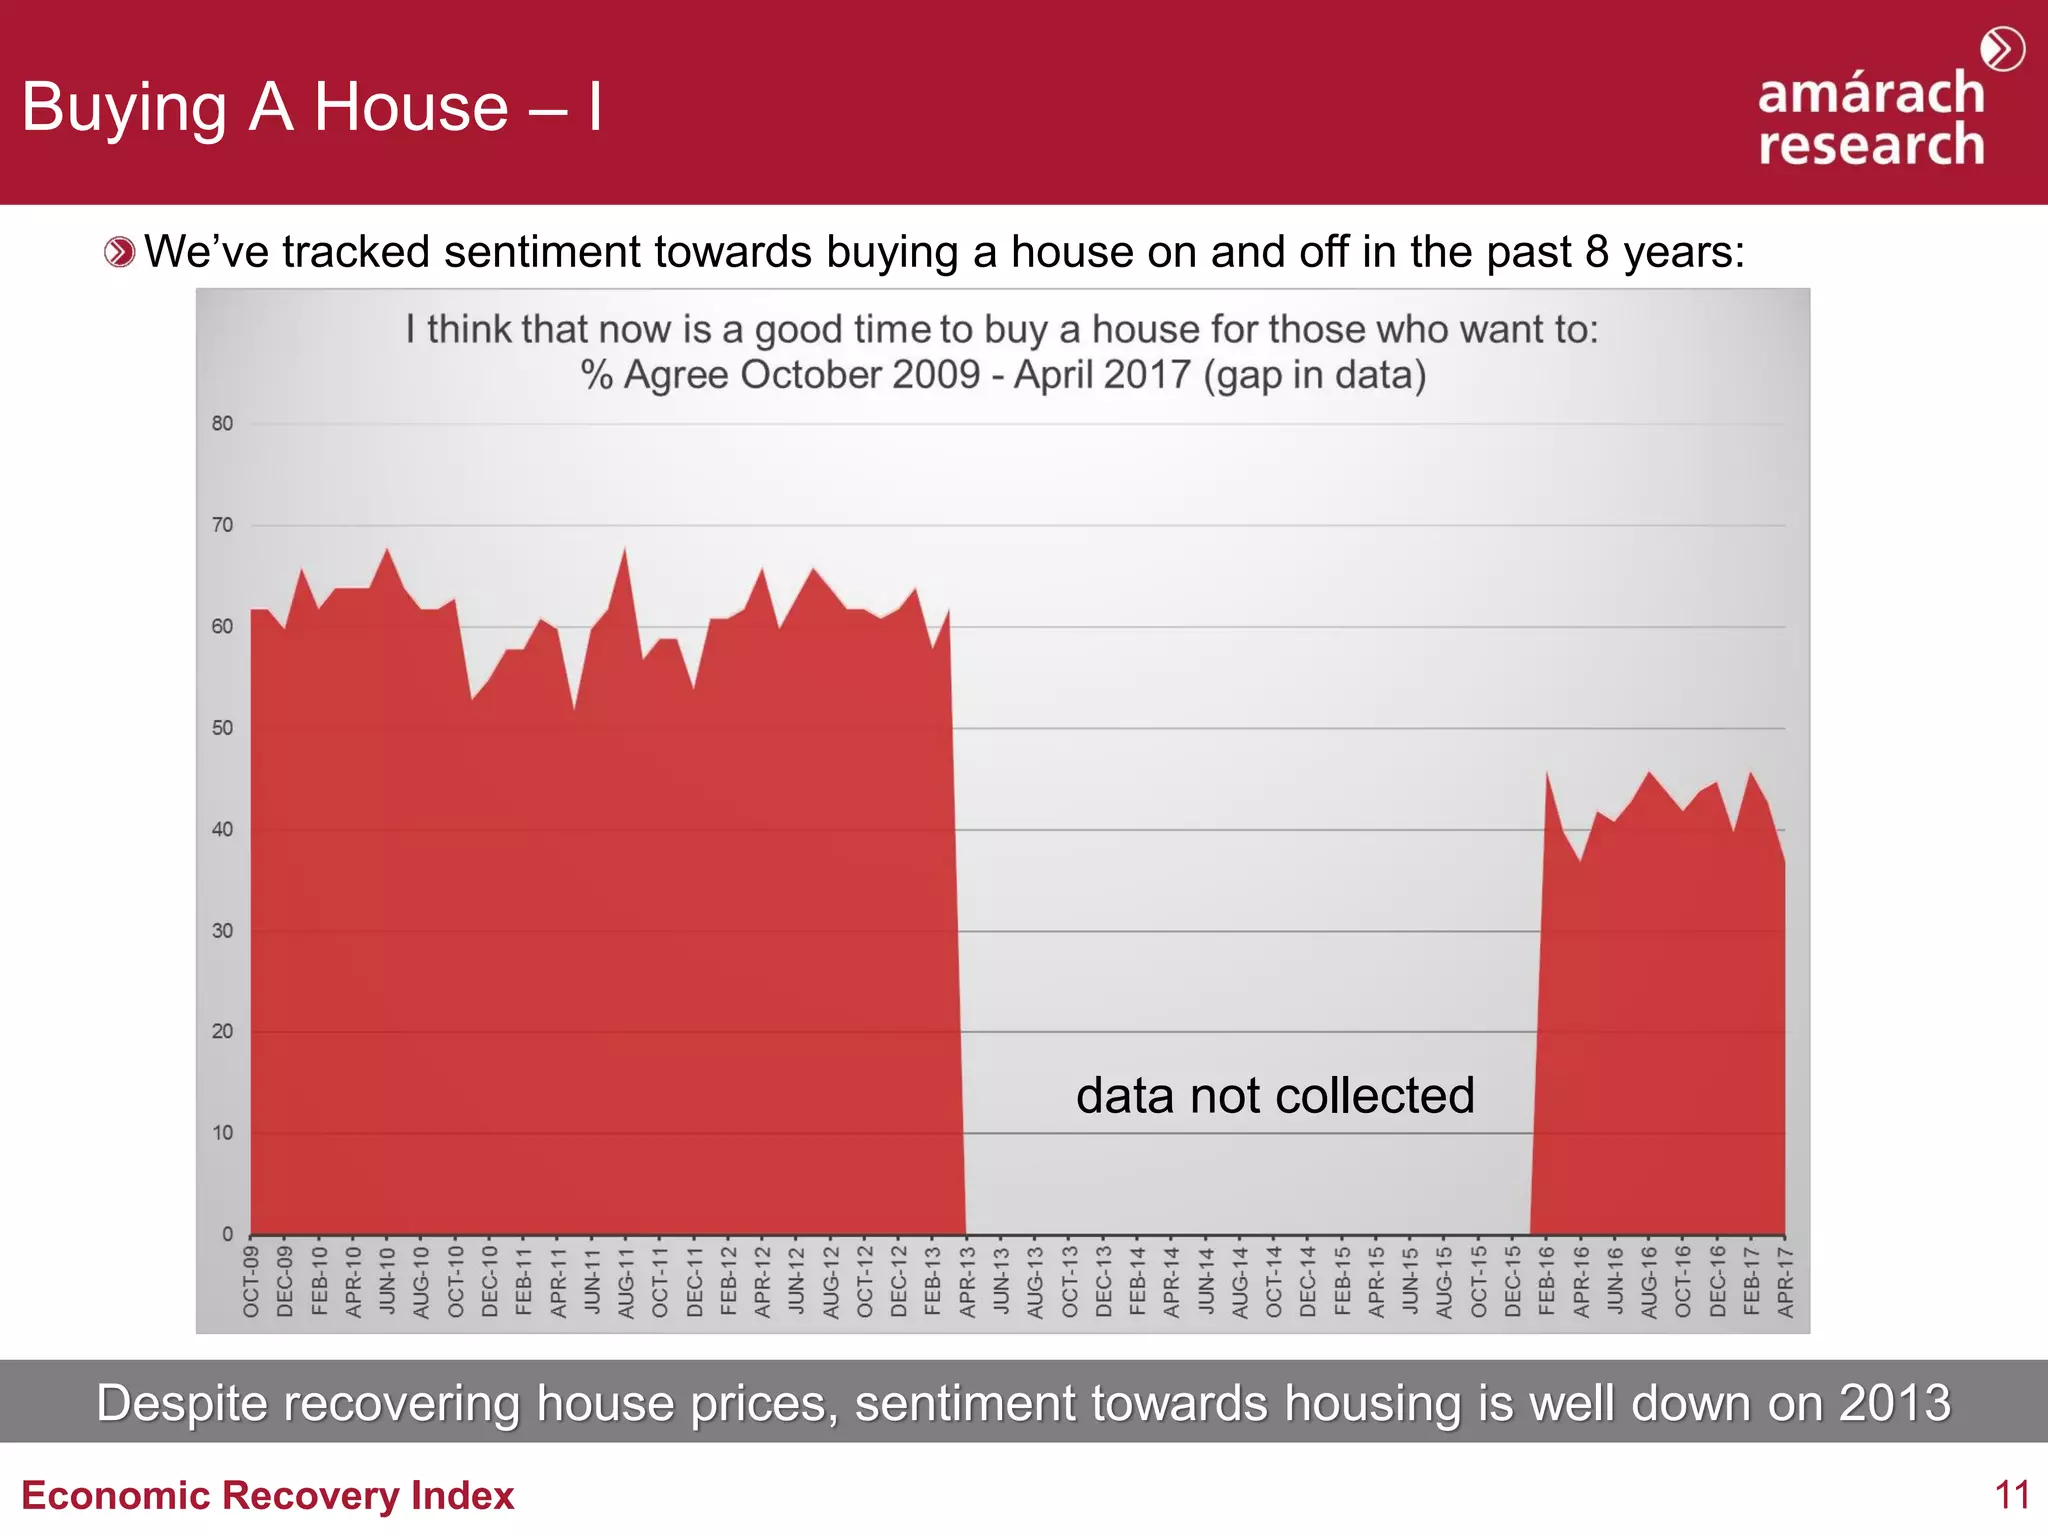
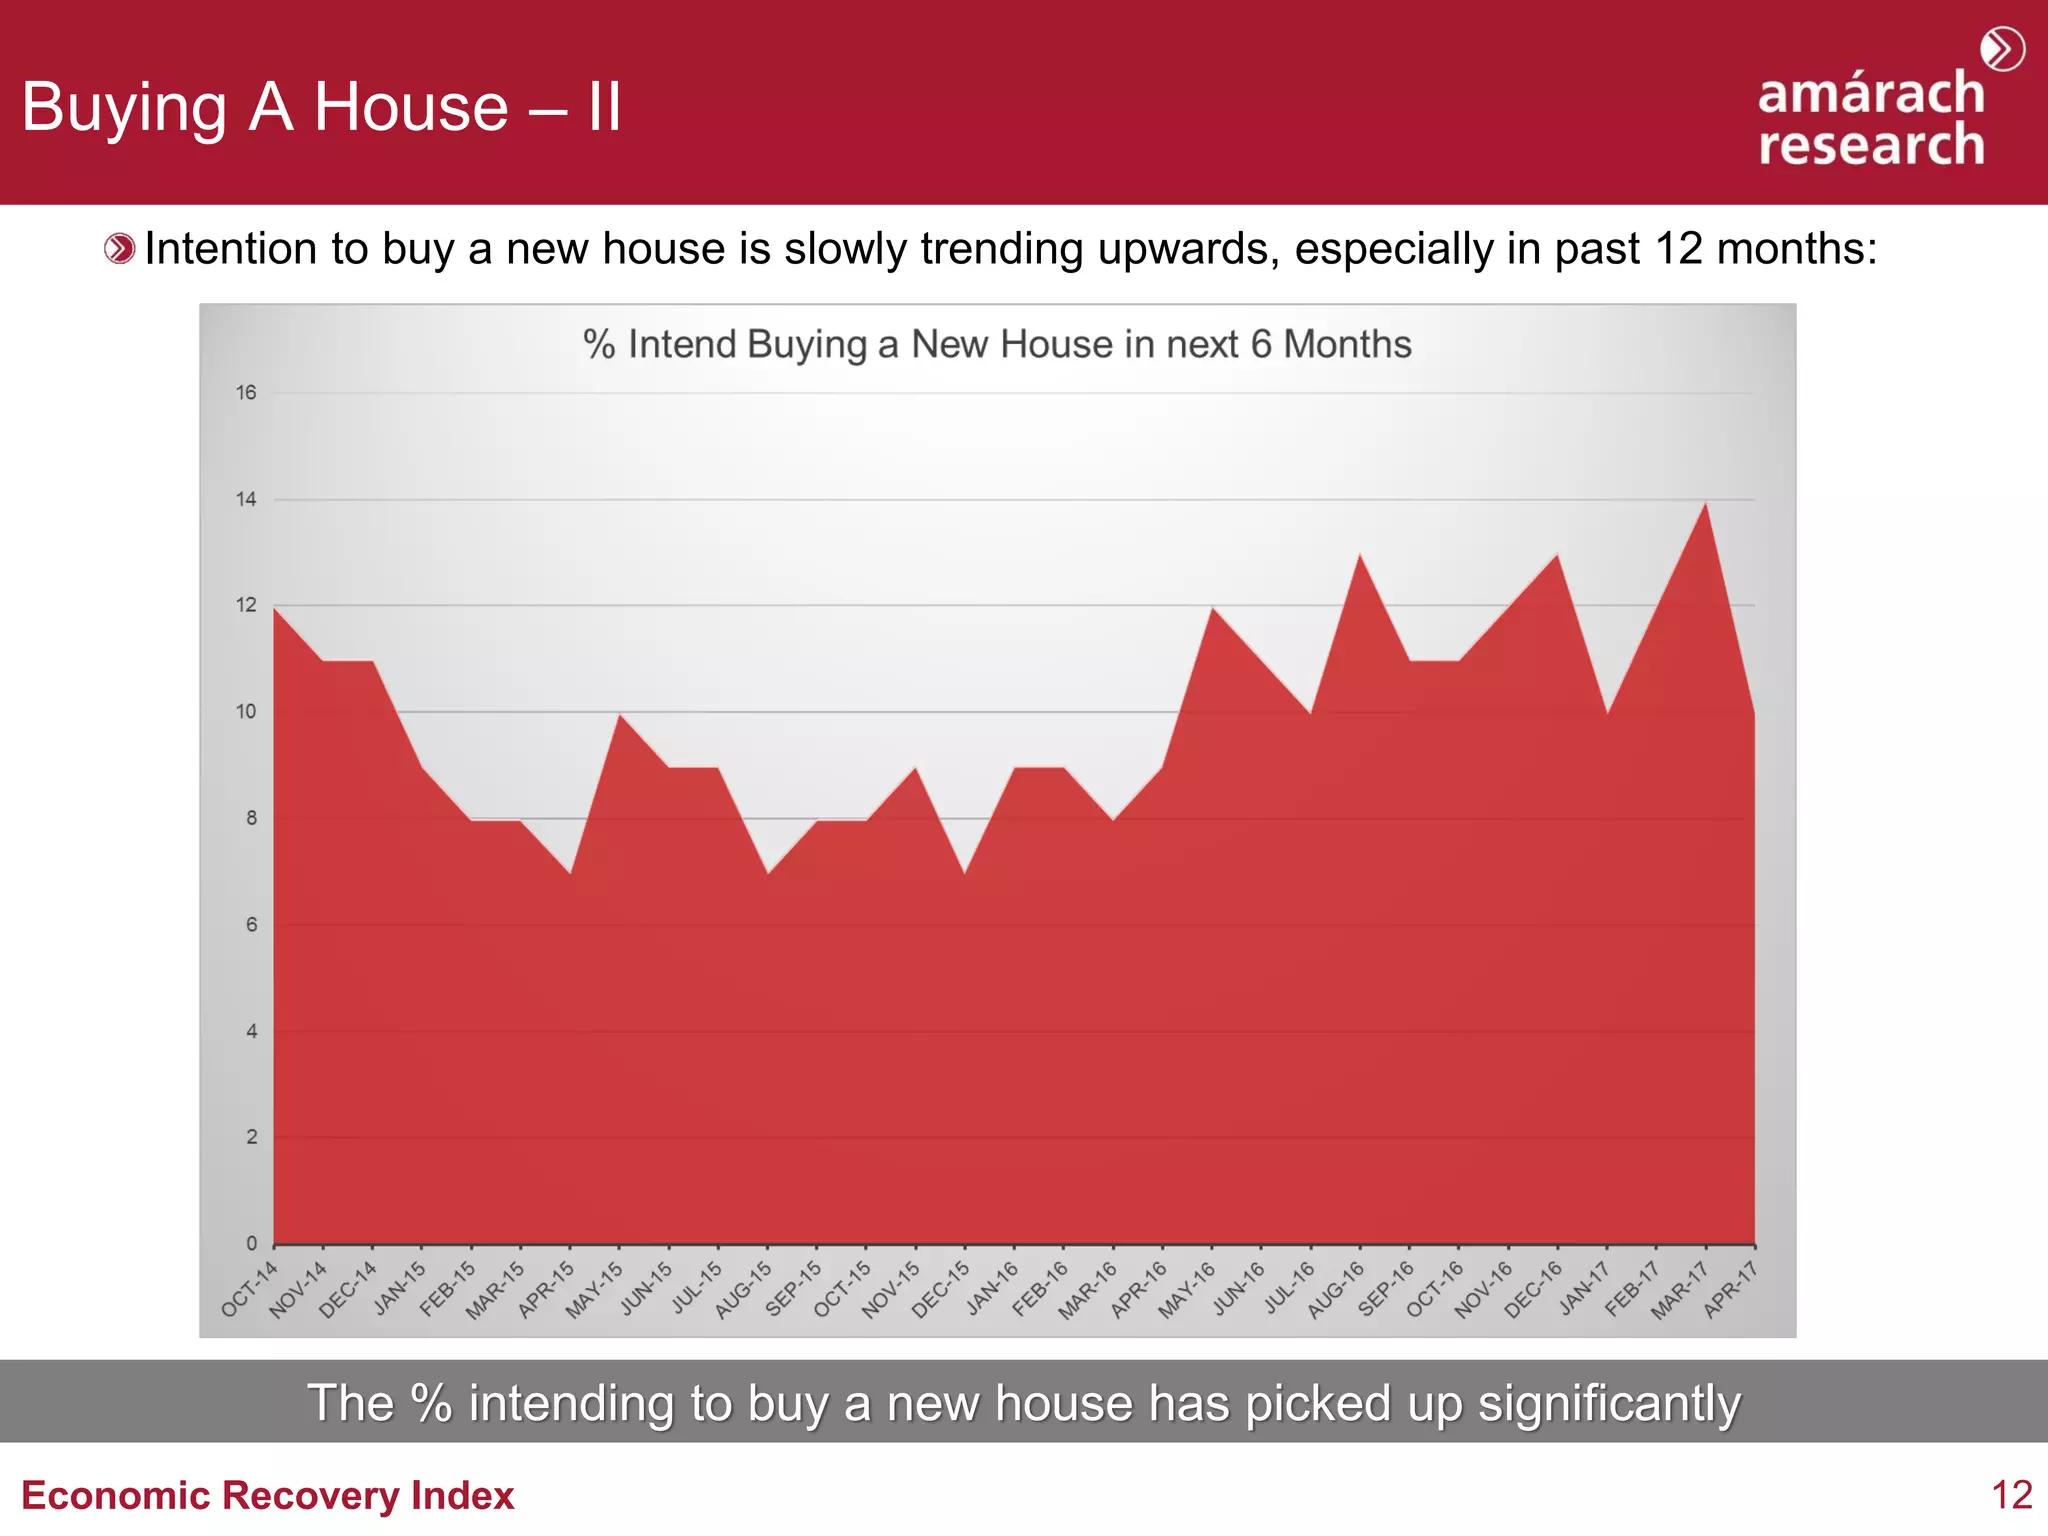
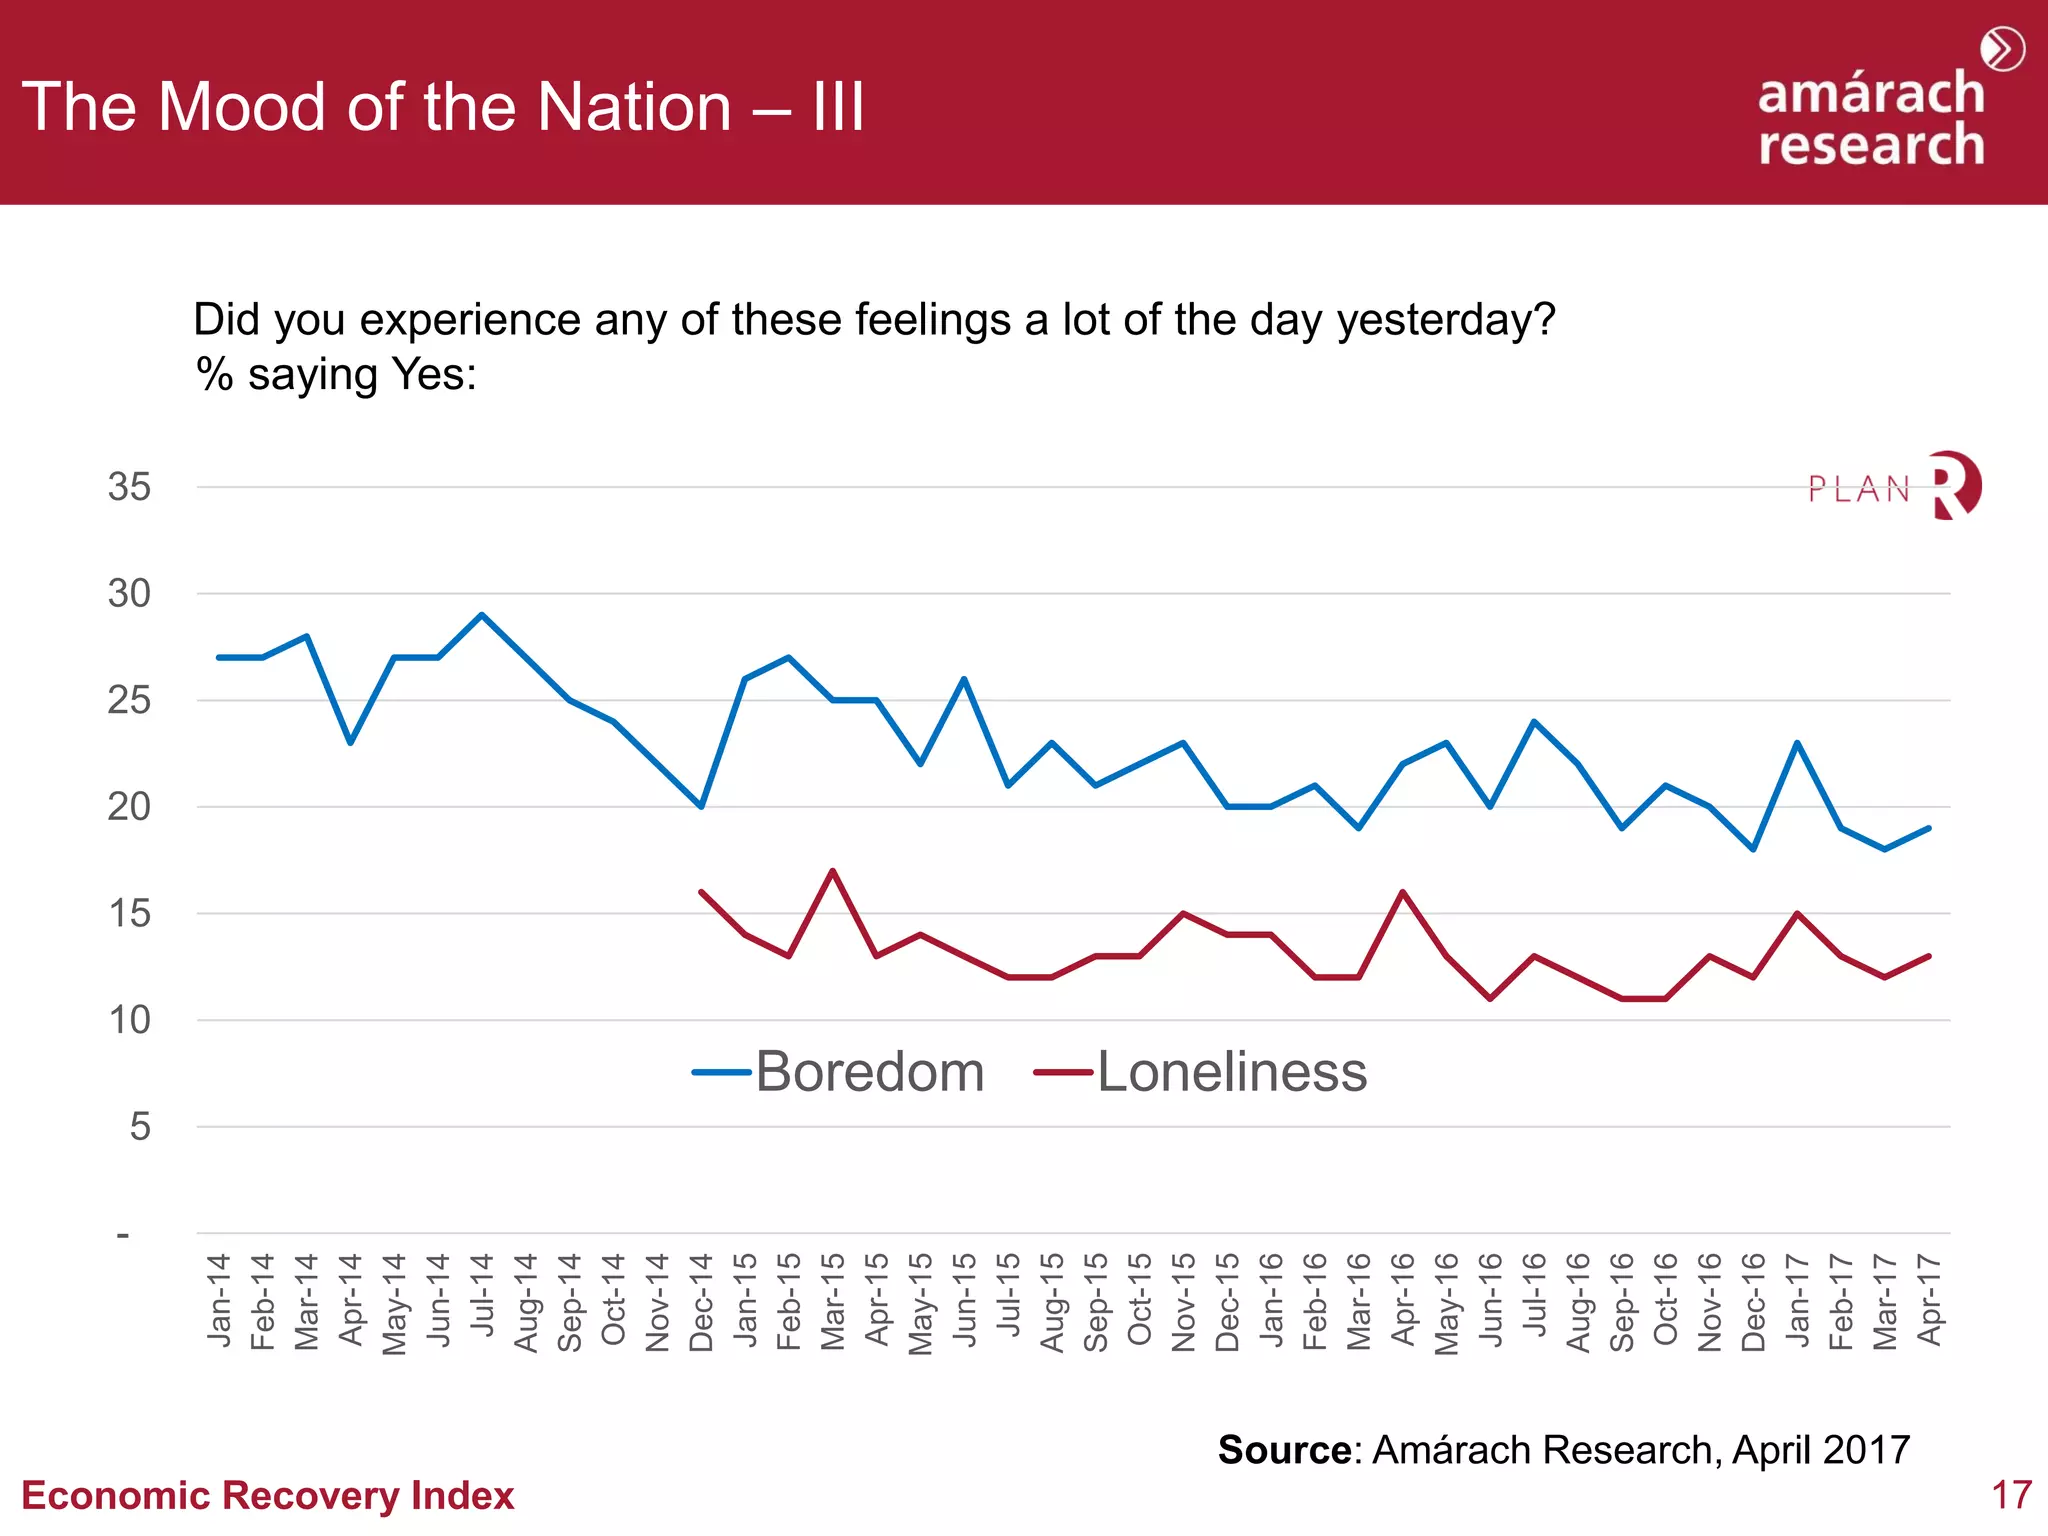
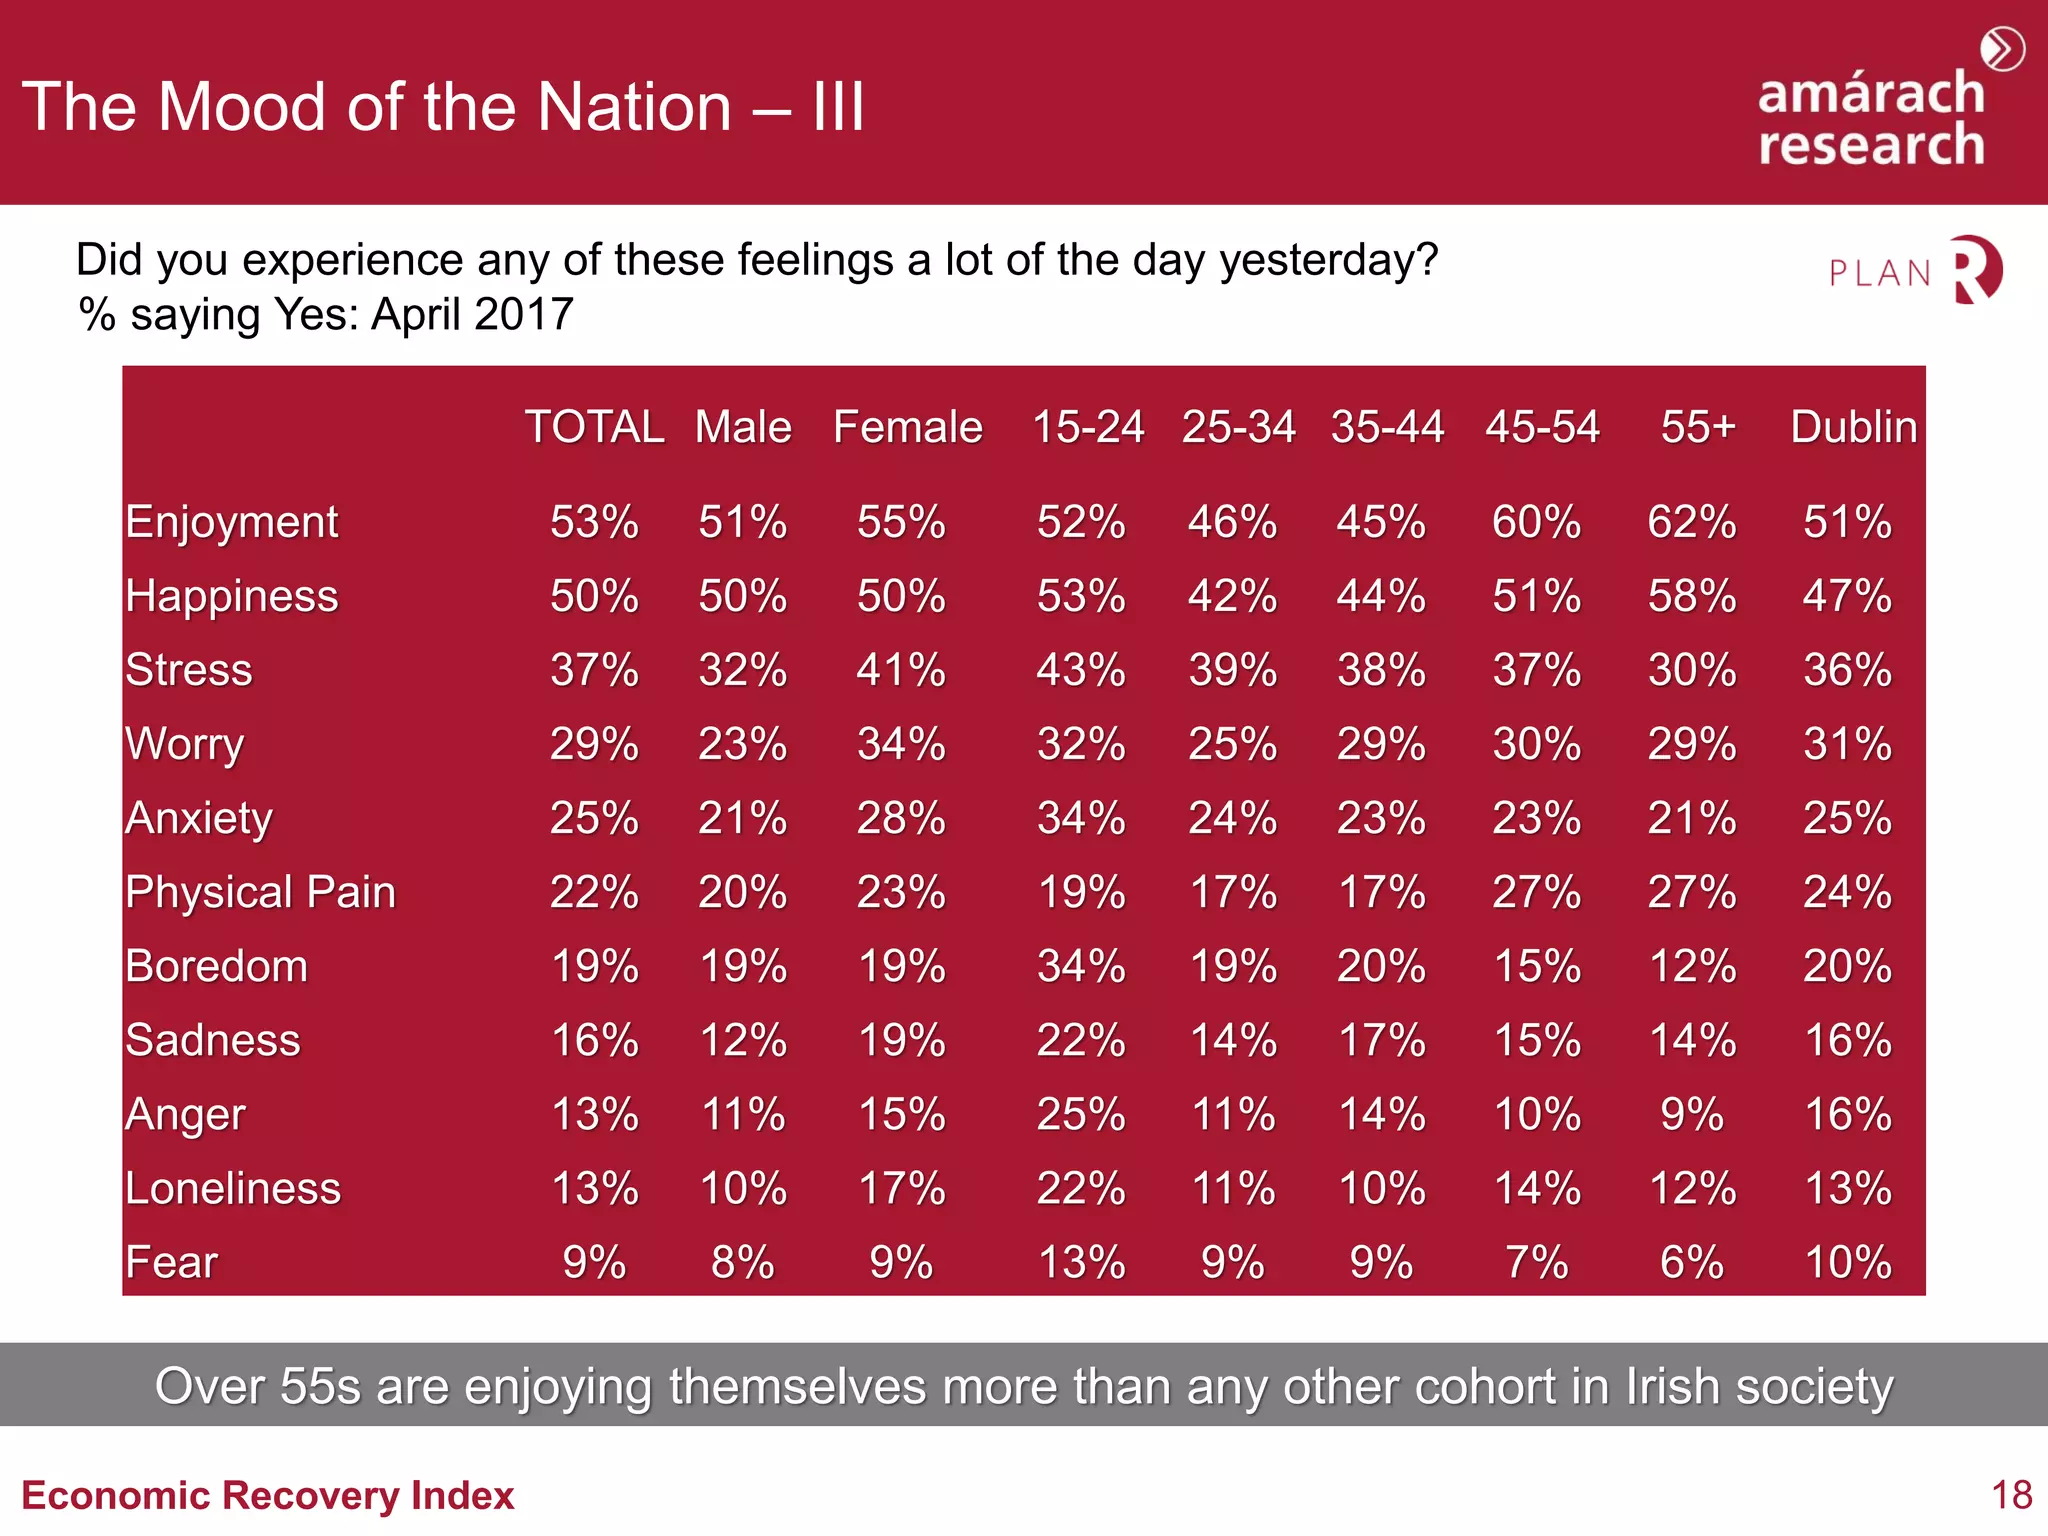

The Economic Recovery Index by Amárach Research tracks the psychological and economic recovery of Irish consumers from the recession over an eight-year period, ending in April 2017. The index remains flat despite some signs of improvement, with notable resilience shown by consumers regarding spending and savings compared to the past. Overall, consumer sentiment reflects a cautiously optimistic outlook, with variations in emotional well-being observed among different demographics.


