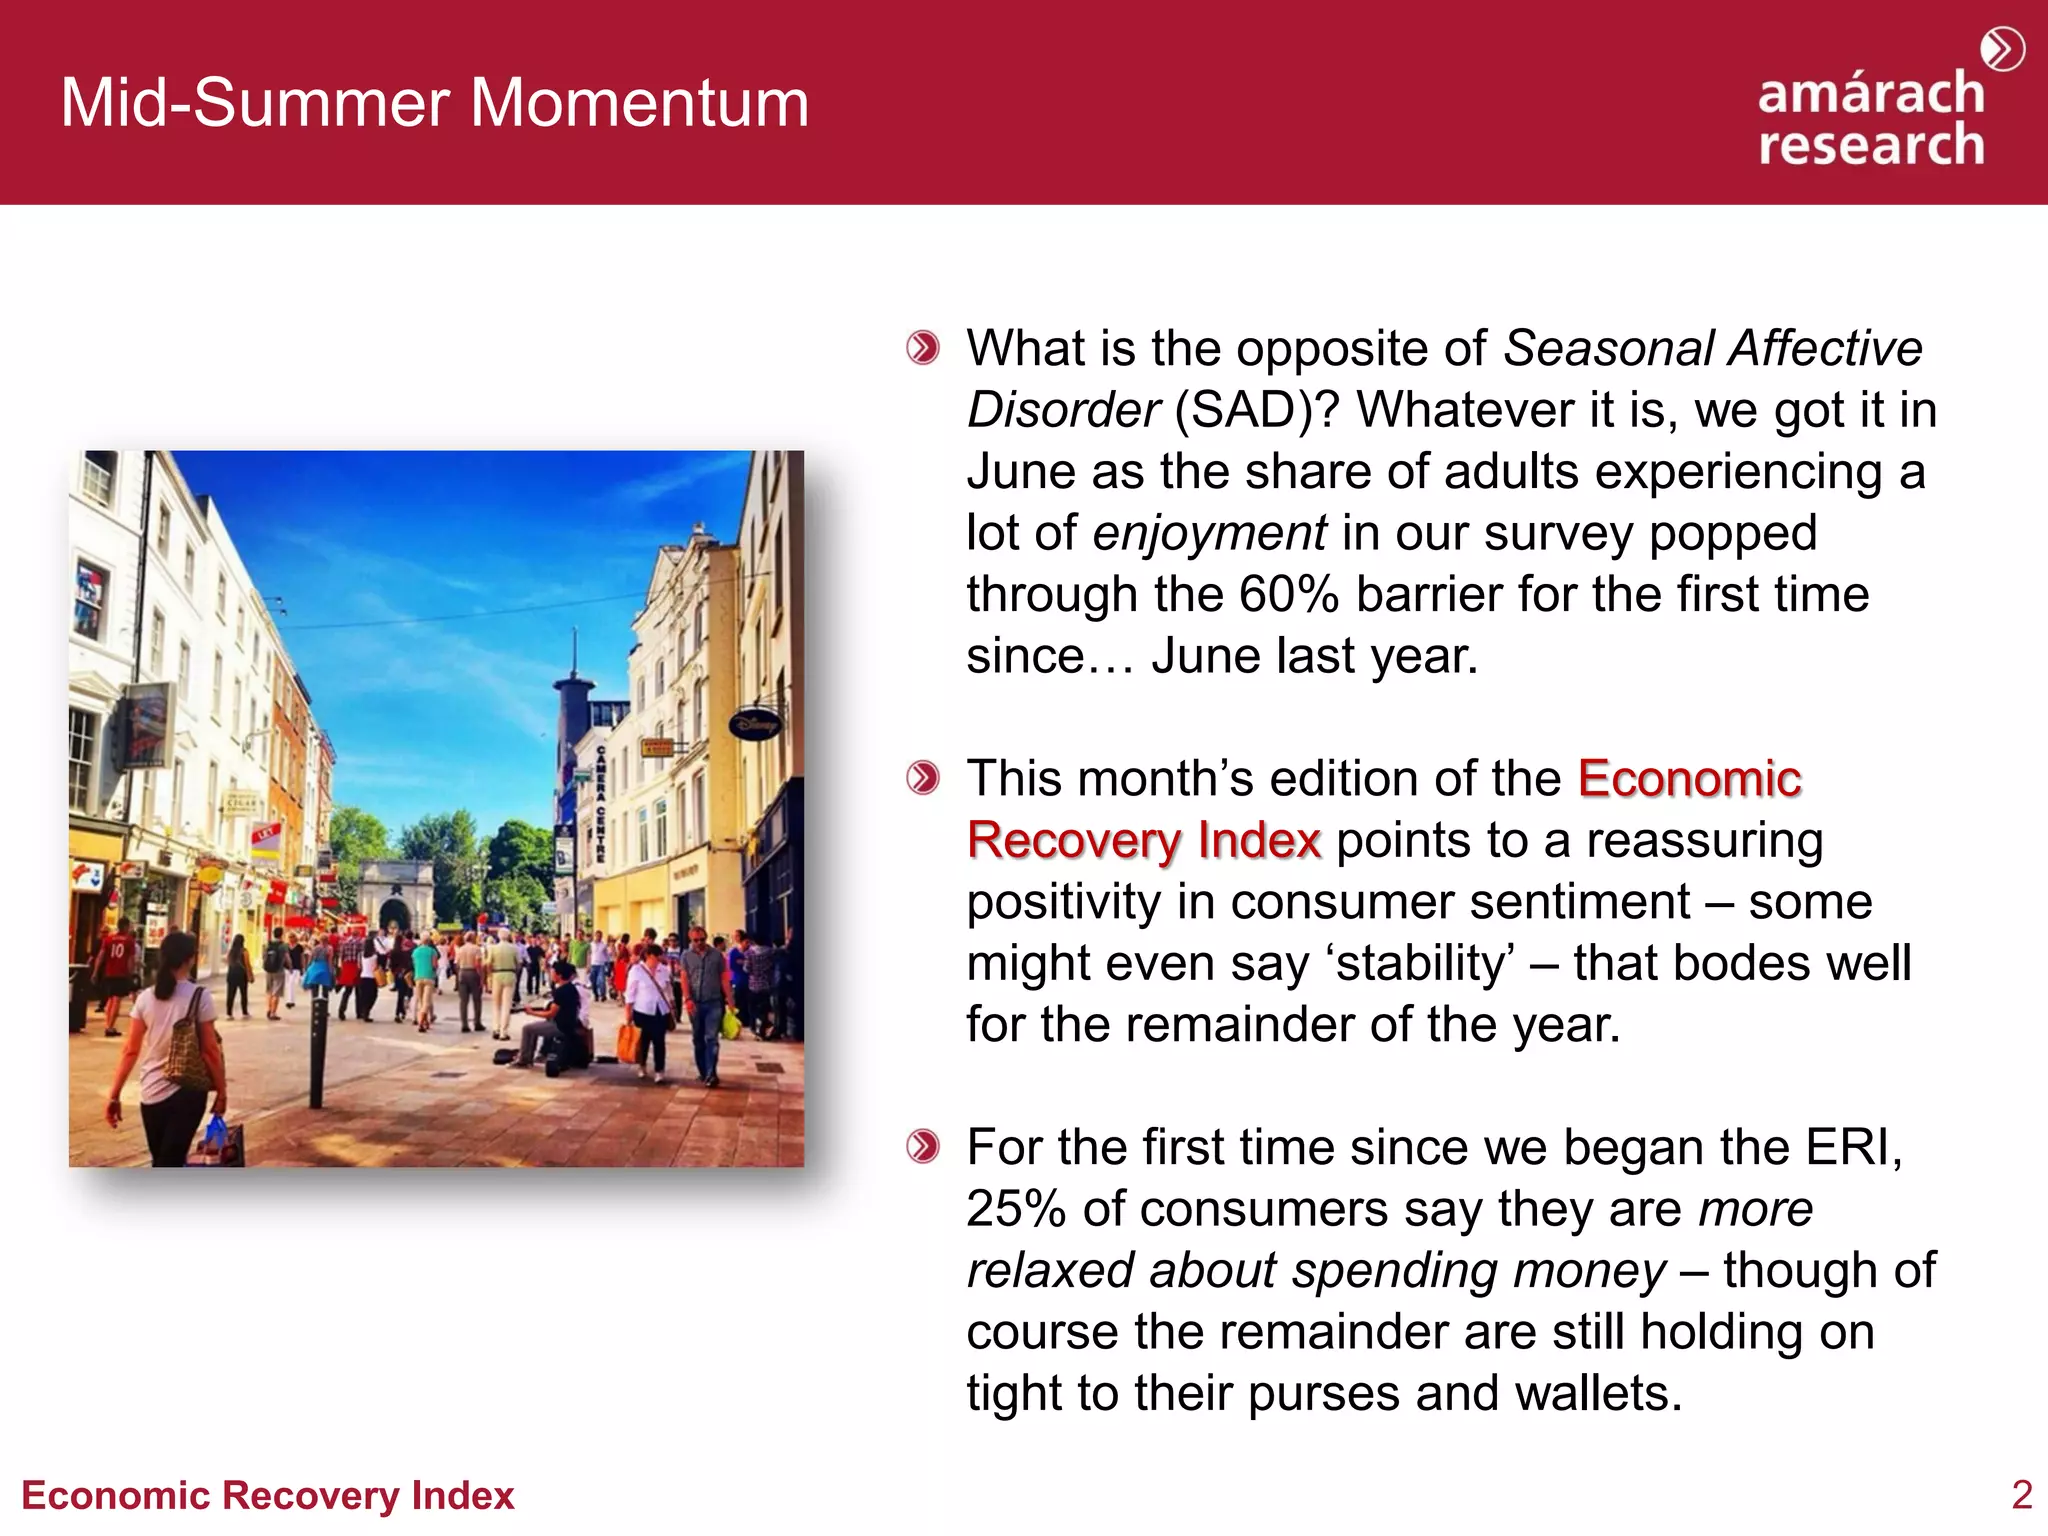
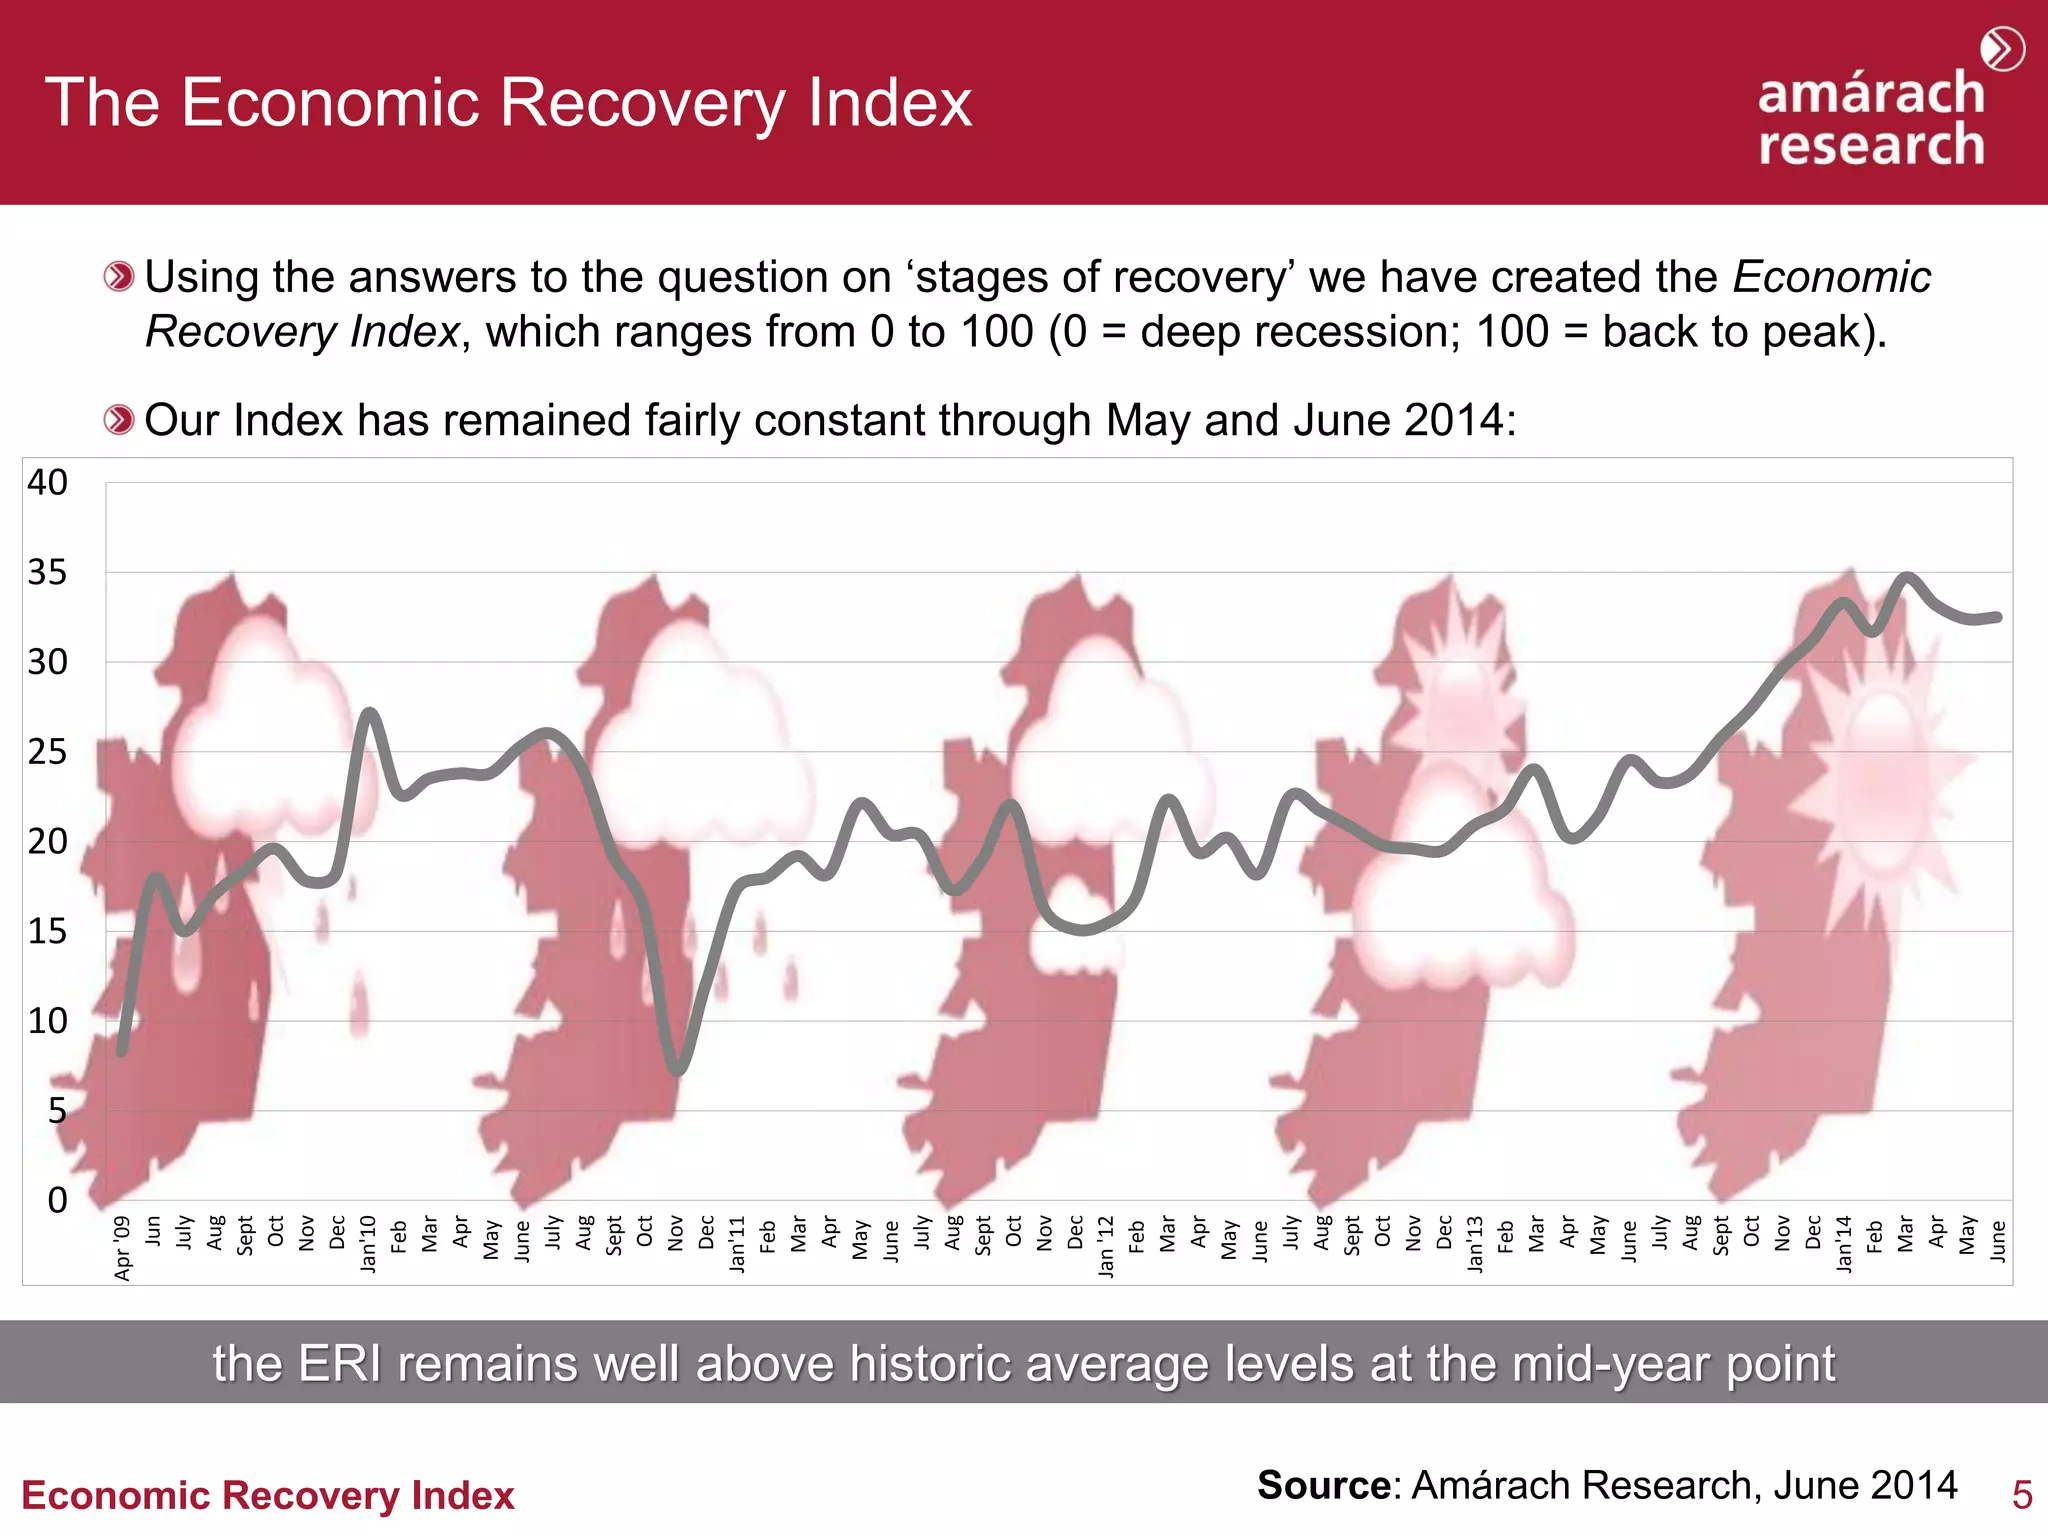
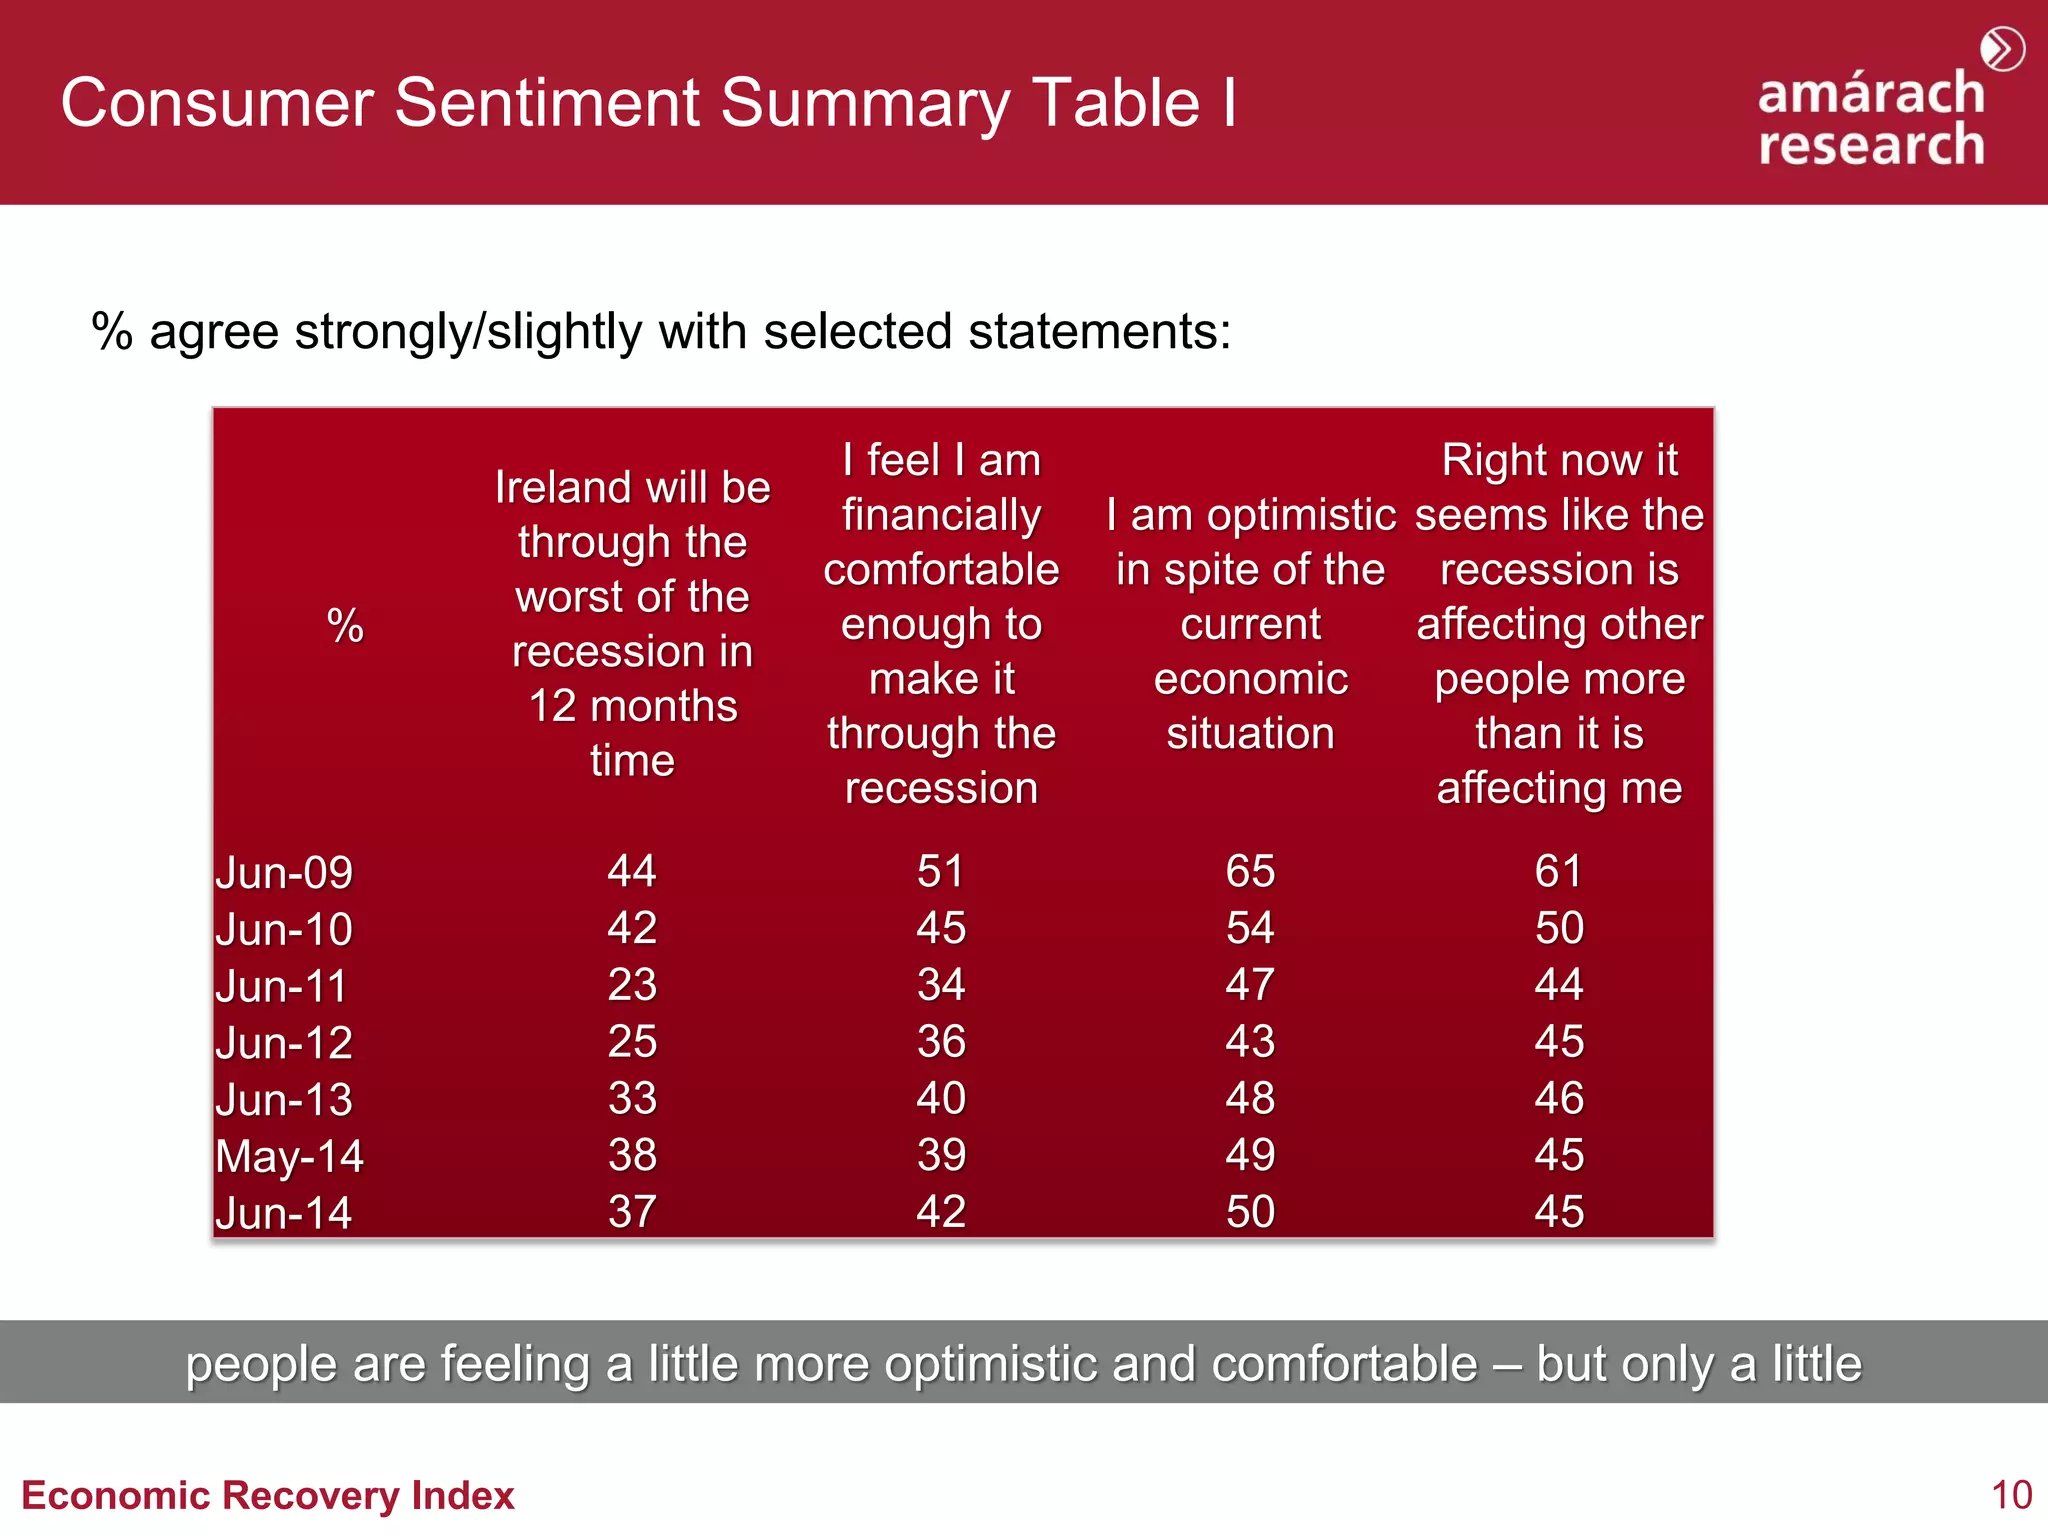
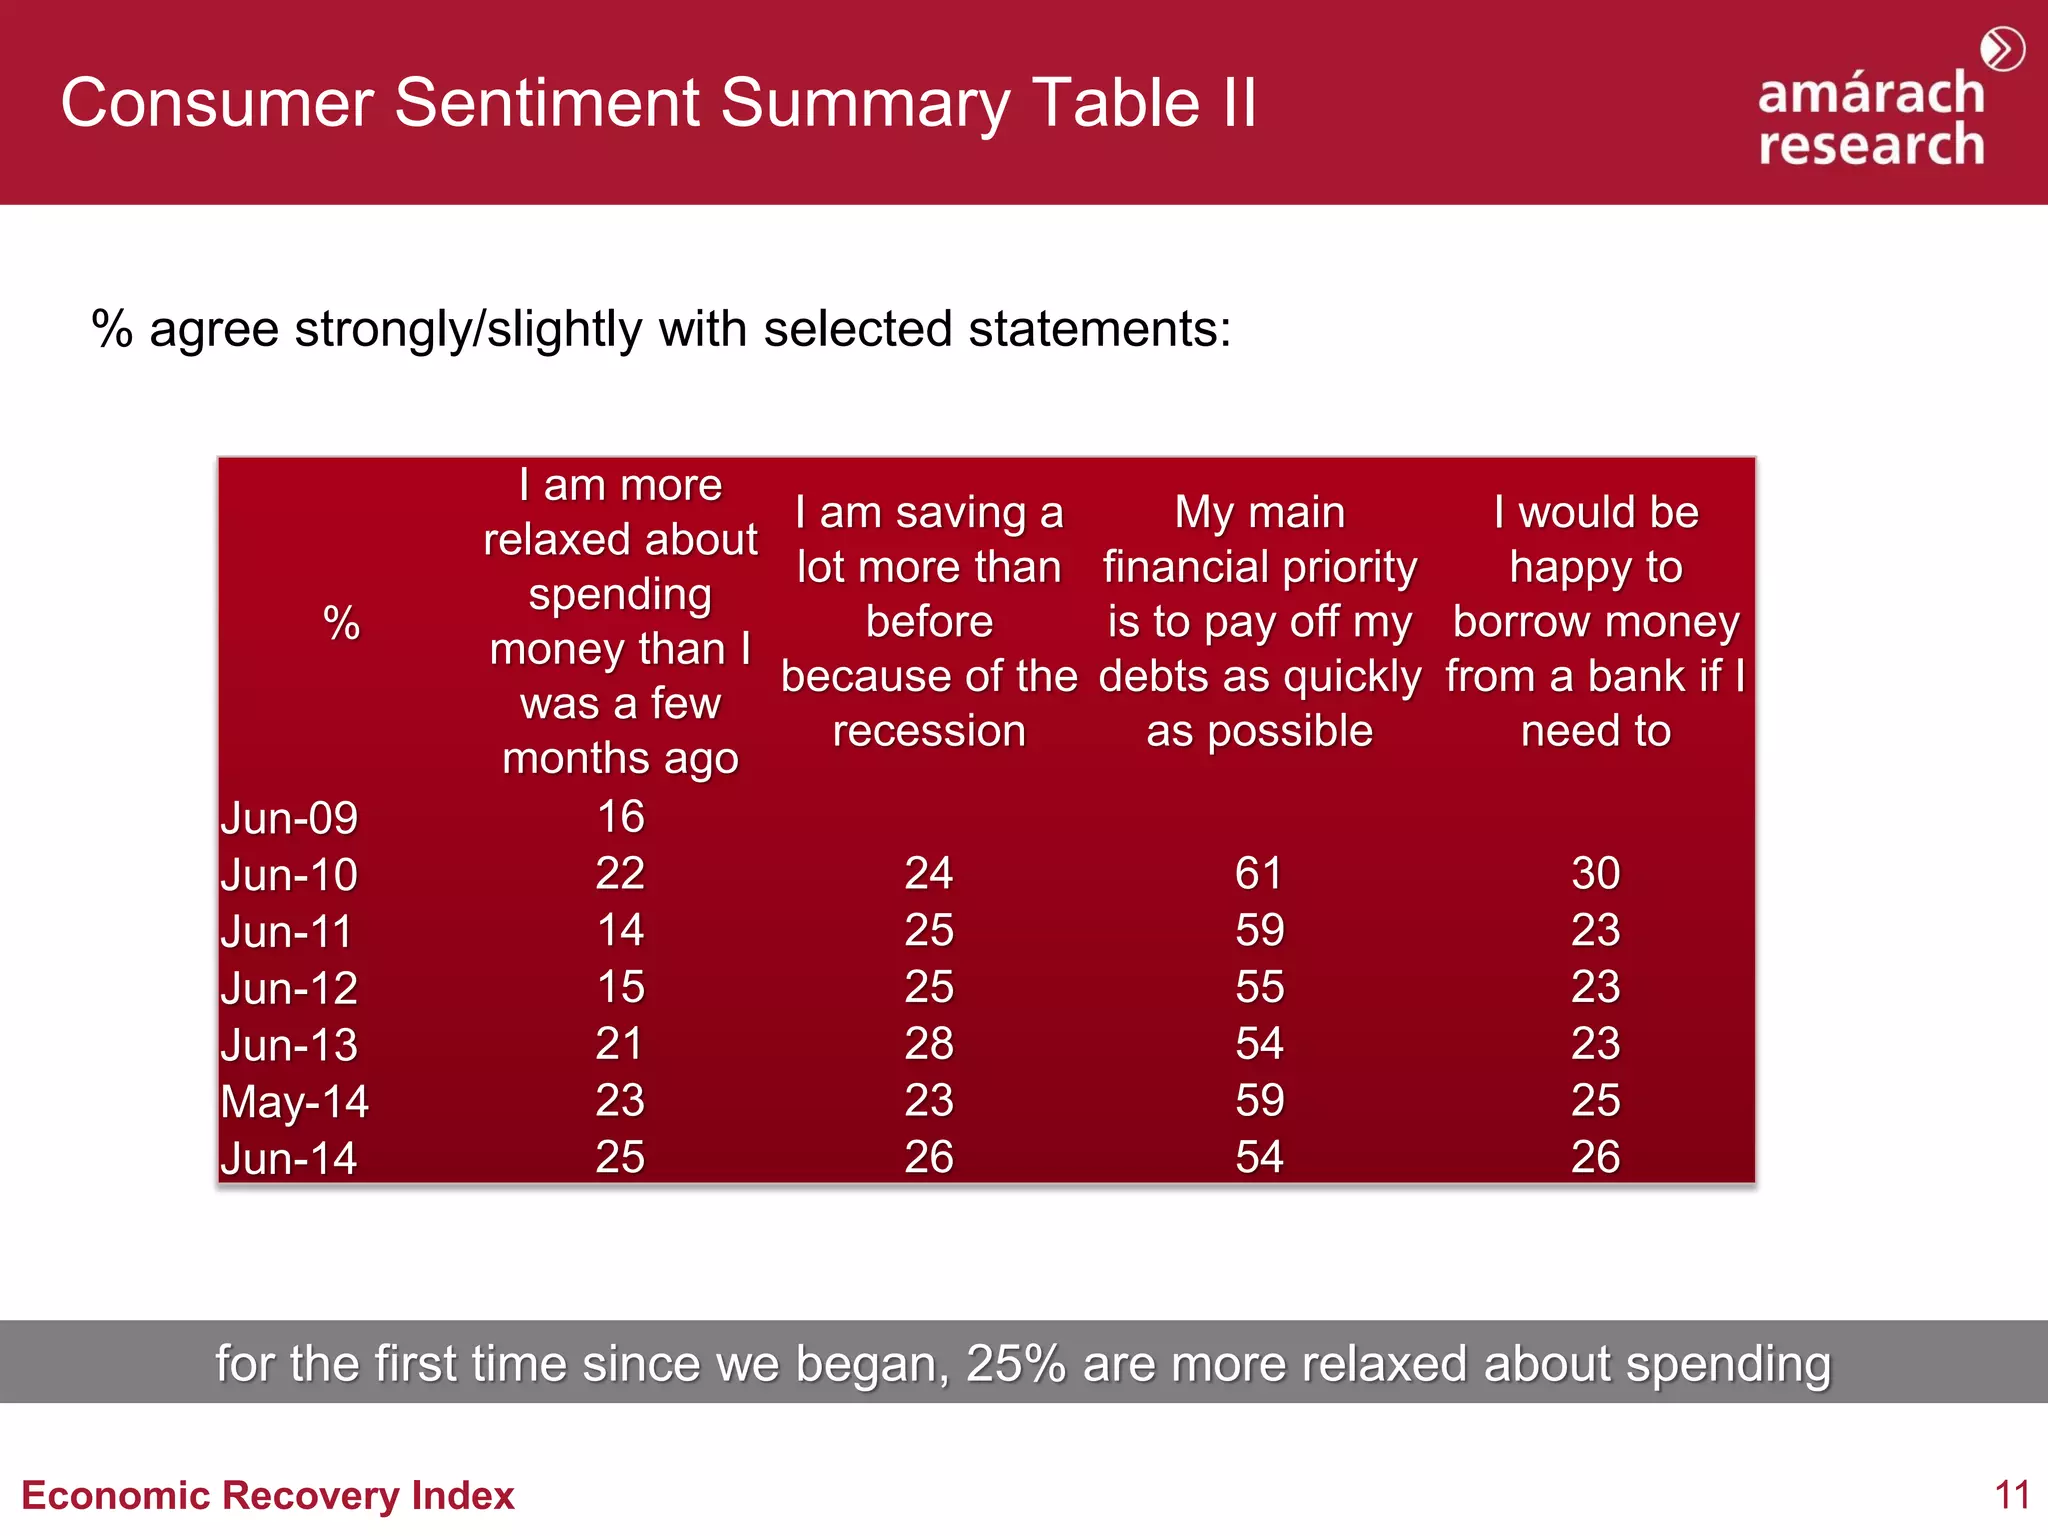
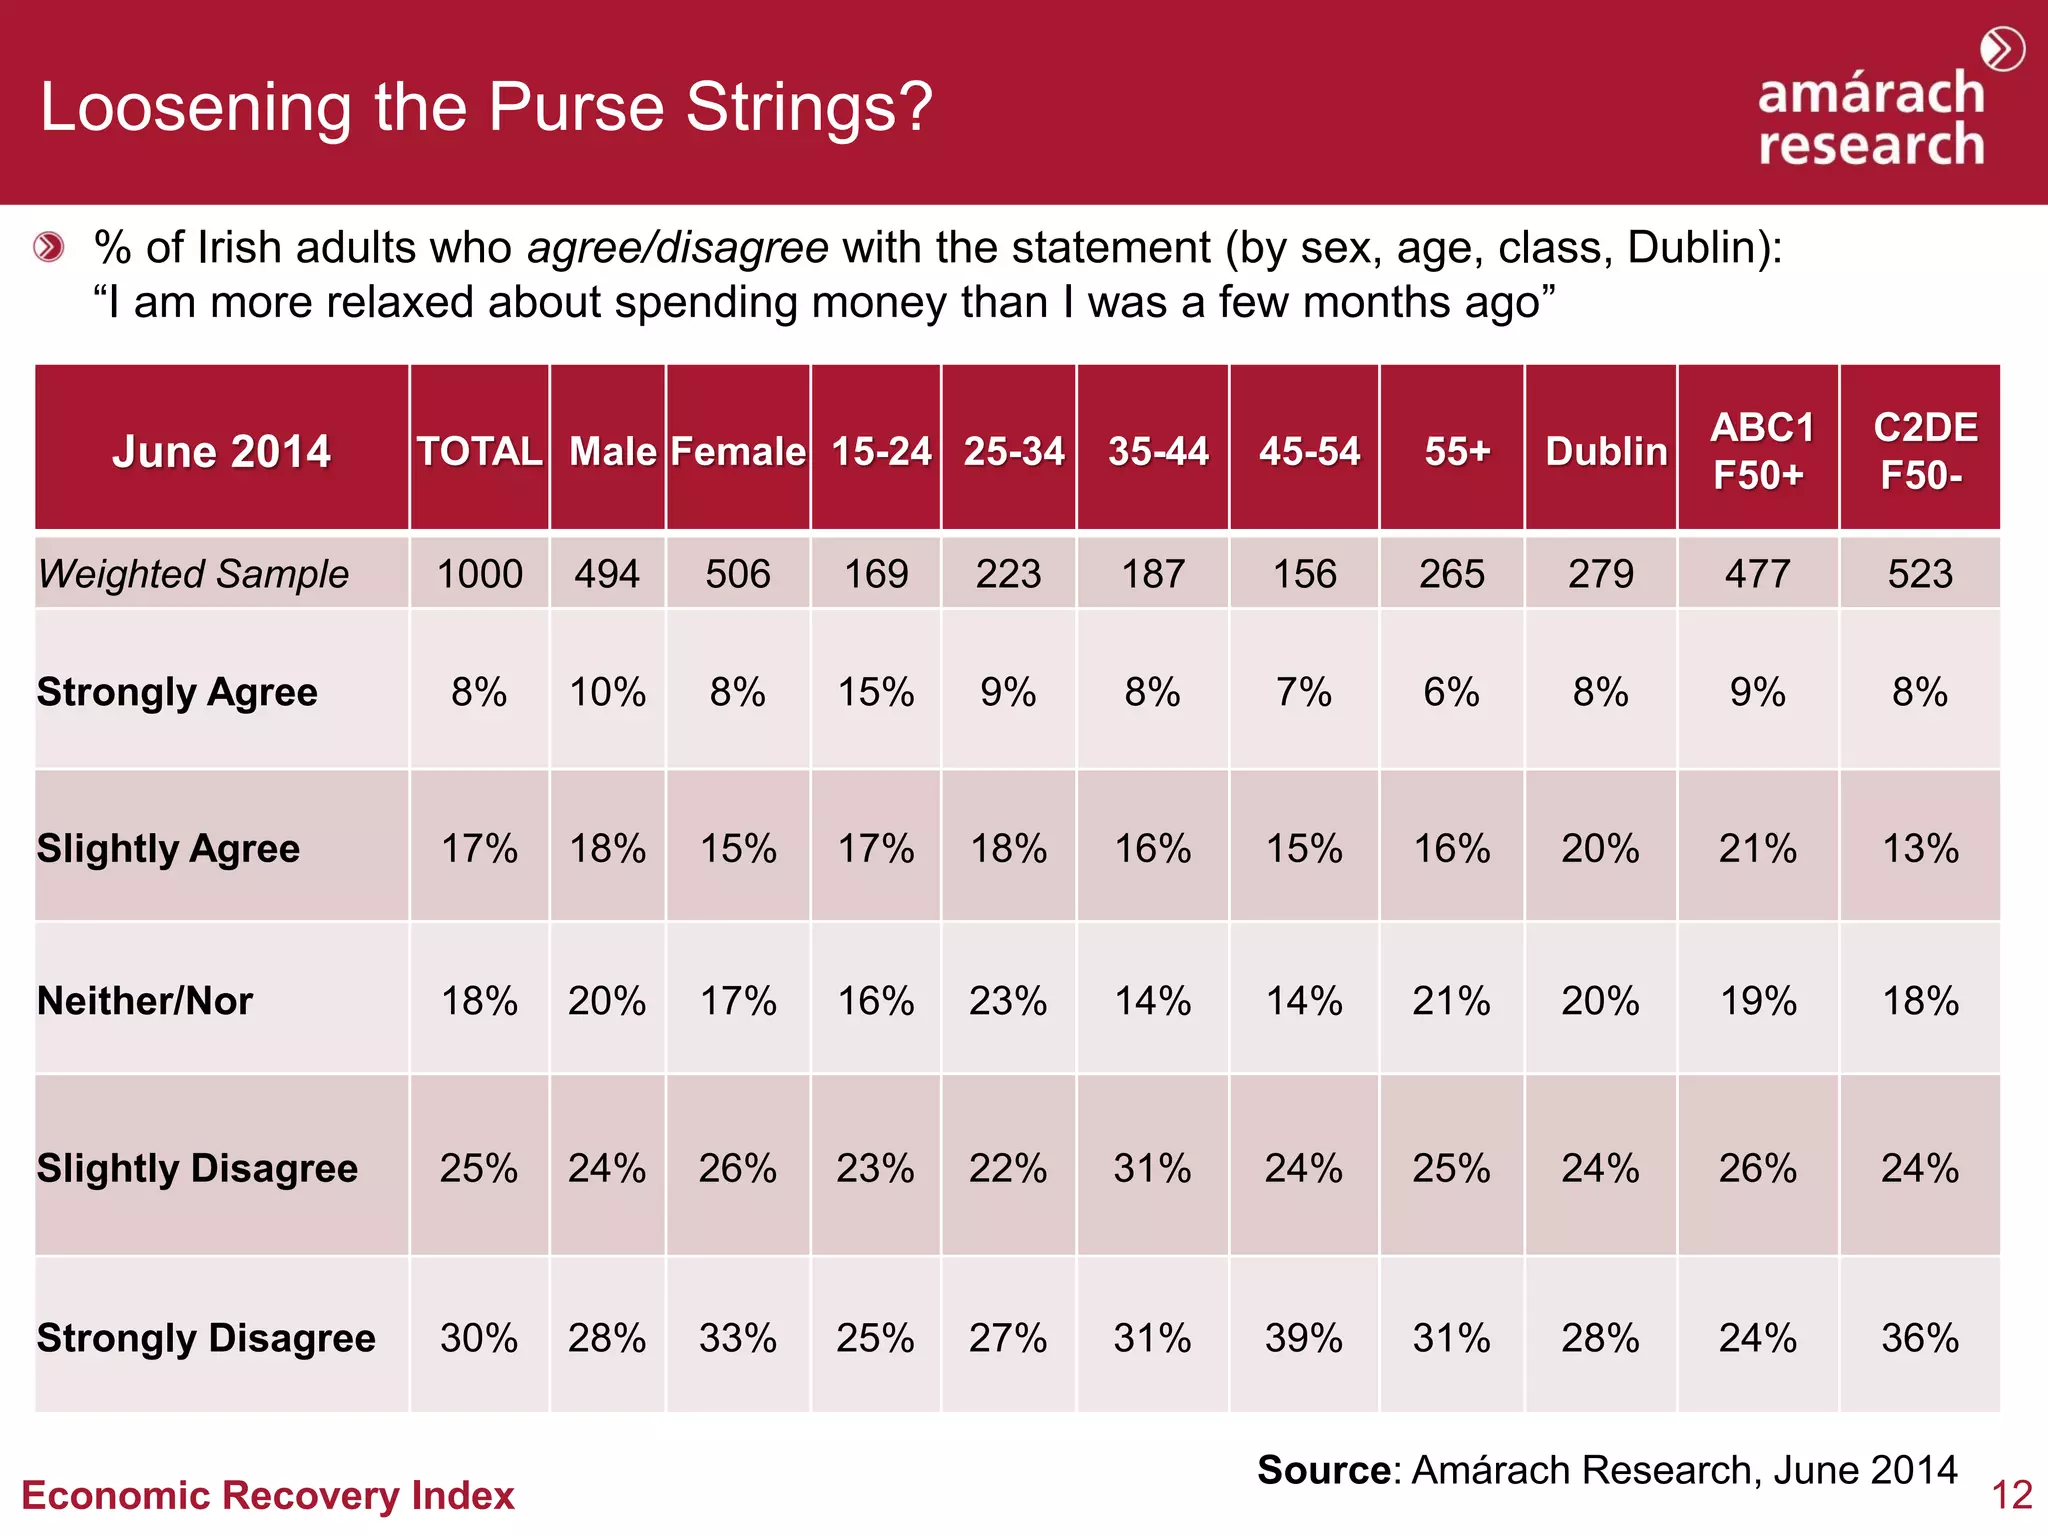
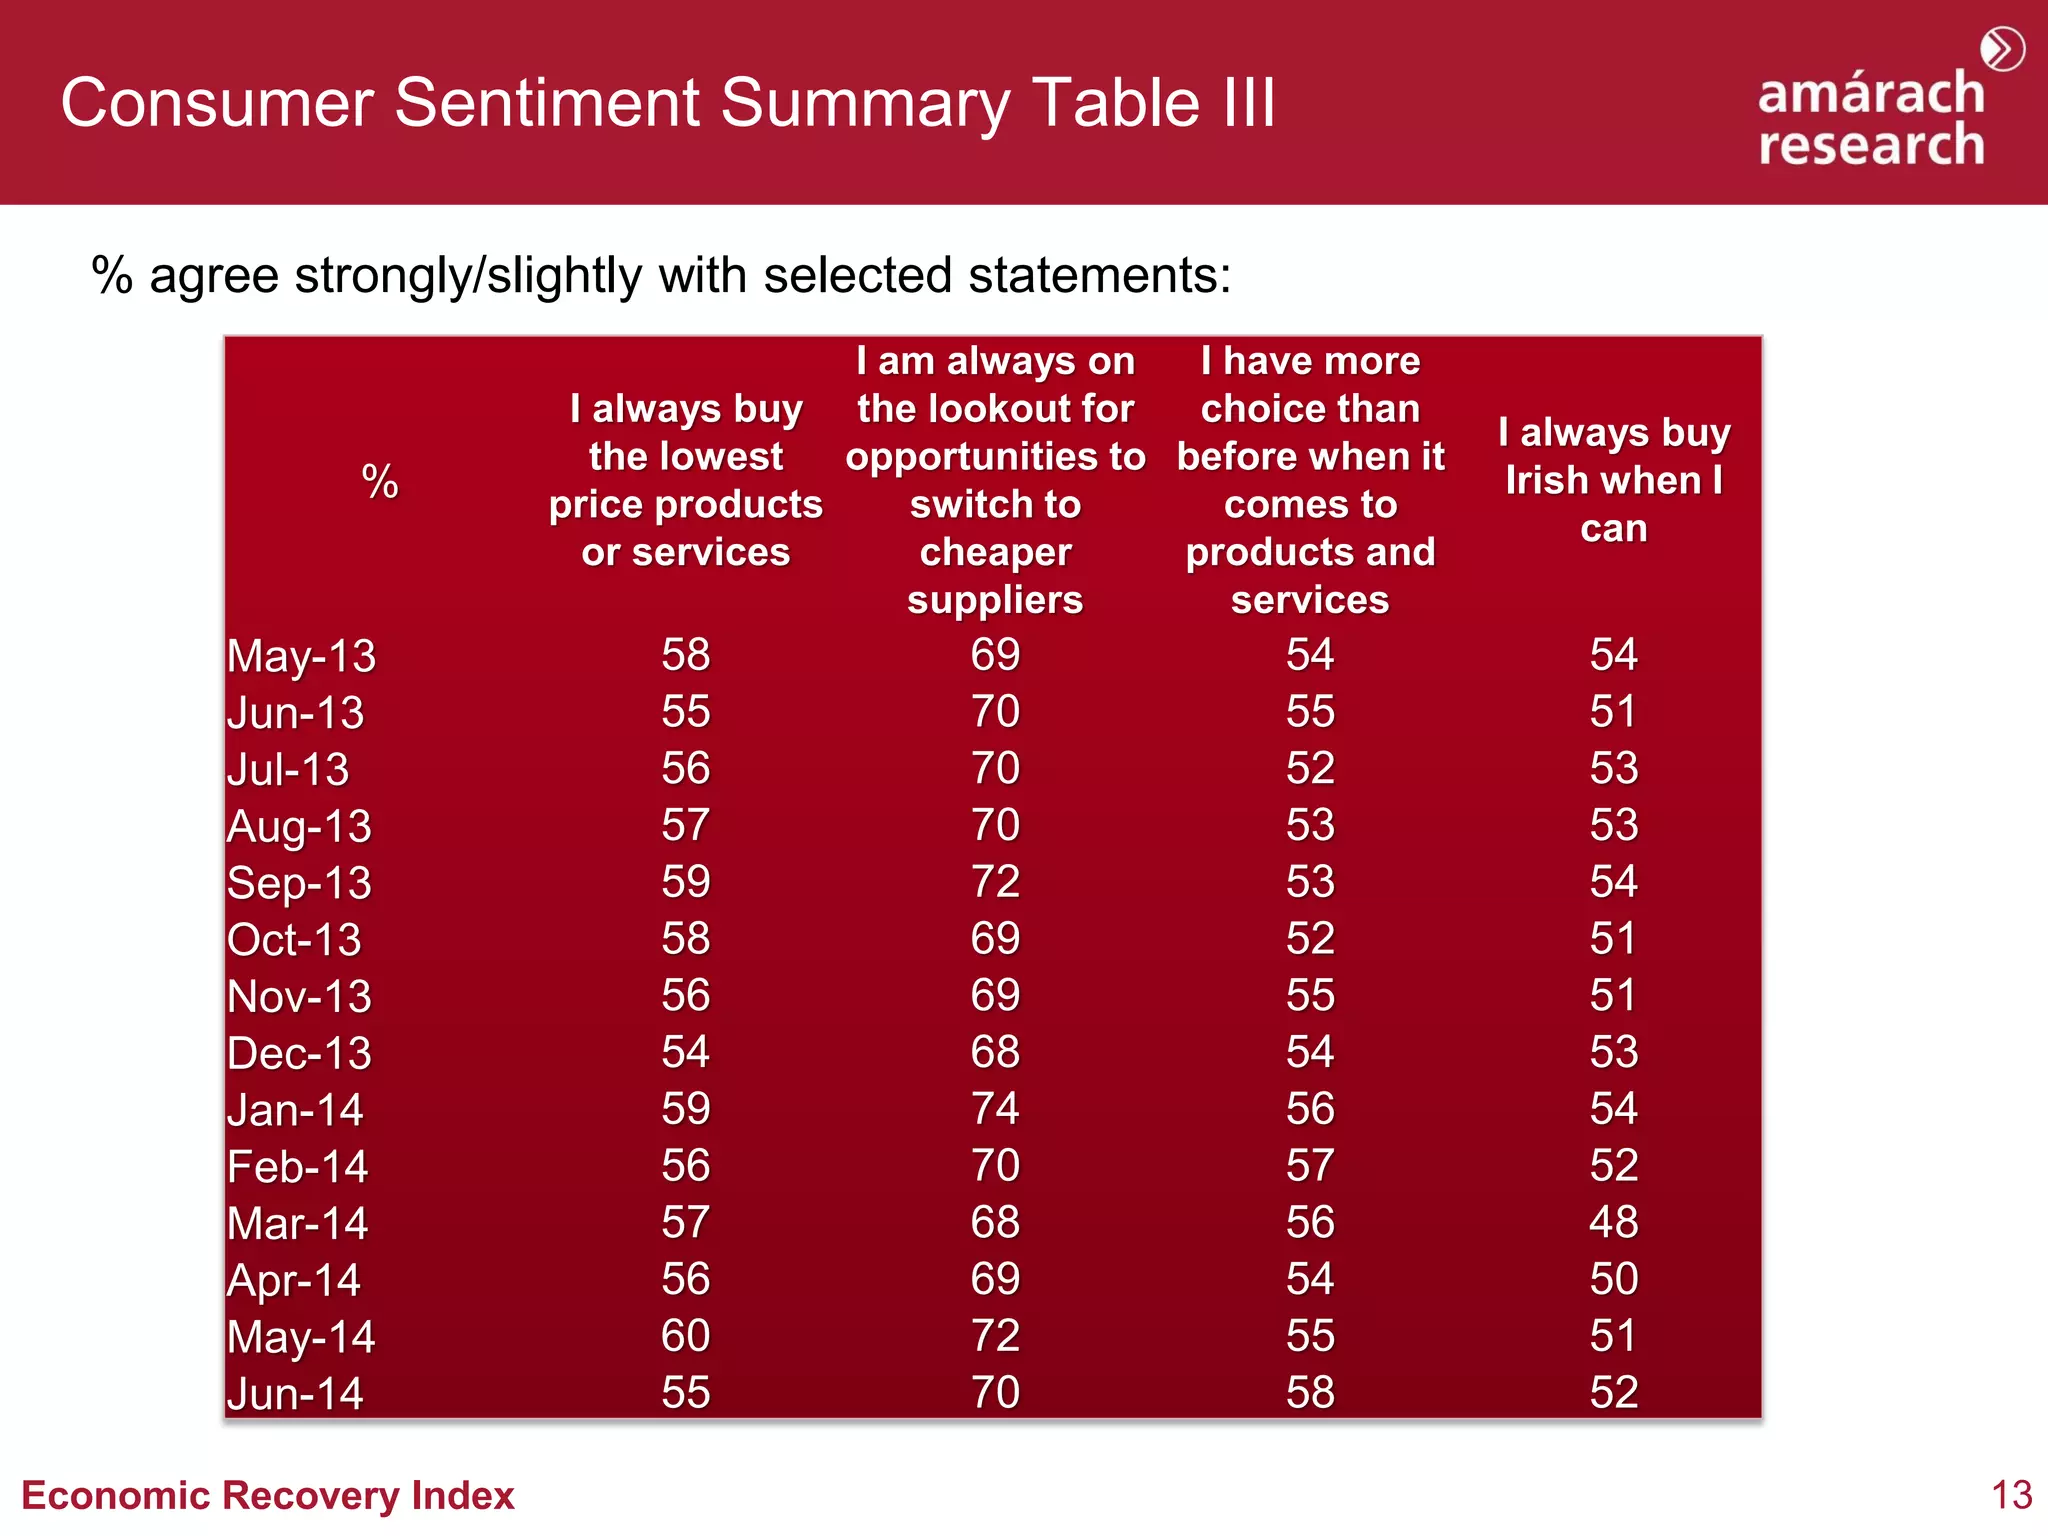
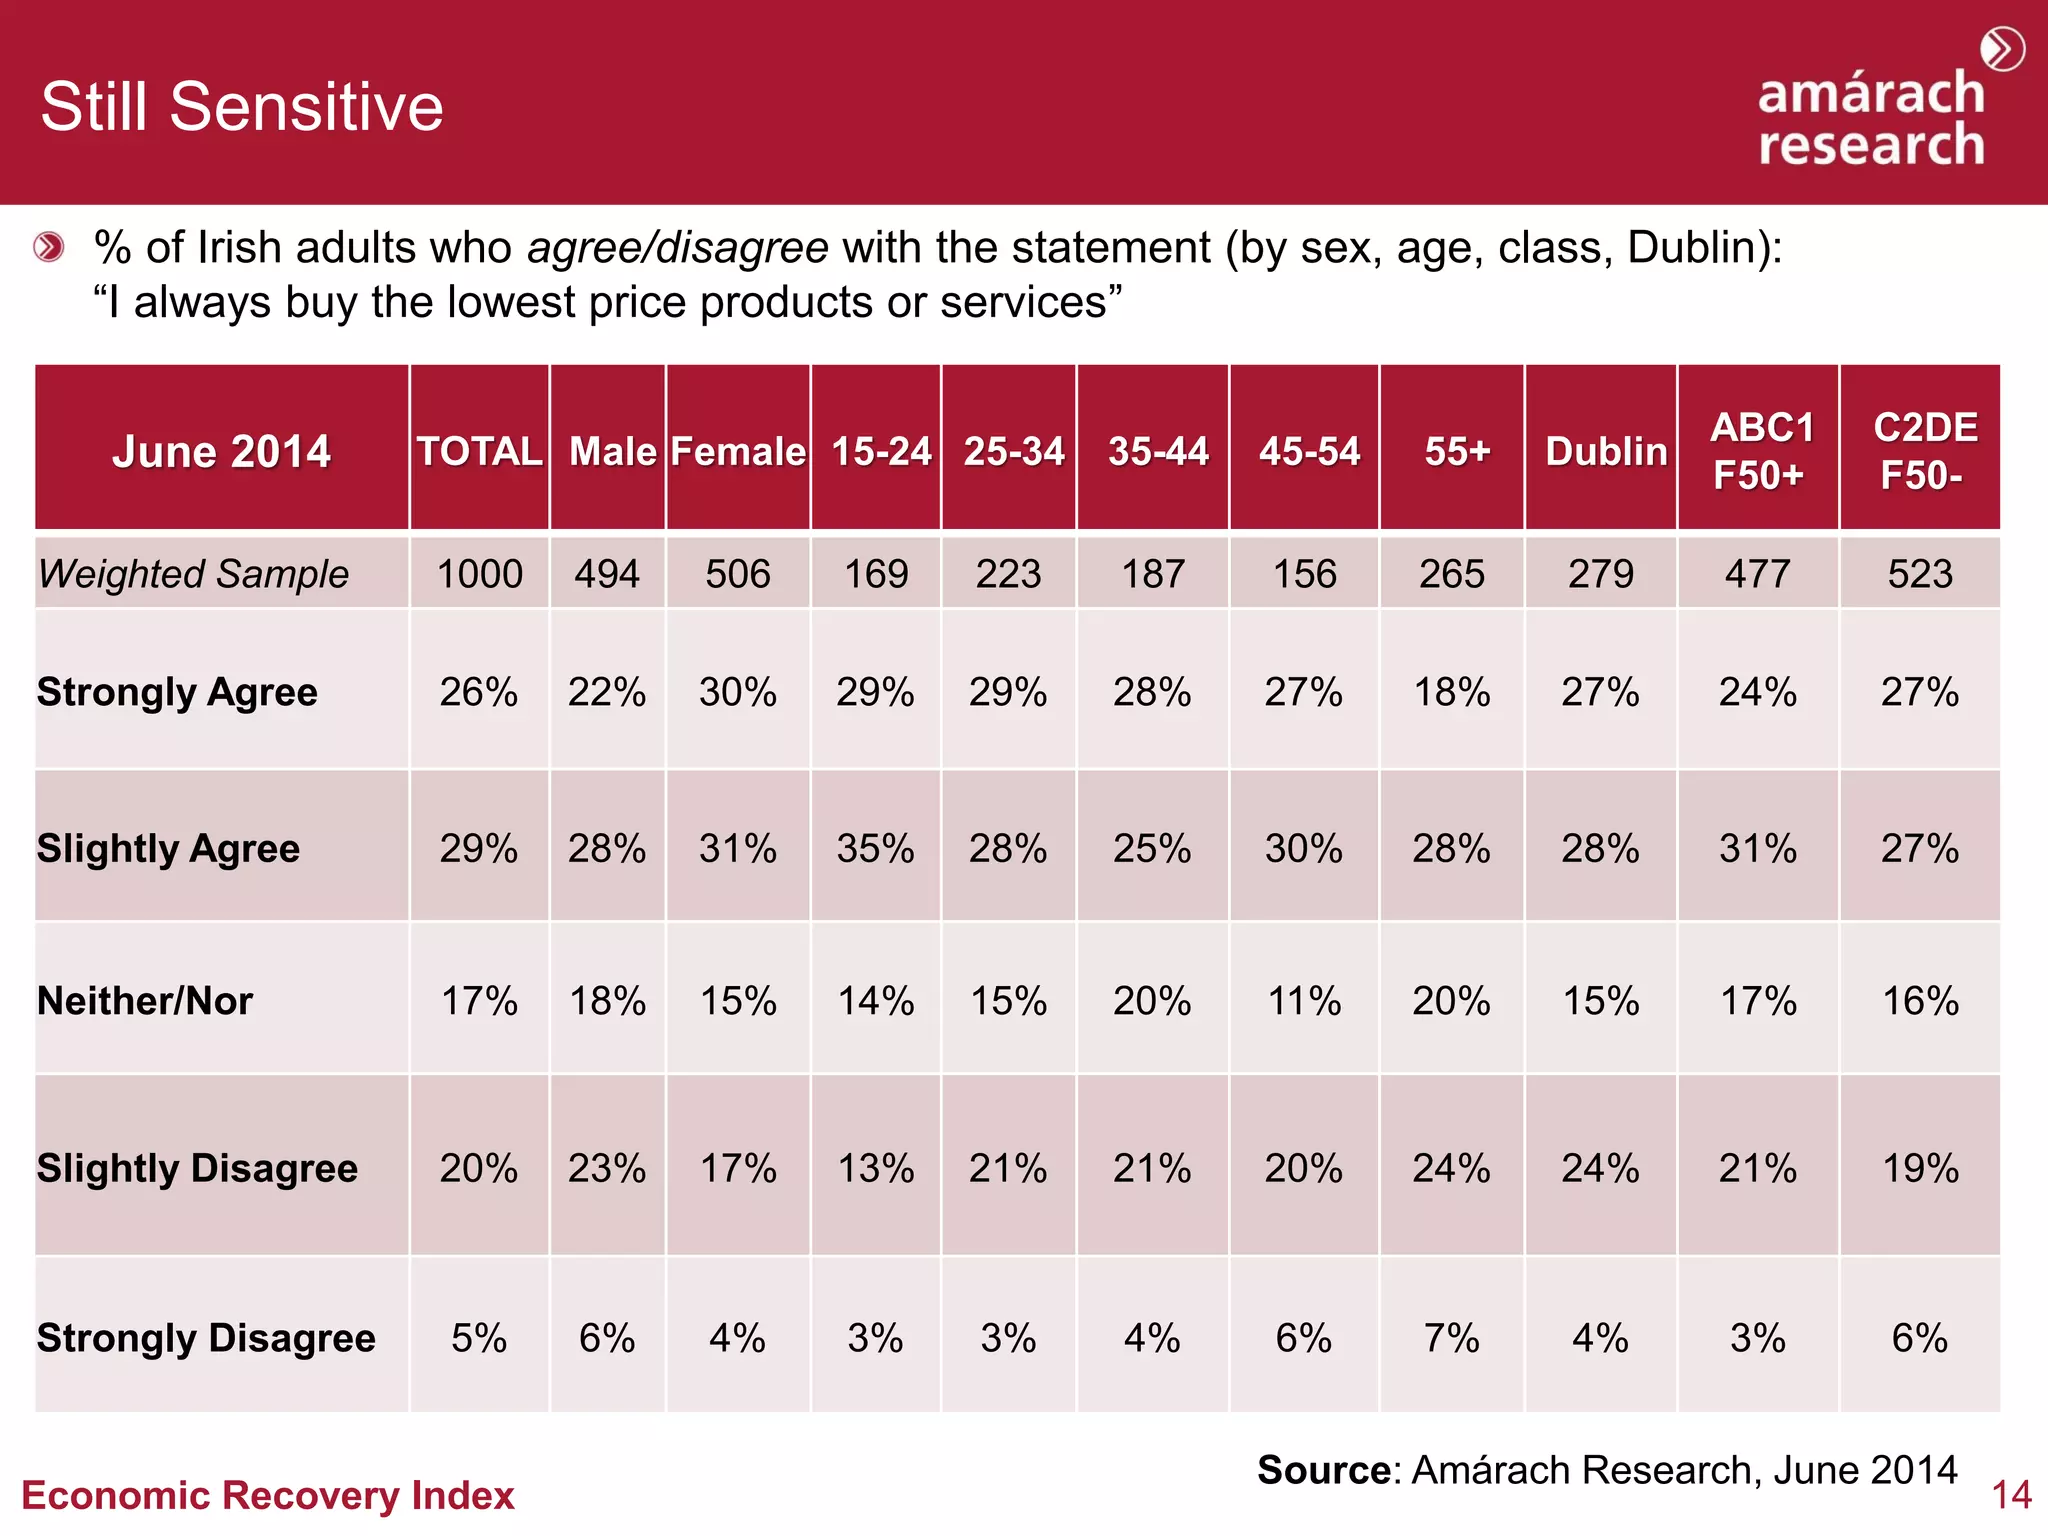
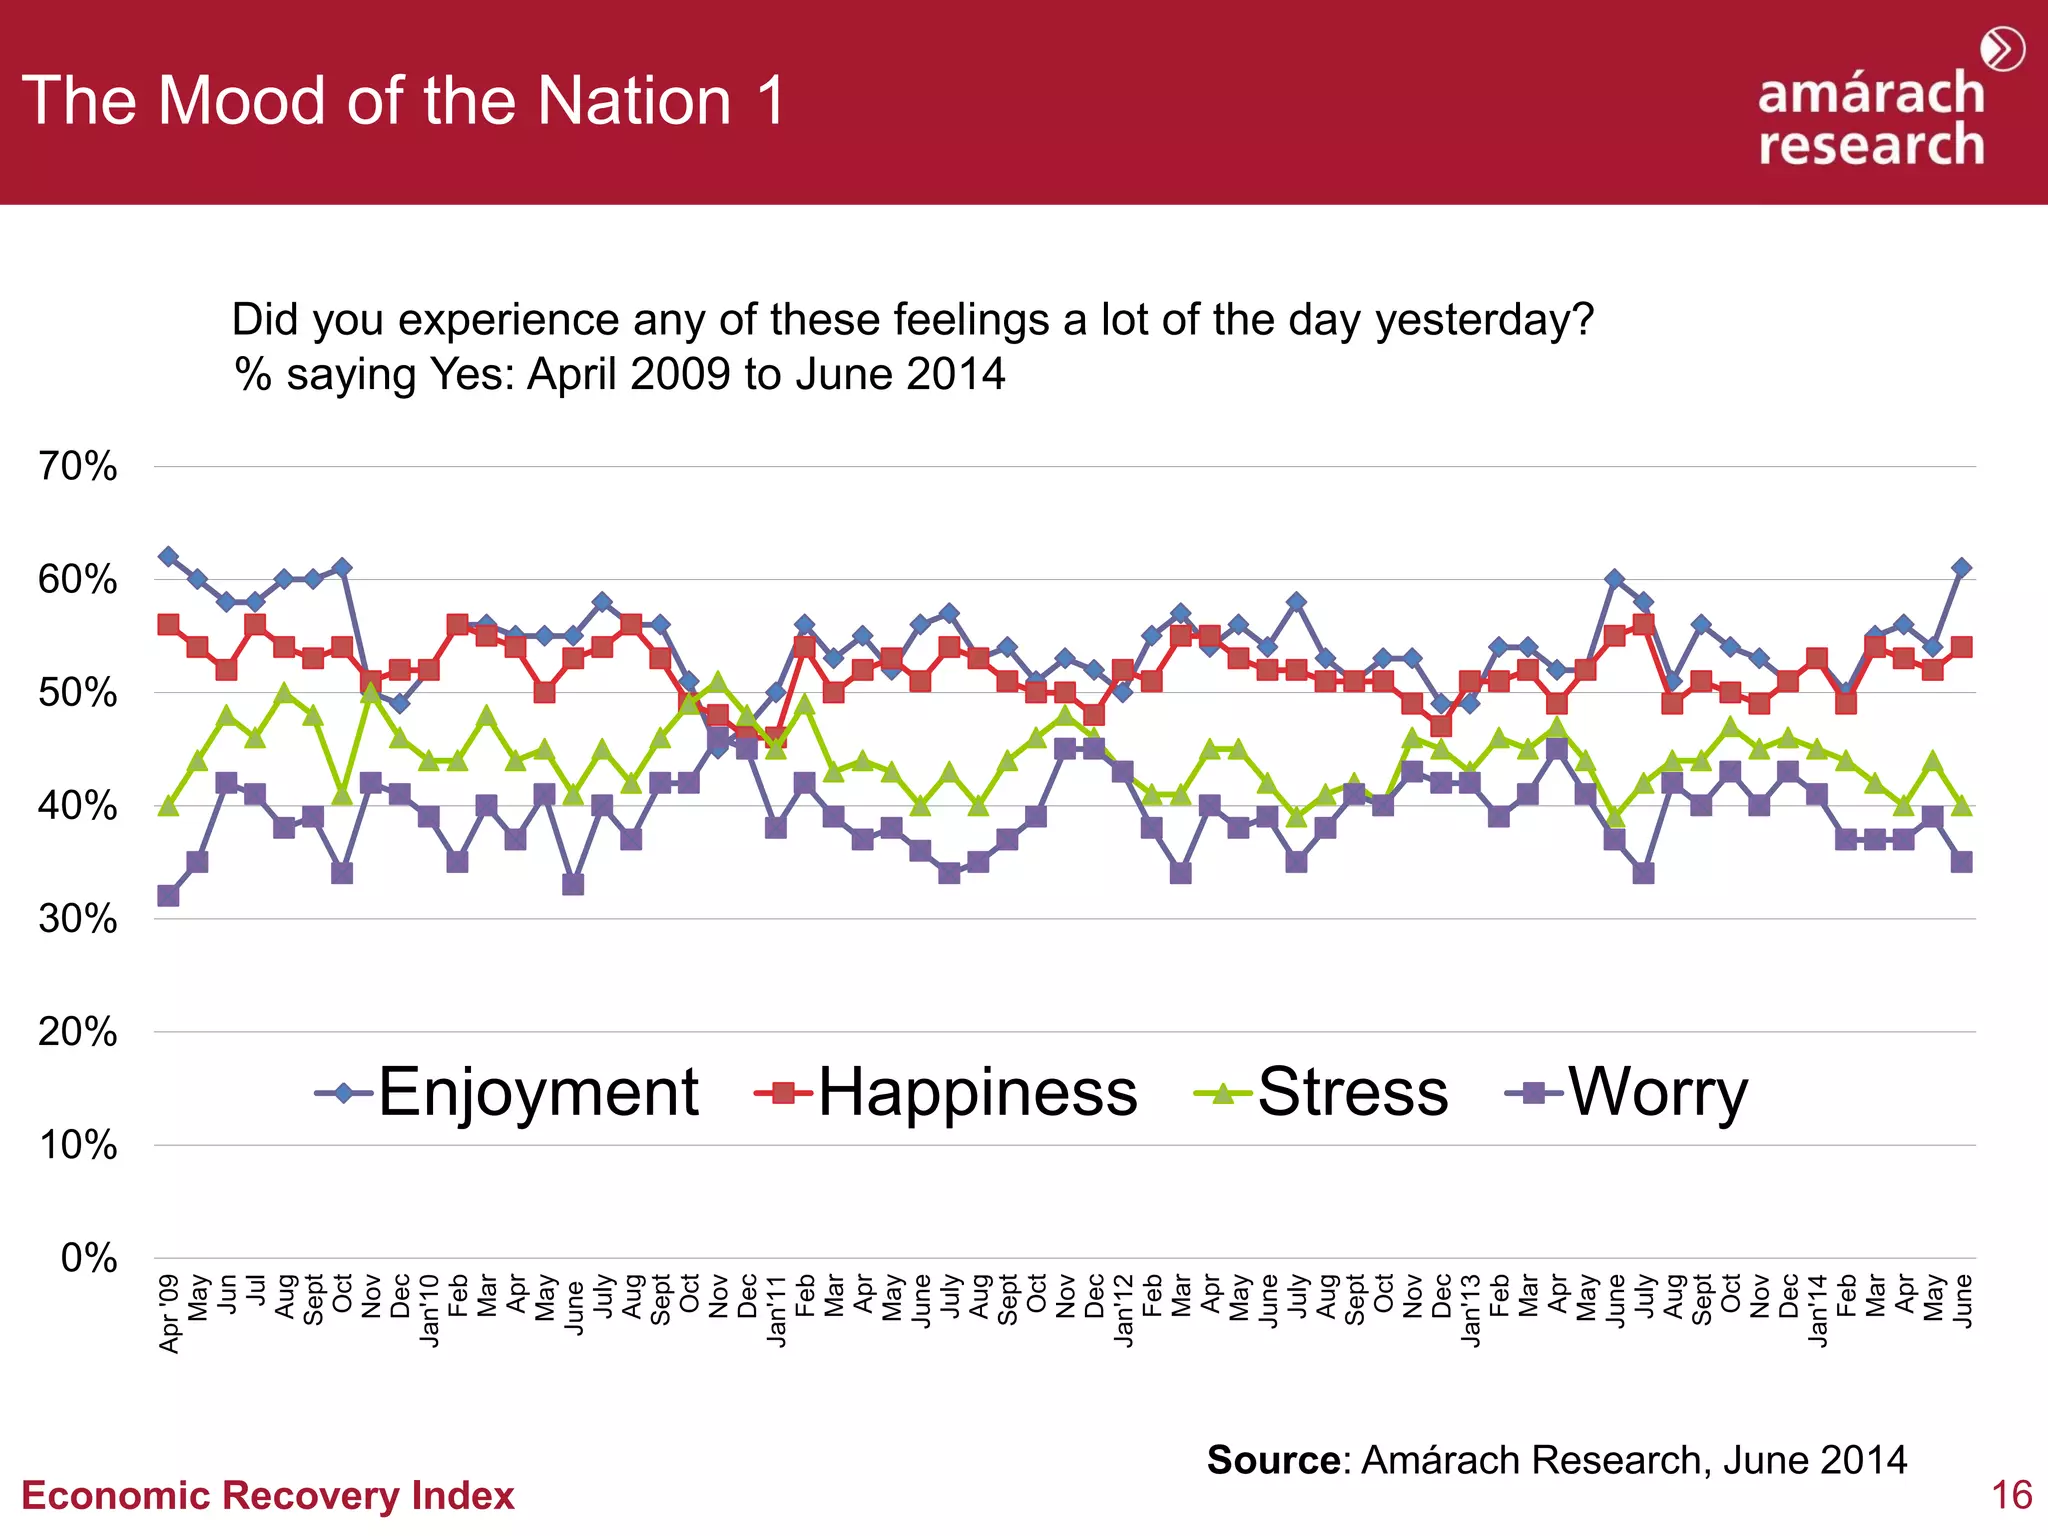
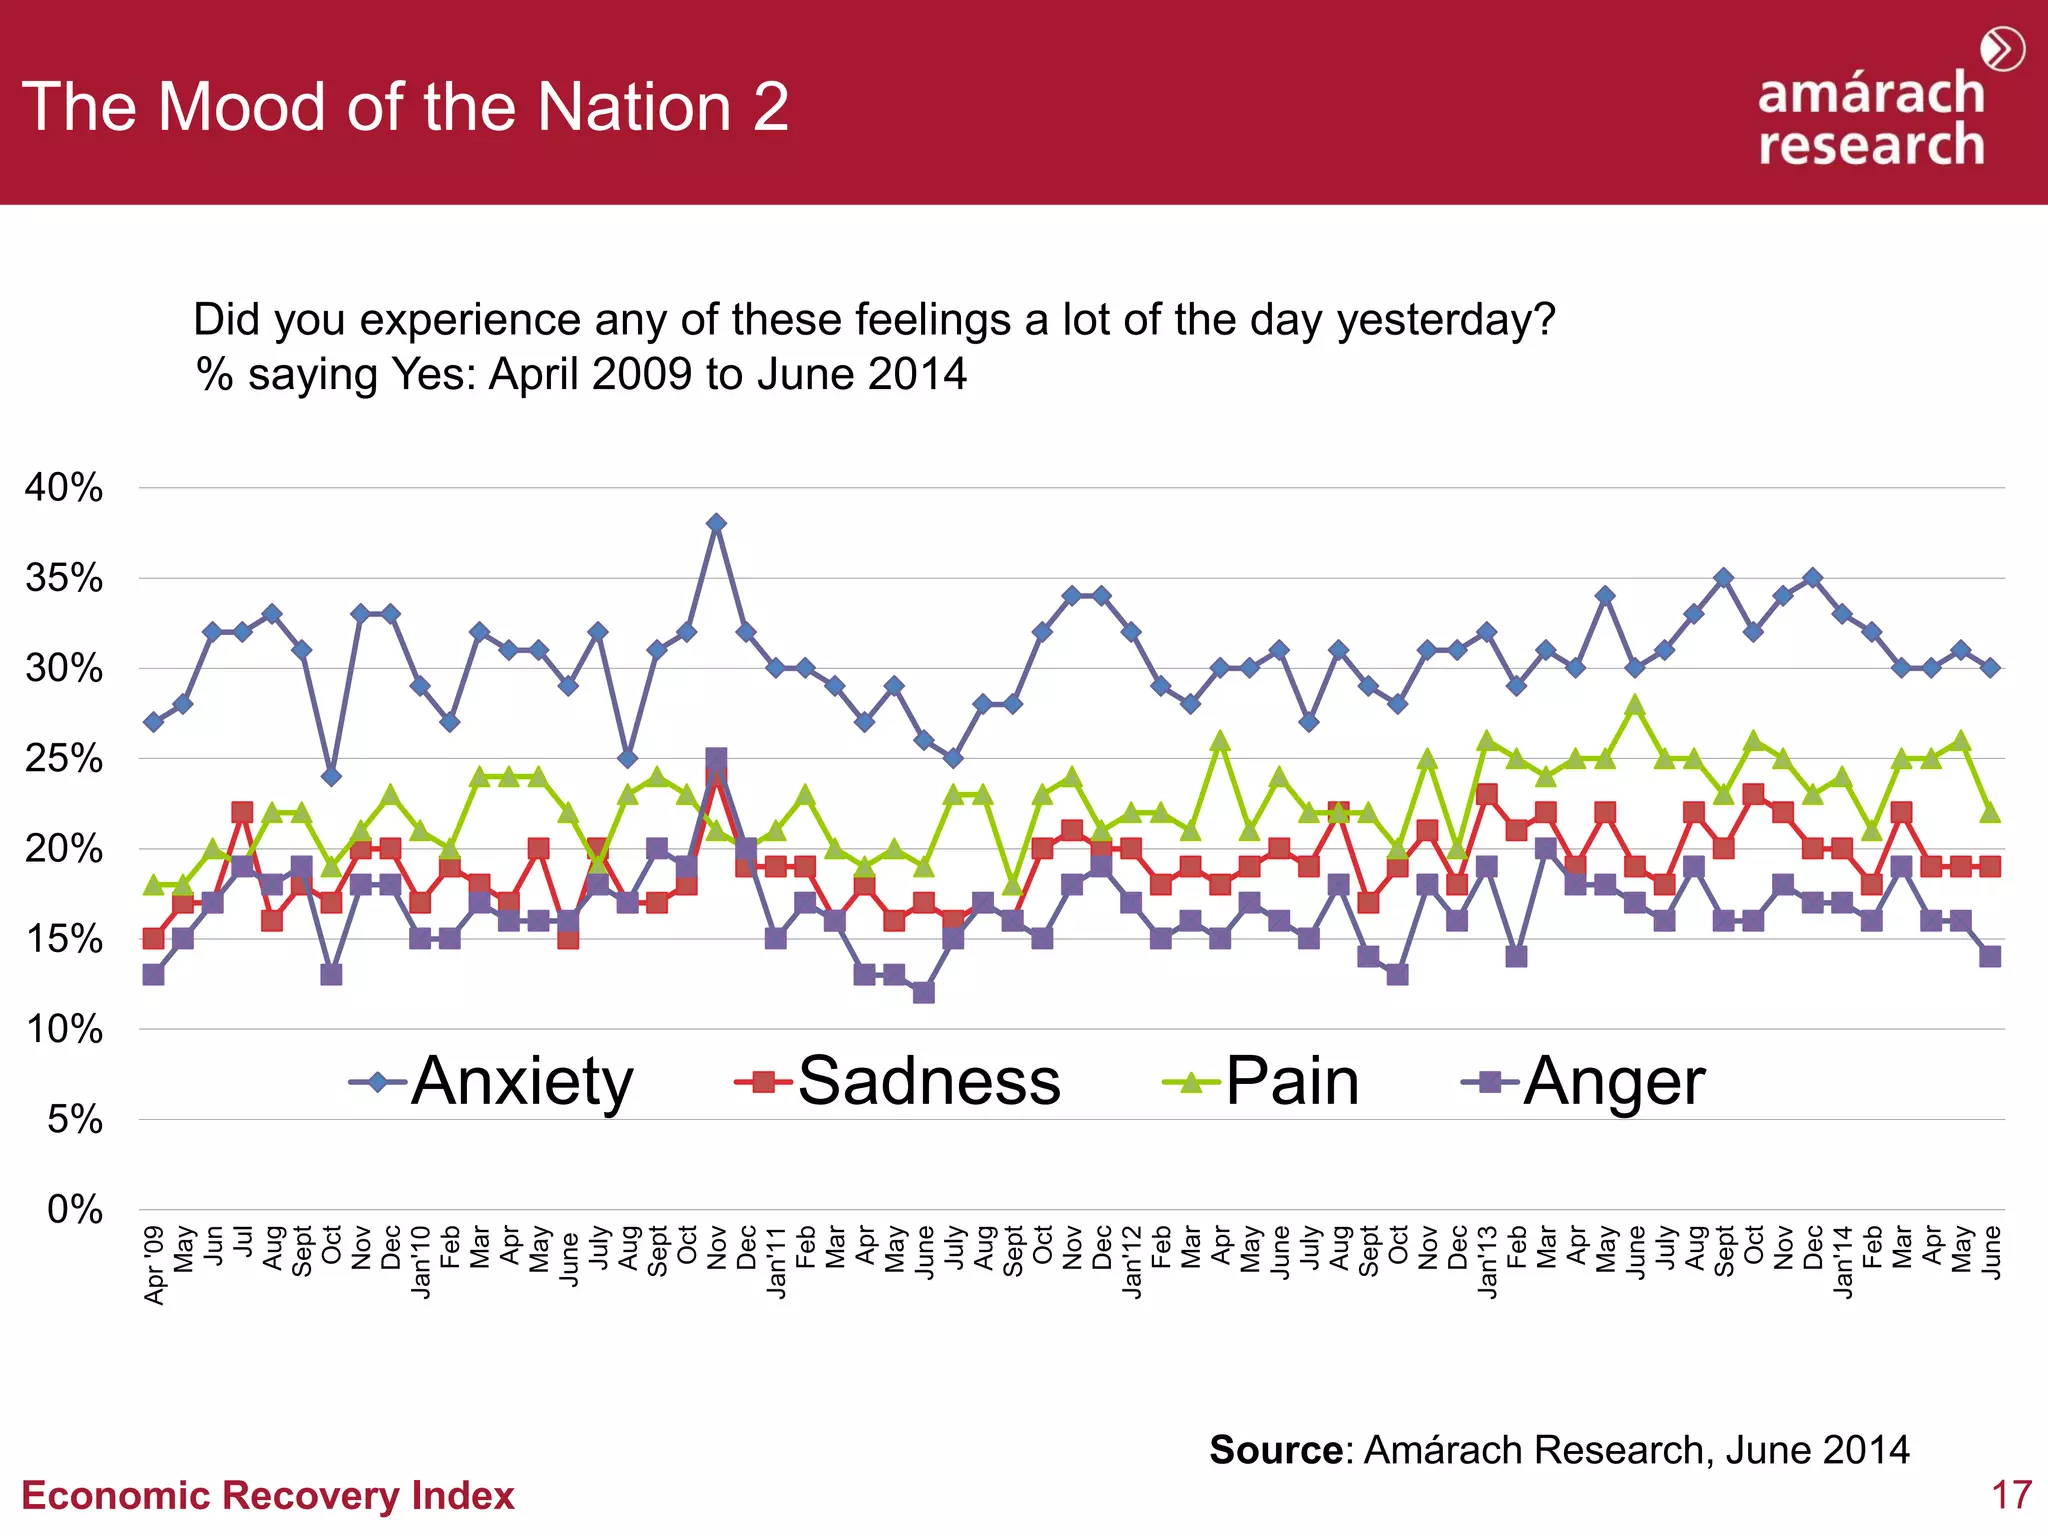
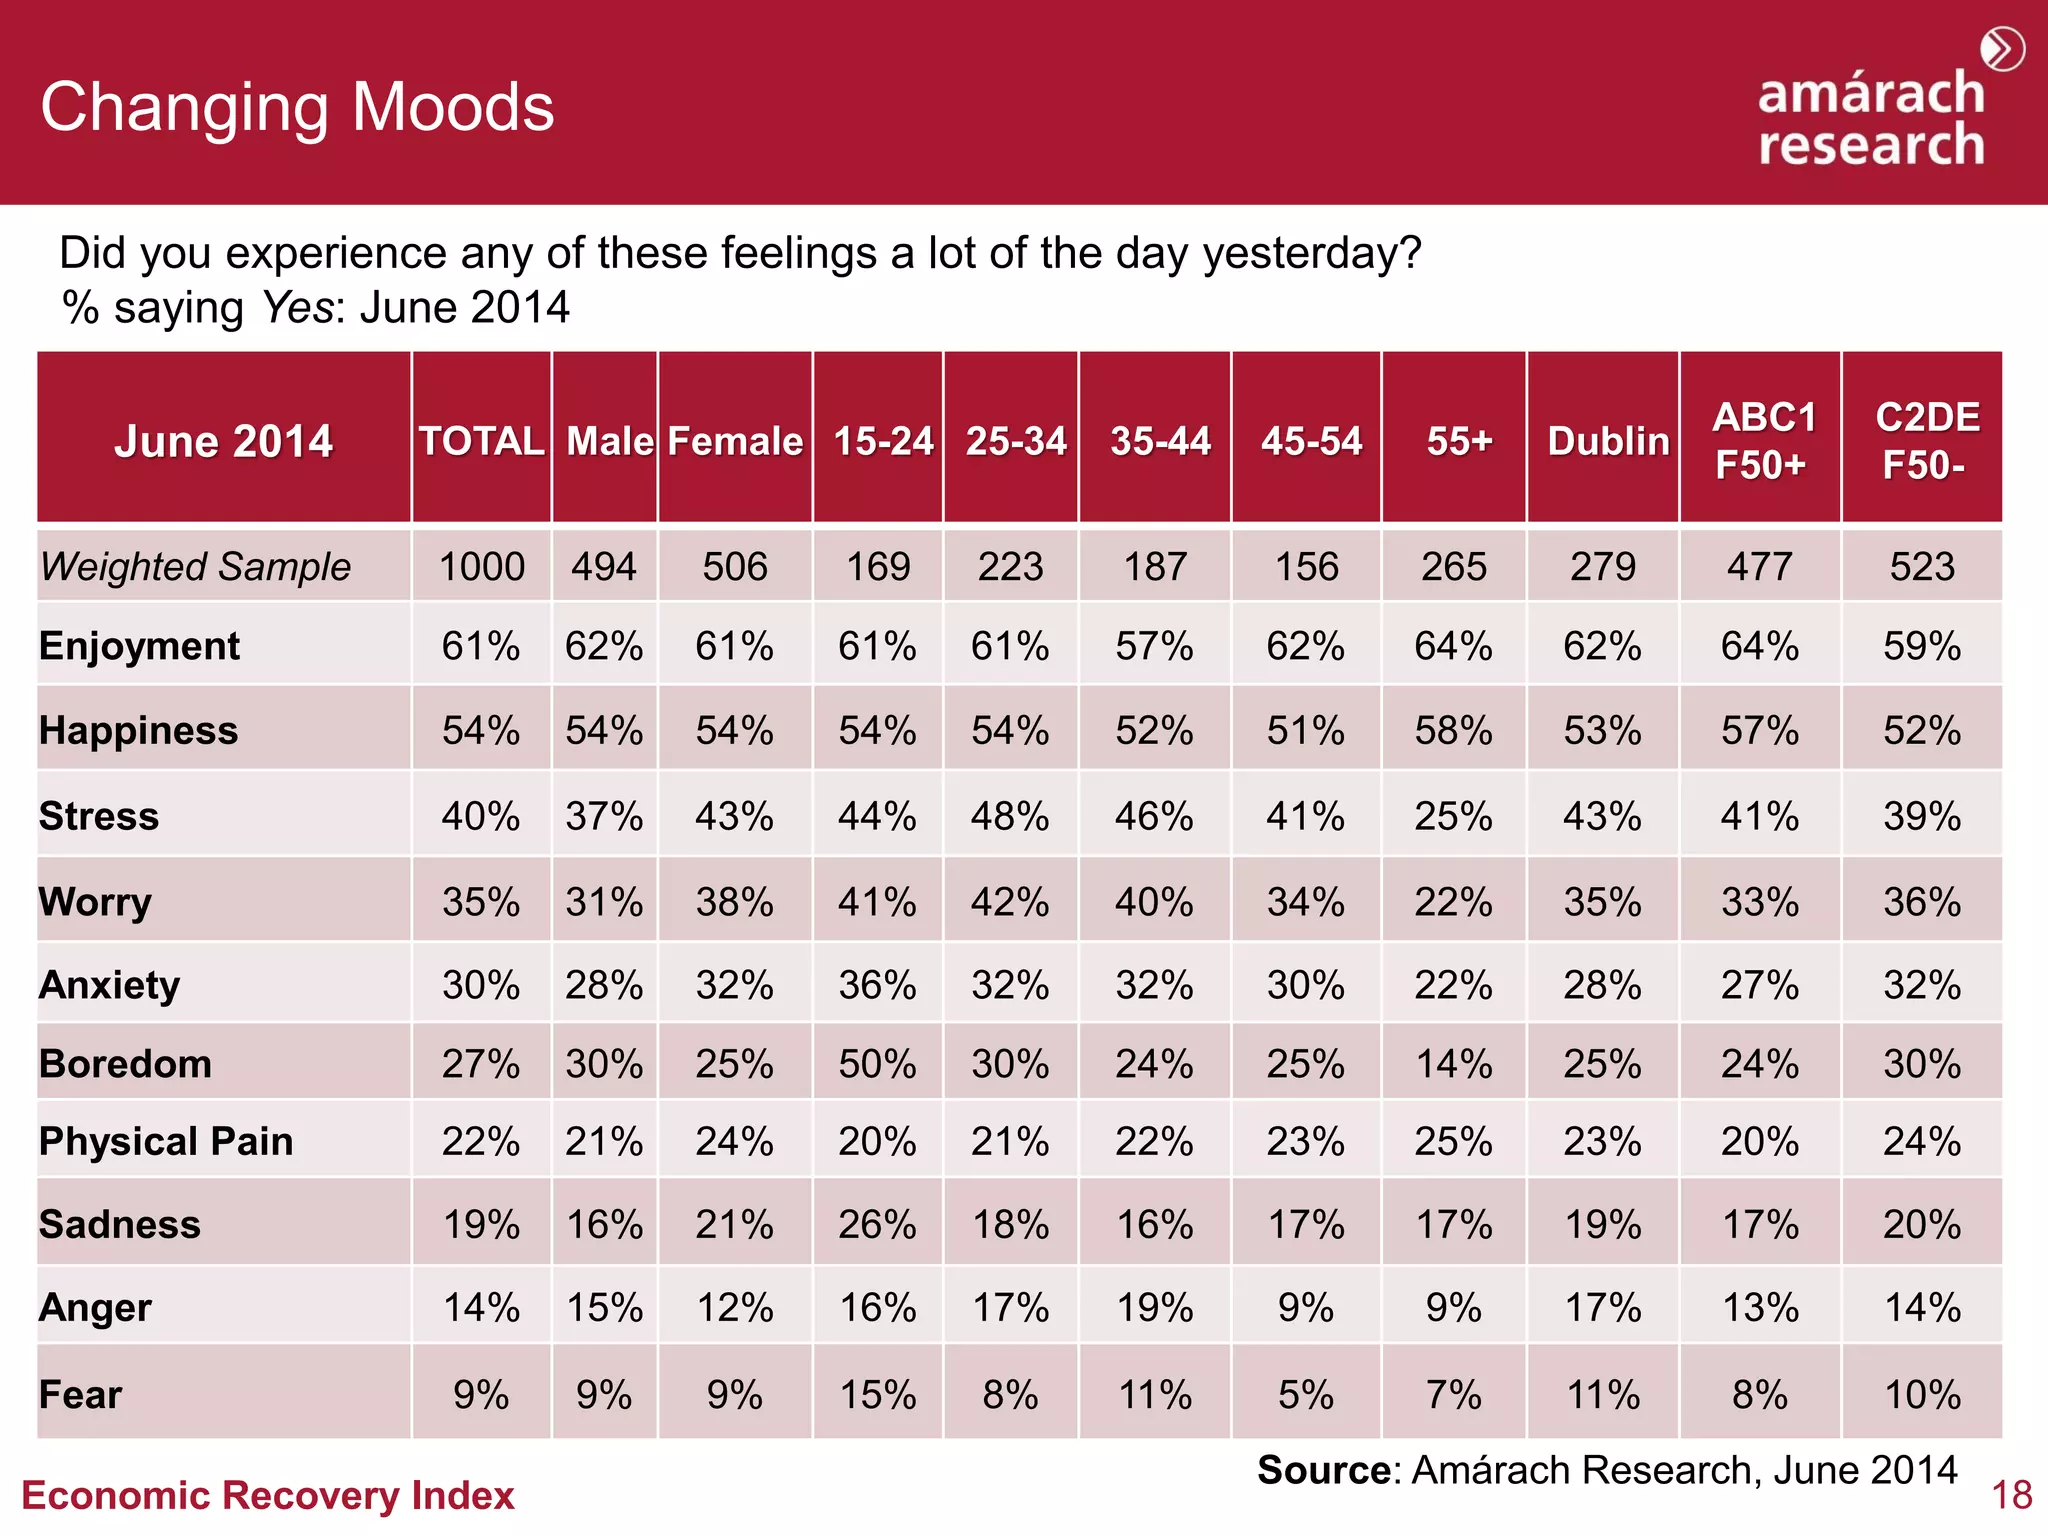
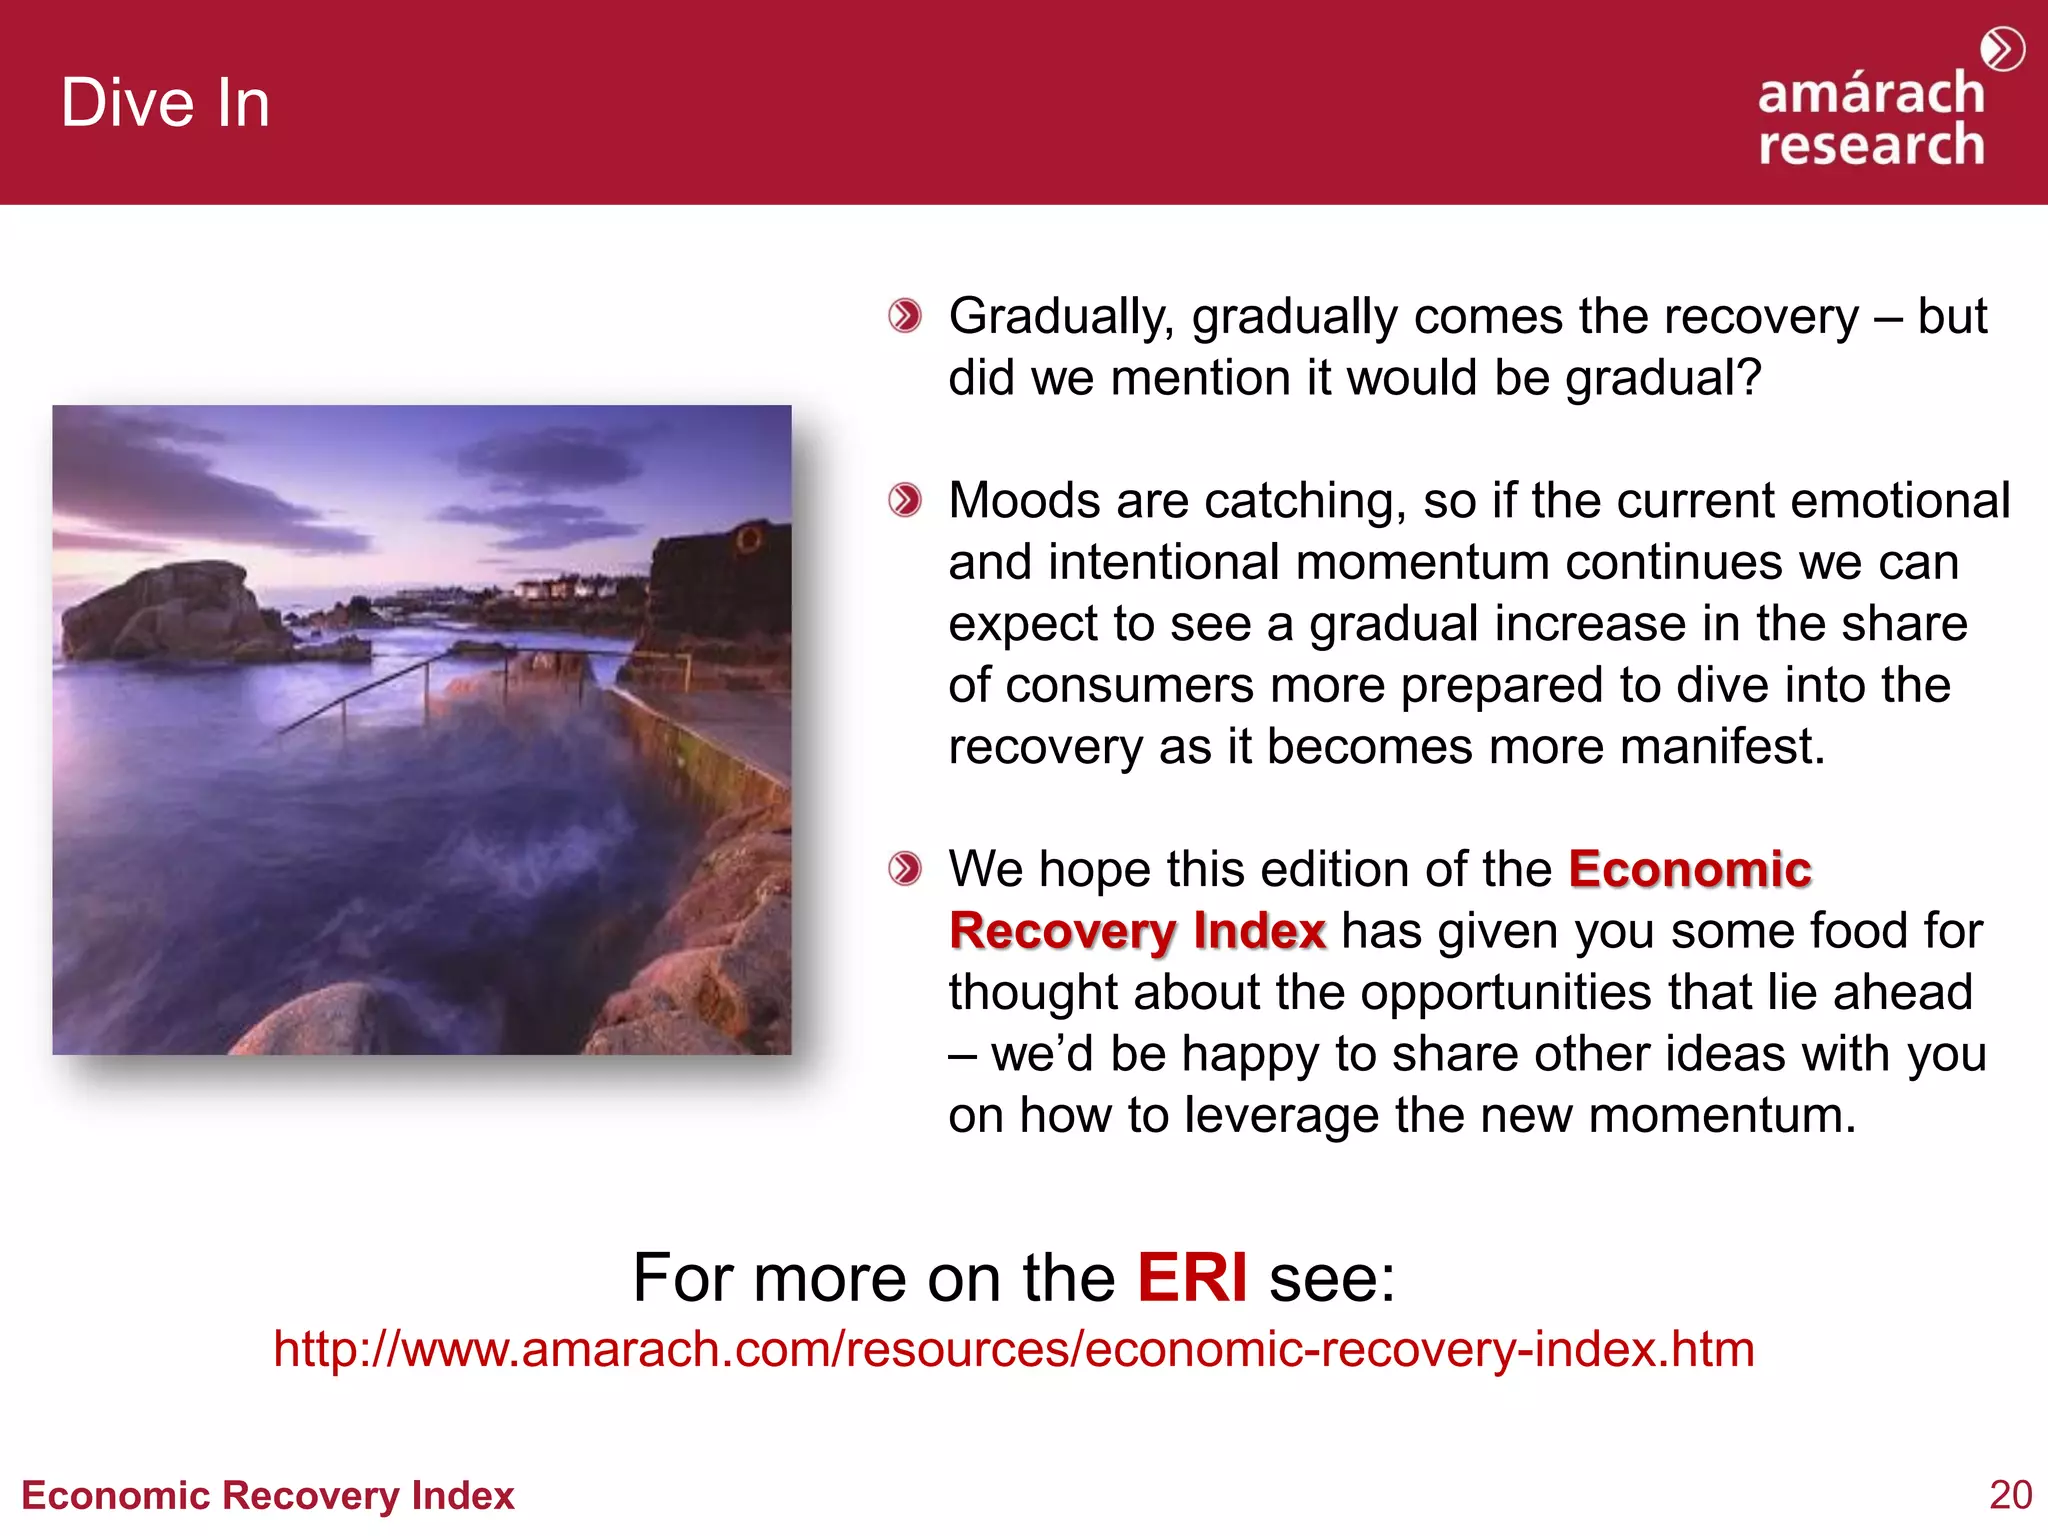
1Economic Recovery Index
Economic Recovery Index
An Amárach Research Briefing
June 2014
© Amárach Research
2Economic Recovery Index
Mid-Summer Momentum
What is the opposite of Seasonal Affective
Disorder (SAD)? Whatever it is, we got it in
June as the share of adults experiencing a
lot of enjoyment in our survey popped
through the 60% barrier for the first time
since… June last year.
This month’s edition of the Economic
Recovery Index points to a reassuring
positivity in consumer sentiment – some
might even say ‘stability’ – that bodes well
for the remainder of the year.
For the first time since we began the ERI,
25% of consumers say they are more
relaxed about spending money – though of
course the remainder are still holding on
tight to their purses and wallets.
3Economic Recovery Index
The Emotional Recovery
We have been reporting our monthly
Economic Recovery Index since April 2009.
We set out over five years ago to assess the
psychological impact of the recession and to
chart our ‘emotional progress’ towards
recovery alongside our ‘economic progress’.
This report summarises our Economic
Recovery Index results from April 2009 to
June 2014.
The most recent fieldwork was conducted
during 16th-23rd June 2014 inclusive.
The full data series is on our website – details
at the end of this report.
Economic Recovery Index
5Economic Recovery Index
Using the answers to the question on ‘stages of recovery’ we have created the Economic
Recovery Index, which ranges from 0 to 100 (0 = deep recession; 100 = back to peak).
Our Index has remained fairly constant through May and June 2014:
The Economic Recovery Index
Source: Amárach Research, June 2014
0
5
10
15
20
25
30
35
40
Apr'09
Jun
July
Aug
Sept
Oct
Nov
Dec
Jan'10
Feb
Mar
Apr
May
June
July
Aug
Sept
Oct
Nov
Dec
Jan'11
Feb
Mar
Apr
May
June
July
Aug
Sept
Oct
Nov
Dec
Jan'12
Feb
Mar
Apr
May
June
July
Aug
Sept
Oct
Nov
Dec
Jan'13
Feb
Mar
Apr
May
June
July
Aug
Sept
Oct
Nov
Dec
Jan'14
Feb
Mar
Apr
May
June
the ERI remains well above historic average levels at the mid-year point
6Economic Recovery Index
A Matter of Measurement
May ’14: 24% June ’14: 24%
May ’14: 32% June ’14: 33%
May ’14: 36% June ’14: 35%
May ’14: 8% June ’14: 8%
May ’14: 0% June ’14: 1%
Every month we survey a representative, online sample of 1,000 adults and ask them to tell us
which one statement ‘best describes the economic situation in Ireland right now’ (listed below)
The percentage thinking ‘things are getting worse’ remains low, but isn’t falling either:
7Economic Recovery Index
ERI Summary Table
Which one statement ‘best describes the economic situation in Ireland right now’?
% choosing each statement:
%
The economic
situation in
Ireland is
getting worse
The economic
situation is bad
but has
stabilized
The economic
situation is bad
but showing a
few signs of
improvement
The economic
situation is
getting better
and showing
clear signs of
improvement
The economic
situation is
good and
almost fully
recovered
Economic
Recovery
Index
Jun-09 52 27 19 2 0 17.8
Jun-10 33 36 27 3 1 25.3
Jun-11 46 28 23 2 1 20.4
Jun-12 50 29 20 1 0 18.2
Jun-13 37 32 27 4 0 24.5
May-14 24 32 36 8 0 32.4
Jun-14 24 33 35 8 1 32.5
the positive outlook evident from late 2013 has continued into 2014 without abating
8Economic Recovery Index
Uneven Recovery
Which one statement ‘best describes the economic situation in Ireland right now’?
(by sex, age, class, Dublin)
Source: Amárach Research, June 2014
June 2014 TOTAL Male Female 15-24 25-34 35-44 45-54 55+ Dublin
ABC1
F50+
C2DE
F50-
1000 494 506 169 223 187 156 265 279 477 523
The economic situation
in Ireland is getting
worse
23% 25% 21% 17% 21% 24% 24% 27% 19% 17% 29%
The economic situation
is bad but has stabilized
32% 33% 31% 36% 36% 34% 32% 25% 34% 34% 30%
The economic situation
is bad but showing a
few signs of
improvement
34% 31% 37% 35% 31% 33% 30% 38% 31% 36% 32%
The economic situation
is getting better and
showing clear signs of
improvement
8% 9% 8% 9% 9% 5% 10% 8% 11% 11% 6%
The economic situation
is good and almost fully
recovered from the
recession
1% 1% 1% 1% 1% 1% 1% 1% 2% 1% *
ERI Score 32.5 31.6 33.4 34.3 32.9 30.3 32.1 32.9 35.7 36.5 28.8
Consumer Impact
10Economic Recovery Index
Consumer Sentiment Summary Table I
% agree strongly/slightly with selected statements:
%
Ireland will be
through the
worst of the
recession in
12 months
time
I feel I am
financially
comfortable
enough to
make it
through the
recession
I am optimistic
in spite of the
current
economic
situation
Right now it
seems like the
recession is
affecting other
people more
than it is
affecting me
Jun-09 44 51 65 61
Jun-10 42 45 54 50
Jun-11 23 34 47 44
Jun-12 25 36 43 45
Jun-13 33 40 48 46
May-14 38 39 49 45
Jun-14 37 42 50 45
people are feeling a little more optimistic and comfortable – but only a little
11Economic Recovery Index
Consumer Sentiment Summary Table II
% agree strongly/slightly with selected statements:
%
I am more
relaxed about
spending
money than I
was a few
months ago
I am saving a
lot more than
before
because of the
recession
My main
financial priority
is to pay off my
debts as quickly
as possible
I would be
happy to
borrow money
from a bank if I
need to
Jun-09 16
Jun-10 22 24 61 30
Jun-11 14 25 59 23
Jun-12 15 25 55 23
Jun-13 21 28 54 23
May-14 23 23 59 25
Jun-14 25 26 54 26
for the first time since we began, 25% are more relaxed about spending
12Economic Recovery Index
Loosening the Purse Strings?
% of Irish adults who agree/disagree with the statement (by sex, age, class, Dublin):
“I am more relaxed about spending money than I was a few months ago”
Source: Amárach Research, June 2014
June 2014 TOTAL Male Female 15-24 25-34 35-44 45-54 55+ Dublin
ABC1
F50+
C2DE
F50-
Weighted Sample 1000 494 506 169 223 187 156 265 279 477 523
Strongly Agree 8% 10% 8% 15% 9% 8% 7% 6% 8% 9% 8%
Slightly Agree 17% 18% 15% 17% 18% 16% 15% 16% 20% 21% 13%
Neither/Nor 18% 20% 17% 16% 23% 14% 14% 21% 20% 19% 18%
Slightly Disagree 25% 24% 26% 23% 22% 31% 24% 25% 24% 26% 24%
Strongly Disagree 30% 28% 33% 25% 27% 31% 39% 31% 28% 24% 36%
13Economic Recovery Index
Consumer Sentiment Summary Table III
% agree strongly/slightly with selected statements:
%
I always buy
the lowest
price products
or services
I am always on
the lookout for
opportunities to
switch to
cheaper
suppliers
I have more
choice than
before when it
comes to
products and
services
I always buy
Irish when I
can
May-13 58 69 54 54
Jun-13 55 70 55 51
Jul-13 56 70 52 53
Aug-13 57 70 53 53
Sep-13 59 72 53 54
Oct-13 58 69 52 51
Nov-13 56 69 55 51
Dec-13 54 68 54 53
Jan-14 59 74 56 54
Feb-14 56 70 57 52
Mar-14 57 68 56 48
Apr-14 56 69 54 50
May-14 60 72 55 51
Jun-14 55 70 58 52
14Economic Recovery Index
Still Sensitive
% of Irish adults who agree/disagree with the statement (by sex, age, class, Dublin):
“I always buy the lowest price products or services”
Source: Amárach Research, June 2014
June 2014 TOTAL Male Female 15-24 25-34 35-44 45-54 55+ Dublin
ABC1
F50+
C2DE
F50-
Weighted Sample 1000 494 506 169 223 187 156 265 279 477 523
Strongly Agree 26% 22% 30% 29% 29% 28% 27% 18% 27% 24% 27%
Slightly Agree 29% 28% 31% 35% 28% 25% 30% 28% 28% 31% 27%
Neither/Nor 17% 18% 15% 14% 15% 20% 11% 20% 15% 17% 16%
Slightly Disagree 20% 23% 17% 13% 21% 21% 20% 24% 24% 21% 19%
Strongly Disagree 5% 6% 4% 3% 3% 4% 6% 7% 4% 3% 6%
Mood of the Nation
16Economic Recovery Index
The Mood of the Nation 1
Did you experience any of these feelings a lot of the day yesterday?
% saying Yes: April 2009 to June 2014
Source: Amárach Research, June 2014
0%
10%
20%
30%
40%
50%
60%
70%
Apr'09
May
Jun
Jul
Aug
Sept
Oct
Nov
Dec
Jan'10
Feb
Mar
Apr
May
June
July
Aug
Sept
Oct
Nov
Dec
Jan'11
Feb
Mar
Apr
May
June
July
Aug
Sept
Oct
Nov
Dec
Jan'12
Feb
Mar
Apr
May
June
July
Aug
Sept
Oct
Nov
Dec
Jan'13
Feb
Mar
Apr
May
June
July
Aug
Sept
Oct
Nov
Dec
Jan'14
Feb
Mar
Apr
May
June
Enjoyment Happiness Stress Worry
17Economic Recovery Index
The Mood of the Nation 2
Did you experience any of these feelings a lot of the day yesterday?
% saying Yes: April 2009 to June 2014
Source: Amárach Research, June 2014
0%
5%
10%
15%
20%
25%
30%
35%
40%
Apr'09
May
Jun
Jul
Aug
Sept
Oct
Nov
Dec
Jan'10
Feb
Mar
Apr
May
June
July
Aug
Sept
Oct
Nov
Dec
Jan'11
Feb
Mar
Apr
May
June
July
Aug
Sept
Oct
Nov
Dec
Jan'12
Feb
Mar
Apr
May
June
July
Aug
Sept
Oct
Nov
Dec
Jan'13
Feb
Mar
Apr
May
June
July
Aug
Sept
Oct
Nov
Dec
Jan'14
Feb
Mar
Apr
May
June
Anxiety Sadness Pain Anger
18Economic Recovery Index
Changing Moods
Source: Amárach Research, June 2014
June 2014 TOTAL Male Female 15-24 25-34 35-44 45-54 55+ Dublin
ABC1
F50+
C2DE
F50-
Weighted Sample 1000 494 506 169 223 187 156 265 279 477 523
Enjoyment 61% 62% 61% 61% 61% 57% 62% 64% 62% 64% 59%
Happiness 54% 54% 54% 54% 54% 52% 51% 58% 53% 57% 52%
Stress 40% 37% 43% 44% 48% 46% 41% 25% 43% 41% 39%
Worry 35% 31% 38% 41% 42% 40% 34% 22% 35% 33% 36%
Anxiety 30% 28% 32% 36% 32% 32% 30% 22% 28% 27% 32%
Boredom 27% 30% 25% 50% 30% 24% 25% 14% 25% 24% 30%
Physical Pain 22% 21% 24% 20% 21% 22% 23% 25% 23% 20% 24%
Sadness 19% 16% 21% 26% 18% 16% 17% 17% 19% 17% 20%
Anger 14% 15% 12% 16% 17% 19% 9% 9% 17% 13% 14%
Fear 9% 9% 9% 15% 8% 11% 5% 7% 11% 8% 10%
Did you experience any of these feelings a lot of the day yesterday?
% saying Yes: June 2014
Amárach Outlook
20Economic Recovery Index
Dive In
Gradually, gradually comes the recovery – but
did we mention it would be gradual?
Moods are catching, so if the current emotional
and intentional momentum continues we can
expect to see a gradual increase in the share
of consumers more prepared to dive into the
recovery as it becomes more manifest.
We hope this edition of the Economic
Recovery Index has given you some food for
thought about the opportunities that lie ahead
– we’d be happy to share other ideas with you
on how to leverage the new momentum.
For more on the ERI see:
http://www.amarach.com/resources/economic-recovery-index.htm
we ask better questions
so you get better answers
Image: http://yourawakenedself.com/tag/jacob-nordby/
Trends Report
e. info@amarach.com
t. 01 410 5200
w. www.amarach.com
b. www.amarach.com/blog
t. twitter.com/AmarachResearch

Amárach Economic Recovery Index June 2014

  • 1.
    1Economic Recovery Index EconomicRecovery Index An Amárach Research Briefing June 2014 © Amárach Research
  • 2.
    2Economic Recovery Index Mid-SummerMomentum What is the opposite of Seasonal Affective Disorder (SAD)? Whatever it is, we got it in June as the share of adults experiencing a lot of enjoyment in our survey popped through the 60% barrier for the first time since… June last year. This month’s edition of the Economic Recovery Index points to a reassuring positivity in consumer sentiment – some might even say ‘stability’ – that bodes well for the remainder of the year. For the first time since we began the ERI, 25% of consumers say they are more relaxed about spending money – though of course the remainder are still holding on tight to their purses and wallets.
  • 3.
    3Economic Recovery Index TheEmotional Recovery We have been reporting our monthly Economic Recovery Index since April 2009. We set out over five years ago to assess the psychological impact of the recession and to chart our ‘emotional progress’ towards recovery alongside our ‘economic progress’. This report summarises our Economic Recovery Index results from April 2009 to June 2014. The most recent fieldwork was conducted during 16th-23rd June 2014 inclusive. The full data series is on our website – details at the end of this report.
  • 4.
  • 5.
    5Economic Recovery Index Usingthe answers to the question on ‘stages of recovery’ we have created the Economic Recovery Index, which ranges from 0 to 100 (0 = deep recession; 100 = back to peak). Our Index has remained fairly constant through May and June 2014: The Economic Recovery Index Source: Amárach Research, June 2014 0 5 10 15 20 25 30 35 40 Apr'09 Jun July Aug Sept Oct Nov Dec Jan'10 Feb Mar Apr May June July Aug Sept Oct Nov Dec Jan'11 Feb Mar Apr May June July Aug Sept Oct Nov Dec Jan'12 Feb Mar Apr May June July Aug Sept Oct Nov Dec Jan'13 Feb Mar Apr May June July Aug Sept Oct Nov Dec Jan'14 Feb Mar Apr May June the ERI remains well above historic average levels at the mid-year point
  • 6.
    6Economic Recovery Index AMatter of Measurement May ’14: 24% June ’14: 24% May ’14: 32% June ’14: 33% May ’14: 36% June ’14: 35% May ’14: 8% June ’14: 8% May ’14: 0% June ’14: 1% Every month we survey a representative, online sample of 1,000 adults and ask them to tell us which one statement ‘best describes the economic situation in Ireland right now’ (listed below) The percentage thinking ‘things are getting worse’ remains low, but isn’t falling either:
  • 7.
    7Economic Recovery Index ERISummary Table Which one statement ‘best describes the economic situation in Ireland right now’? % choosing each statement: % The economic situation in Ireland is getting worse The economic situation is bad but has stabilized The economic situation is bad but showing a few signs of improvement The economic situation is getting better and showing clear signs of improvement The economic situation is good and almost fully recovered Economic Recovery Index Jun-09 52 27 19 2 0 17.8 Jun-10 33 36 27 3 1 25.3 Jun-11 46 28 23 2 1 20.4 Jun-12 50 29 20 1 0 18.2 Jun-13 37 32 27 4 0 24.5 May-14 24 32 36 8 0 32.4 Jun-14 24 33 35 8 1 32.5 the positive outlook evident from late 2013 has continued into 2014 without abating
  • 8.
    8Economic Recovery Index UnevenRecovery Which one statement ‘best describes the economic situation in Ireland right now’? (by sex, age, class, Dublin) Source: Amárach Research, June 2014 June 2014 TOTAL Male Female 15-24 25-34 35-44 45-54 55+ Dublin ABC1 F50+ C2DE F50- 1000 494 506 169 223 187 156 265 279 477 523 The economic situation in Ireland is getting worse 23% 25% 21% 17% 21% 24% 24% 27% 19% 17% 29% The economic situation is bad but has stabilized 32% 33% 31% 36% 36% 34% 32% 25% 34% 34% 30% The economic situation is bad but showing a few signs of improvement 34% 31% 37% 35% 31% 33% 30% 38% 31% 36% 32% The economic situation is getting better and showing clear signs of improvement 8% 9% 8% 9% 9% 5% 10% 8% 11% 11% 6% The economic situation is good and almost fully recovered from the recession 1% 1% 1% 1% 1% 1% 1% 1% 2% 1% * ERI Score 32.5 31.6 33.4 34.3 32.9 30.3 32.1 32.9 35.7 36.5 28.8
  • 9.
  • 10.
    10Economic Recovery Index ConsumerSentiment Summary Table I % agree strongly/slightly with selected statements: % Ireland will be through the worst of the recession in 12 months time I feel I am financially comfortable enough to make it through the recession I am optimistic in spite of the current economic situation Right now it seems like the recession is affecting other people more than it is affecting me Jun-09 44 51 65 61 Jun-10 42 45 54 50 Jun-11 23 34 47 44 Jun-12 25 36 43 45 Jun-13 33 40 48 46 May-14 38 39 49 45 Jun-14 37 42 50 45 people are feeling a little more optimistic and comfortable – but only a little
  • 11.
    11Economic Recovery Index ConsumerSentiment Summary Table II % agree strongly/slightly with selected statements: % I am more relaxed about spending money than I was a few months ago I am saving a lot more than before because of the recession My main financial priority is to pay off my debts as quickly as possible I would be happy to borrow money from a bank if I need to Jun-09 16 Jun-10 22 24 61 30 Jun-11 14 25 59 23 Jun-12 15 25 55 23 Jun-13 21 28 54 23 May-14 23 23 59 25 Jun-14 25 26 54 26 for the first time since we began, 25% are more relaxed about spending
  • 12.
    12Economic Recovery Index Looseningthe Purse Strings? % of Irish adults who agree/disagree with the statement (by sex, age, class, Dublin): “I am more relaxed about spending money than I was a few months ago” Source: Amárach Research, June 2014 June 2014 TOTAL Male Female 15-24 25-34 35-44 45-54 55+ Dublin ABC1 F50+ C2DE F50- Weighted Sample 1000 494 506 169 223 187 156 265 279 477 523 Strongly Agree 8% 10% 8% 15% 9% 8% 7% 6% 8% 9% 8% Slightly Agree 17% 18% 15% 17% 18% 16% 15% 16% 20% 21% 13% Neither/Nor 18% 20% 17% 16% 23% 14% 14% 21% 20% 19% 18% Slightly Disagree 25% 24% 26% 23% 22% 31% 24% 25% 24% 26% 24% Strongly Disagree 30% 28% 33% 25% 27% 31% 39% 31% 28% 24% 36%
  • 13.
    13Economic Recovery Index ConsumerSentiment Summary Table III % agree strongly/slightly with selected statements: % I always buy the lowest price products or services I am always on the lookout for opportunities to switch to cheaper suppliers I have more choice than before when it comes to products and services I always buy Irish when I can May-13 58 69 54 54 Jun-13 55 70 55 51 Jul-13 56 70 52 53 Aug-13 57 70 53 53 Sep-13 59 72 53 54 Oct-13 58 69 52 51 Nov-13 56 69 55 51 Dec-13 54 68 54 53 Jan-14 59 74 56 54 Feb-14 56 70 57 52 Mar-14 57 68 56 48 Apr-14 56 69 54 50 May-14 60 72 55 51 Jun-14 55 70 58 52
  • 14.
    14Economic Recovery Index StillSensitive % of Irish adults who agree/disagree with the statement (by sex, age, class, Dublin): “I always buy the lowest price products or services” Source: Amárach Research, June 2014 June 2014 TOTAL Male Female 15-24 25-34 35-44 45-54 55+ Dublin ABC1 F50+ C2DE F50- Weighted Sample 1000 494 506 169 223 187 156 265 279 477 523 Strongly Agree 26% 22% 30% 29% 29% 28% 27% 18% 27% 24% 27% Slightly Agree 29% 28% 31% 35% 28% 25% 30% 28% 28% 31% 27% Neither/Nor 17% 18% 15% 14% 15% 20% 11% 20% 15% 17% 16% Slightly Disagree 20% 23% 17% 13% 21% 21% 20% 24% 24% 21% 19% Strongly Disagree 5% 6% 4% 3% 3% 4% 6% 7% 4% 3% 6%
  • 15.
  • 16.
    16Economic Recovery Index TheMood of the Nation 1 Did you experience any of these feelings a lot of the day yesterday? % saying Yes: April 2009 to June 2014 Source: Amárach Research, June 2014 0% 10% 20% 30% 40% 50% 60% 70% Apr'09 May Jun Jul Aug Sept Oct Nov Dec Jan'10 Feb Mar Apr May June July Aug Sept Oct Nov Dec Jan'11 Feb Mar Apr May June July Aug Sept Oct Nov Dec Jan'12 Feb Mar Apr May June July Aug Sept Oct Nov Dec Jan'13 Feb Mar Apr May June July Aug Sept Oct Nov Dec Jan'14 Feb Mar Apr May June Enjoyment Happiness Stress Worry
  • 17.
    17Economic Recovery Index TheMood of the Nation 2 Did you experience any of these feelings a lot of the day yesterday? % saying Yes: April 2009 to June 2014 Source: Amárach Research, June 2014 0% 5% 10% 15% 20% 25% 30% 35% 40% Apr'09 May Jun Jul Aug Sept Oct Nov Dec Jan'10 Feb Mar Apr May June July Aug Sept Oct Nov Dec Jan'11 Feb Mar Apr May June July Aug Sept Oct Nov Dec Jan'12 Feb Mar Apr May June July Aug Sept Oct Nov Dec Jan'13 Feb Mar Apr May June July Aug Sept Oct Nov Dec Jan'14 Feb Mar Apr May June Anxiety Sadness Pain Anger
  • 18.
    18Economic Recovery Index ChangingMoods Source: Amárach Research, June 2014 June 2014 TOTAL Male Female 15-24 25-34 35-44 45-54 55+ Dublin ABC1 F50+ C2DE F50- Weighted Sample 1000 494 506 169 223 187 156 265 279 477 523 Enjoyment 61% 62% 61% 61% 61% 57% 62% 64% 62% 64% 59% Happiness 54% 54% 54% 54% 54% 52% 51% 58% 53% 57% 52% Stress 40% 37% 43% 44% 48% 46% 41% 25% 43% 41% 39% Worry 35% 31% 38% 41% 42% 40% 34% 22% 35% 33% 36% Anxiety 30% 28% 32% 36% 32% 32% 30% 22% 28% 27% 32% Boredom 27% 30% 25% 50% 30% 24% 25% 14% 25% 24% 30% Physical Pain 22% 21% 24% 20% 21% 22% 23% 25% 23% 20% 24% Sadness 19% 16% 21% 26% 18% 16% 17% 17% 19% 17% 20% Anger 14% 15% 12% 16% 17% 19% 9% 9% 17% 13% 14% Fear 9% 9% 9% 15% 8% 11% 5% 7% 11% 8% 10% Did you experience any of these feelings a lot of the day yesterday? % saying Yes: June 2014
  • 19.
  • 20.
    20Economic Recovery Index DiveIn Gradually, gradually comes the recovery – but did we mention it would be gradual? Moods are catching, so if the current emotional and intentional momentum continues we can expect to see a gradual increase in the share of consumers more prepared to dive into the recovery as it becomes more manifest. We hope this edition of the Economic Recovery Index has given you some food for thought about the opportunities that lie ahead – we’d be happy to share other ideas with you on how to leverage the new momentum. For more on the ERI see: http://www.amarach.com/resources/economic-recovery-index.htm
  • 21.
    we ask betterquestions so you get better answers Image: http://yourawakenedself.com/tag/jacob-nordby/
  • 23.
    Trends Report e. info@amarach.com t.01 410 5200 w. www.amarach.com b. www.amarach.com/blog t. twitter.com/AmarachResearch