Downloaded 821 times


![References:
[1] http://www.uml-diagrams.org/
[2] http://en.wikipedia.org/wiki/Activity_diagram
[3] http://www.visual-paradigm.com/VPGallery/diagrams/Activity.html
[4] http://www.ibm.com/developerworks/rational/library/3101. html
Ramakant Soni @ BKBIET Pilani 30
ThanksThanks
4/26/2015 30
[5] http://www.uml-diagrams.org/activity-diagrams-examples.html](https://image.slidesharecdn.com/lecture6-activitydiagram-150426161655-conversion-gate02/85/Activity-diagram-UML-diagram-30-320.jpg)

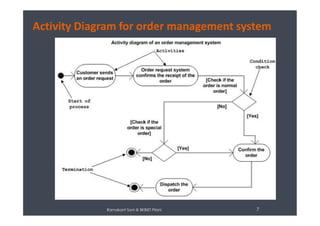
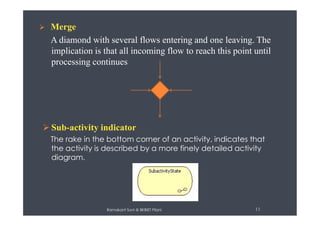
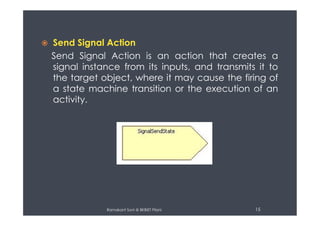
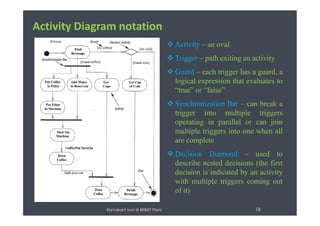
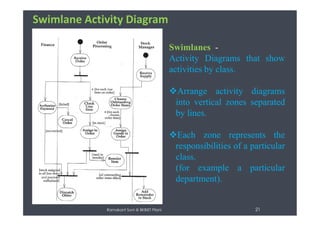
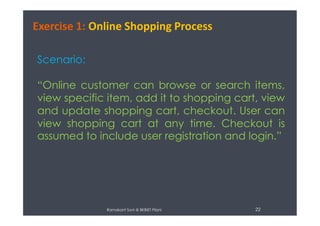
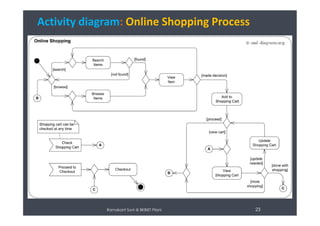
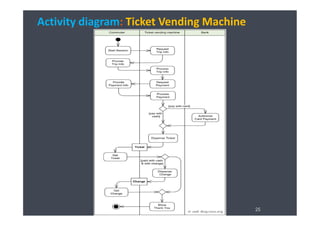
The document describes activity diagrams and their components. It provides examples of activity diagrams for an order management system, online shopping process, a ticket vending machine, resolving software issues, and single sign-on for Google apps. Activity diagrams can show sequential, parallel, and conditional flows between activities of a system through various components like activities, decisions, forks, joins, and swimlanes.