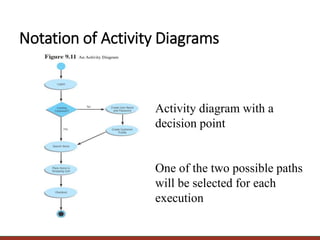
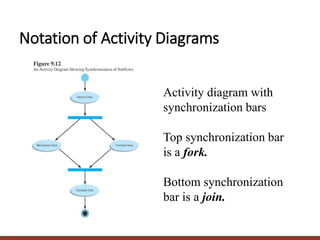
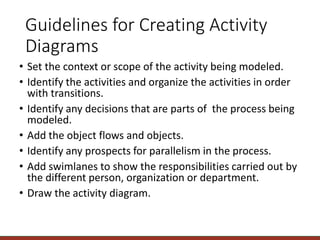
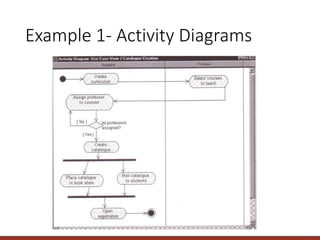
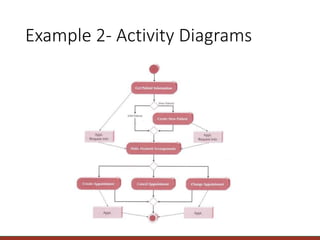
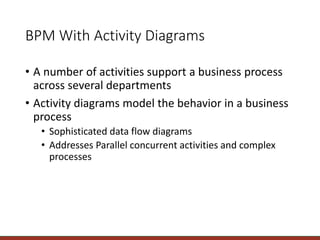
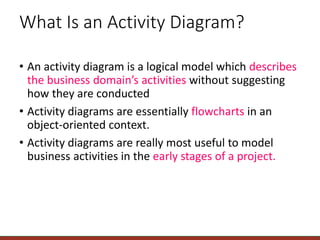
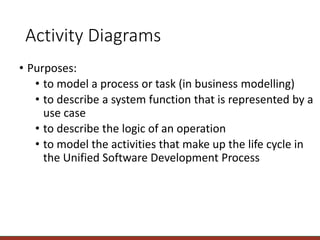
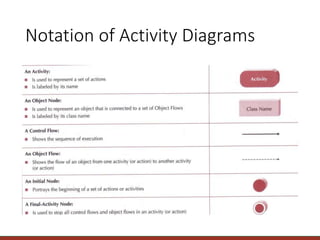
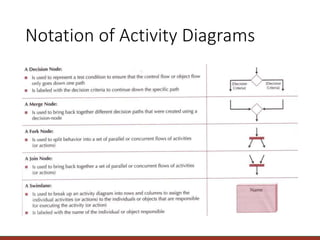
The document provides information on modeling business processes using activity diagrams. It discusses the key elements and notation of activity diagrams including activities, transitions, start/final states, decisions, swimlanes, and parallel activities. Guidelines are provided for creating activity diagrams such as setting the context, identifying activities and organizing them in order, adding decisions, object flows, prospects for parallelism, and swimlanes. An example activity diagram for a dentist office system is described and guidelines are given for developing the diagram and associated use case descriptions.
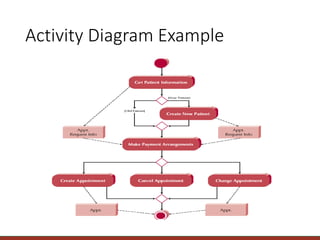

![Notation of Activity Diagrams
• Start state
• black circle
• Decision points
• diamond
• Guard conditions
• in square brackets
• Final state
• black circle in white circle
[available]
[not available]
Display customer
panel
select drink
Display
available](https://image.slidesharecdn.com/bpm-avtivitydiagram-230212082619-687723a2/85/BPM-Activity-diagram-pptx-10-320.jpg)