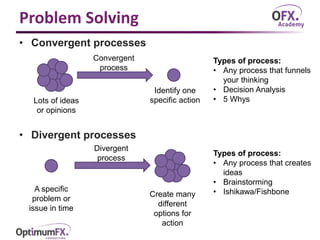
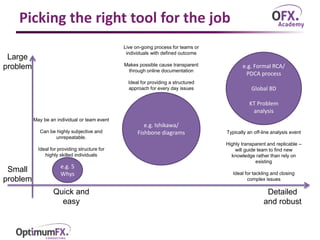
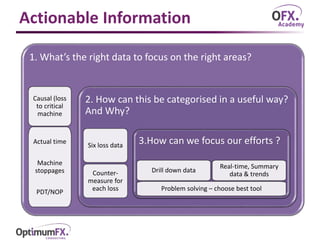
Part of OFX Academy Course: Improving Line Performance
http://academy.optimumfx.com/course/improving-line-performance/
Improving Packaging Line Performance –Using the correct Data and Drill Down Analysis
Part of OFX Academy Course: Improving Line Performance
http://academy.optimumfx.com/course/improving-line-performance/
Improving Packaging Line Performance –Using the correct Data and Drill Down Analysis
Part of OFX Academy Course: Improving Line Performance
http://academy.optimumfx.com/course/improving-line-performance/
Improving Packaging Line Performance –Using the correct Data and Drill Down Analysis
This slide presentation reviews the Six Sigma DMAIC Fundamentals. It provides a real Case Study on how the process was utilized to develop substantial financial improvements.
The document discusses key performance indicators (KPIs) for maintenance practices, distinguishing between leading and lagging KPIs. It provides examples of leading KPIs like mean time between failure (MTBF) and percentage of planned work completed, and lagging KPIs like maintenance costs. The document advises mapping processes to identify where KPIs are needed, ensuring metrics drive the right behaviors, and developing scorecards to track KPIs at different levels.
Line Crew Optimisation is a process that reviews and optimises the established flow patterns, links process steps in order to minimise cycle times and travel distance, and eliminates crossover points in order to achieve a continuous flow process
This document discusses how to increase production time by 20% through focusing on improving overall equipment effectiveness (OEE). It emphasizes that sustainable process improvement requires having good information, focus, and effective actions. The information used should accurately track losses like availability, performance, and quality. Focus involves regularly reviewing data at different intervals and prioritizing the biggest losses. Effective actions are those that are appropriate for each management level and directly address losses through techniques like root cause analysis. A successful process audits the information, focus, and actions used and continually works to improve them.
Part of OFX Academy Course: Improving Line Performance
http://academy.optimumfx.com/course/improving-line-performance/
Improving Packaging Line Performance –Using the correct Data and Drill Down Analysis
Part of OFX Academy Course: Improving Line Performance
http://academy.optimumfx.com/course/improving-line-performance/
Improving Packaging Line Performance –Using the correct Data and Drill Down Analysis
This slide presentation reviews the Six Sigma DMAIC Fundamentals. It provides a real Case Study on how the process was utilized to develop substantial financial improvements.
The document discusses key performance indicators (KPIs) for maintenance practices, distinguishing between leading and lagging KPIs. It provides examples of leading KPIs like mean time between failure (MTBF) and percentage of planned work completed, and lagging KPIs like maintenance costs. The document advises mapping processes to identify where KPIs are needed, ensuring metrics drive the right behaviors, and developing scorecards to track KPIs at different levels.
Line Crew Optimisation is a process that reviews and optimises the established flow patterns, links process steps in order to minimise cycle times and travel distance, and eliminates crossover points in order to achieve a continuous flow process
This document discusses how to increase production time by 20% through focusing on improving overall equipment effectiveness (OEE). It emphasizes that sustainable process improvement requires having good information, focus, and effective actions. The information used should accurately track losses like availability, performance, and quality. Focus involves regularly reviewing data at different intervals and prioritizing the biggest losses. Effective actions are those that are appropriate for each management level and directly address losses through techniques like root cause analysis. A successful process audits the information, focus, and actions used and continually works to improve them.
Cloud ERP Software & Systems with Netsuite Implementation SydneyIntegrisuite
Integrisuite is a top NetSuite Implementation Sydney reseller and solution provider. Our NetSuite consulting experts can implement your ecommerce solutions. We basically provides Sales, implementation, integration and customization of NetSuite, Salesforce and other cloud management software solutions.
More at: https://integrisuite.com/
This document outlines the key knowledge, skills, and responsibilities required of proactive maintenance technicians. It discusses topics like maintenance best practices, preventive and predictive maintenance, planning and scheduling, execution, safety compliance, technical knowledge, and leadership. The document emphasizes that technicians should have defined roles and responsibilities, follow repeatable processes, and use metrics to monitor performance and drive improvement. Overall, it provides a comprehensive overview of the requirements to be a successful proactive maintenance technician.
Learn the importance of defining performance metrics and how you can utilize them in eMaint X3. Gil Acosta discusses which metrics are key measures of success for any maintenance operation, and how to determine which metrics are important for your organization. He then discusses how these measures can be derived from the data within your CMMS, and what types of data will drive performance and results.
The document discusses quality improvement tools including Ishikawa's basic seven tools and seven new tools. Ishikawa's tools are process maps, check sheets, histograms, scatter plots, control charts, cause and effect diagrams, and Pareto charts. They are used at different stages to identify problems, gather data, and determine relationships between variables. The seven new tools include affinity diagrams, interrelationship digraphs, tree diagrams, prioritization matrices, matrix diagrams, process decision program charts, and activity network diagrams. They are used for more creative and logical problem solving. Other mentioned tools are spider graphs, dashboards, and balanced scorecards.
This document discusses the concept of zero defects in manufacturing. It begins with an introduction to zero defects as a stretch goal to have no defects rather than just reducing defects over time. It then discusses some examples of companies that have achieved low defect rates. Several tools for achieving zero defects are mentioned, including mistake-proofing, statistical process control, design of experiments, and poka-yoke systems. The document argues that achieving very high quality levels like 99.99% defect-free can provide significant financial benefits in terms of reduced rework costs and increased profitability and competitiveness. It concludes that a zero defects approach adds value for customers and the business.
The document outlines the overall process flow mapping process which includes defining the scope, creating current and future state maps, and developing an implementation plan. It provides details on each step, including identifying the process and stakeholders, mapping the current "as is" process, analyzing for improvements, and mapping an ideal future "to-be" process. Standard symbols and templates are suggested to create clear and consistent process flow maps. Examples of process maps are also included.
Repeatable, effective maintenance procedures are seen as “not required” however this couldn’t from the truth. Over my career I have seen thousands of examples of human variation creating equipment failure at the wrong time. We as humans are built to produce variation in almost everything we do. Most people deny this human variation exist however when I ask a manager if they ever could not find their car keys they look at me sheepishly and say “yes, great point”.
Many companies honestly believe there maintenance staff are paid to “know how to do it” without a procedure with specifications, step by step instructions, etc. What if a maintenance employee does “know how to do it” every-time? One must take into consideration their skill level, current state mind, and current working condition, in order to mitigate human error. In addition, what would happen if new information presents itself based on failure data? The only way to insure this new information is used effectively would be to write or change a procedure.
Well-designed maintenance procedures will mitigate human induced failures and allow for continuous improvement to occur naturally.
Overall Equipment Effectiveness (OEE) measures actual production output against theoretical maximum output over a given time period. Losses are categorized into availability, performance, and quality, known as the "Six Big Losses": planned downtime, breakdowns, minor stops, speed losses, production rejects, and start-up rejects. Measuring these losses provides data to target improvement areas and increase equipment effectiveness.
Greg Perry, a consultant from eMaint, presented on how asset management systems can help drive operational excellence. He discussed that a CMMS (computerized maintenance management system) is software that tracks assets, work orders, parts, and other maintenance-related functions. It allows organizations to extend the life of assets, perform proactive maintenance, reduce costs, improve customer satisfaction and work processes, and meet regulatory standards. The presentation included case studies of different organizations that achieved benefits like increased visibility, accountability and productivity by implementing a CMMS.
The document discusses the principles and benefits of 5S, a methodology used in total quality management. The 5 steps of 5S are Sort, Set in Order, Shine, Standardize, and Sustain. These steps involve organizing a workspace by removing unnecessary items, labeling necessary items, cleaning, training employees on the system, and sustaining the organized workspace. Benefits of 5S include improved quality, productivity, safety, employee morale, and company image by creating an organized, efficient workspace that minimizes errors and waste.
The document summarizes key concepts in lean systems and production. It discusses eliminating waste to add value for customers and improve productivity. Specific lean tools are outlined, including 5S, quick changeover, pull production, total productive maintenance, poka-yoke, cellular layouts, and value stream mapping to visualize and improve workflow. The goal is to continuously improve by removing non-value added activities, reducing lead times and inventory, and increasing throughput.
The document summarizes a Lean Six Sigma project to decrease the cycle time from arrival to receiving a medical evaluation (RME) for emergency department patients with an acuity level of 3-5. The current median time is 1 hour and 34 minutes with significant non-value added time. The project aims to reduce the median time to 37 minutes initially and ultimately 18 minutes by streamlining the process and eliminating waste. Key changes proposed include parallel registration and clinical assessment, pushing patients to the next step rather than pulling from waiting rooms, and eliminating unnecessary waiting between steps. Next steps outlined are analyzing the detailed process flow, conducting Kaizen events to implement changes in phases, and ultimately eliminating all wasted steps.
The document discusses the control phase of the Six Sigma DMAIC process. The control phase focuses on implementing and maintaining the improvements identified in the improve phase. Key activities include developing a control plan, validating the solution, implementing statistical process control charts, developing an implementation plan, performing a cost-benefit analysis, formally closing the project, and celebrating the team's success. The document also provides details on various types of statistical process control charts that can be used to monitor processes.
In this report we have analyzed the causes of job failures and also listed techniques which can be applied to reduce same so as to improve operational performance of jobs. Note that this list is not prioritized. Some of the techniques may work in one instance, while others could be applied better in another situation.
Ask the Expert: Lean Leadership - Can We Talk About OEE?MileyJames
This document discusses how to calculate Overall Equipment Effectiveness (OEE) and factors like set-up time, utilization, efficiency, and first-pass yield. It recommends measuring set-up times separately to better understand their impact on machine throughput. An example calculation shows an OEE of 59% based on 75% utilization, 90% efficiency, and 88% first-pass yield. It outlines collecting OEE data by machine to identify improvement opportunities, educating operators, and holding supervisors accountable for addressing issues to improve effective use of resources.
The document discusses living in the present moment and provides tips to increase presence. It defines the present as "now" rather than the past or future. Most people spend too much time thinking about the past and future rather than being fully engaged in the current moment. To increase presence, one should focus attention on what is happening now without distraction, tune out inner dialogue, and be mindful of thoughts, emotions, and the present sensory experience. Practices like meditation, conscious breathing, and full engagement in current tasks can help anchor one in the present. Being present reportedly increases fulfillment, flow, and stress reduction while enhancing relationships and performance.
Key Performance Indicators measure the organisational performances that are most critical for the current and future success of an organisation
The session will provide an outline of the types of KPI’s available and the pros and cons of each
KPIs are a key tool for a leader to help make decisions and guide their teams back on track
1. 1-1 meetings provide benefits for individuals, line managers, and organizations by allowing employees to better understand their roles and performance, managers to coach employees and set objectives, and organizations to identify training needs and succession planning.
2. The 1-1 communication model addresses job responsibilities, performance feedback, individual needs, work unit objectives and results, and organizational vision, mission, and values to empower and engage employees.
3. Recommended frequencies for 1-1 meetings range from monthly for senior managers and middle managers, to quarterly for team leaders and associates, with more informal weekly check-ins for senior management.
This document discusses neurological levels and how to create sustainable behavior change. It presents a model showing that behavior is just the visible part of an iceberg, with deeper levels being purpose, identity, beliefs, values, capabilities, and environment. These deeper levels must be addressed to create lasting change. The document advises establishing desire, providing training to build skills, and aligning actions to impact the neurological levels and drive new behaviors. Understanding this model allows one to motivate teams through creating gaps and realize small personal shifts can create large behavior changes.
The document describes the steps to construct a value stream map (VSM). It involves defining the current state map by gathering information on physical and information flows, cycle times, bottlenecks and defects. The future state map is then created by mapping an improved process and an implementation plan is made to achieve this. Key steps include identifying the product family, start/end points, gathering data on times, flows, inspections and linking this to create a current state map with production lead times. Future state suggestions aim to reduce changeovers and level production.
The aim of this session is to:
Be able to apply the GROW model to coaching sessions
Use the GROW model for effective, structured methodology for goal-setting and problem-solving
This document provides an overview of Westside High School for new students. It highlights that Westside has around 3,100 students, entertaining teachers, a large cafeteria with vending machines and vendors, a renowned dance company called Inertia that has won trophies, three theaters including a Black Box, no school uniform so students can dress how they want, an outdoor courtyard for lunch, and great athletic facilities. The school looks forward to meeting new students.
This document discusses using the RACI methodology to define clear roles and responsibilities. RACI assigns the roles of accountable, responsible, consulted, and informed to activities and decisions. It clarifies who is accountable for ensuring tasks are completed, who is responsible for doing the tasks, who must be consulted, and who must be informed. Developing a RACI chart is a 5-step process that identifies key activities, roles, and assigns responsibilities. Benefits include clarifying accountability, pushing responsibilities to lower levels, eliminating overlaps, and increasing productivity through well-defined roles.
One Point Lessons (OPLs) are short, visual presentations on a single task that can be explained in about 10 minutes. They are detailed on one or two pages using diagrams, photographs or drawings. OPLs are used to provide vital instructions for tasks at the workplace and are generated and used at the point of need. An example is provided of an OPL created to address frequent stoppages on a production line caused by operators not understanding how to change an empty cleaning fluid drum. The OPL clearly outlines the steps to acknowledge the error message and replace the empty drum. OPLs help improve performance, efficiency and quality by ensuring key work instructions are available when needed.
The document discusses the GROW model of coaching which involves setting goals, checking current reality, exploring options, and determining the way forward. It emphasizes that coaching builds awareness, responsibility, and self-belief through transformational thinking like exploring new boundaries and dreaming big. Coaching uses the GROW model and SMART goals to help set short and long-term goals, understand the current situation, identify alternative strategies, and commit to a plan of action.
Sage Fixed Assets Accounting for Sage 100Net at Work
This webinar discusses Sage Fixed Assets software. It provides an overview of the key features and benefits of the software, including improved data integrity, fraud prevention, audit preparation, and compliance. The webinar reviews different versions of the software, reports, and additional modules for asset tracking and planning. Presenters are available to answer questions from webinar participants.
Optimizing Regulatory Compliance with Big DataCloudera, Inc.
The document discusses optimizing regulatory compliance through next-generation data management and visualization. It outlines trends like increasing data volumes, sources, and regulatory requirements that are challenging traditional compliance architectures. A modern approach is proposed using big data platforms to ingest diverse data sources, perform automated preparation and analysis, and enable flexible reporting and visualization. This can help reduce costs, speed reporting, and improve auditability versus manual spreadsheet-based processes. Examples show how data preparation platforms combined with data storage, analytics, and visualization tools help financial firms more efficiently meet regulatory obligations like the SEC's Form PF.
Advanced Analytics for Asset Management with IBMPerficient, Inc.
Extreme volumes of machine data, such as process control logs, asset inspection records and part quality data are created each day. Companies must analyze patterns and interactions within this data to create a total view of their operational processes.
In this webinar, our experts discussed how IBM is enabling companies to proactively address maintenance and asset management challenges with advanced analytics solutions:
-Determine root causes of failure based on usage and wear characteristics
-Analyze component and environmental data to reduce time to identify quality issues
-Identify conditions to optimize maintenance and inventory management
-Monitor, maintain and optimize assets for better supply chain availability
Our webinar covered an introduction to predictive maintenance, analytics use cases for asset management, and IBM Maximo integration with analytics solutions.
This document provides an overview of key aspects of data preparation and processing for data mining. It discusses the importance of domain expertise in understanding data. The goals of data preparation are identified as cleaning missing, noisy, and inconsistent data; integrating data from multiple sources; transforming data into appropriate formats; and reducing data through feature selection, sampling, and discretization. Common techniques for each step are outlined at a high level, such as binning, clustering, and regression for handling noisy data. The document emphasizes that data preparation is crucial and can require 70-80% of the effort for effective real-world data mining.
This document provides an introduction and overview of a course on data warehousing and data mining. It discusses the need for data warehousing to help organizations make intelligent decisions based on analyzing large amounts of integrated historical data. A data warehouse combines data from multiple sources and stores it in a way that supports ad-hoc querying. It allows knowledge workers to analyze patterns and trends in the data to address business questions. The document contrasts this with traditional transaction systems and management information systems.
You are already spending time and money managing systems capacity, performance, and estimating future needs. But are you spending it wisely? Are you getting the level of results from your investment that you really need? Can you prove it?
Having underutilized or idle resources can be just as harmful to your business as not having enough processing capacity or network bandwidth. Failure to do effective capacity planning becomes clearly visible to your customers, especially your internal customers.
The good news is that the return on investment of implementing capacity management and capacity planning is provable.
Watch this on-demand webinar to learn:
• The core requirements that need to be part of your capacity management tools
• Integrating capacity management into ServiceNow environments
• Ways to demonstrate these benefits to your company
Gain New Insights by Analyzing Machine Logs using Machine Data Analytics and BigInsights.
Half of Fortune 500 companies experience more than 80 hours of system down time annually. Spread evenly over a year, that amounts to approximately 13 minutes every day. As a consumer, the thought of online bank operations being inaccessible so frequently is disturbing. As a business owner, when systems go down, all processes come to a stop. Work in progress is destroyed and failure to meet SLA’s and contractual obligations can result in expensive fees, adverse publicity, and loss of current and potential future customers. Ultimately the inability to provide a reliable and stable system results in loss of $$$’s. While the failure of these systems is inevitable, the ability to timely predict failures and intercept them before they occur is now a requirement.
A possible solution to the problem can be found is in the huge volumes of diagnostic big data generated at hardware, firmware, middleware, application, storage and management layers indicating failures or errors. Machine analysis and understanding of this data is becoming an important part of debugging, performance analysis, root cause analysis and business analysis. In addition to preventing outages, machine data analysis can also provide insights for fraud detection, customer retention and other important use cases.
The document discusses the costs associated with network downtime for businesses. It identifies three main cost areas: lost employee productivity, lost business profits, and reduced IT staff productivity. It provides calculations for quantifying these costs and shows how reactive troubleshooting methods are time-consuming. Retrospective Network Analysis allows organizations to analyze network traffic data from the past to more quickly identify and resolve issues, reducing downtime costs by an estimated 57%.
The document discusses three topics:
1. Human Resource Management - How HR analytics can help resolve challenges in HR by making it more data-driven.
2. Water Management - New digital technologies can monitor water usage and help optimize water resource management.
3. Manufacturing Industry - Advanced analytics in manufacturing can help with predictive maintenance, quality testing, supply chain optimization, and product optimization to reduce costs and improve processes.
This document discusses realizing business value from open source data and intelligence. It provides an example of using sentiment analysis on 500,000 Enron emails to prioritize analysis. Key findings include highlighting 801 weeks for manual review based on negative sentiment shifts. Lessons learned are that sentiment analysis can drastically reduce analysis timelines and the technique has multiple potential uses for intelligence analysis, e-discovery, brand management, and social media analysis.
This document contains confidential information belonging to AAUM. Any disclosure of this confidential information would damage AAUM. AAUM retains ownership of all confidential information contained in this document, regardless of the media. This document contains claim analytics data that AAUM considers confidential.
Trillium software garp march 2014 presentation bfast briefingTrillium Software
This document discusses the challenges financial firms face with increasing data and regulatory requirements. It notes the growing data volumes and need for better data quality to avoid regulatory issues. However, IT is often a bottleneck, unable to provide the flexibility and visibility needed. The document advocates establishing data governance with clear roles and standards, profiling data to define issues, and providing transparency through dashboards. It describes a case study where a bank implemented a self-service data assurance system using business rules to enable risk teams to validate data for monthly regulatory submissions independently of IT, with measurable process improvements. Overall it promotes business empowerment and access to data as critical for effective governance.
This document outlines a Six Sigma project to optimize an article library. The project aims to improve article trustworthiness by 80%, discard 60% of duplicate and out-of-date articles, decrease article retrieval time to 8 minutes or less, decrease costs by 20%, and increase customer satisfaction by 35%. Baseline data found the average article retrieval time was 11.6 minutes with a process sigma level of 3.195. Analysis identified duplicate articles, out-of-date articles, and untrustworthy articles as causes of long retrieval times. Improvement strategies included digitizing articles, adding expiration dates, and verifying article trustworthiness to comply with specifications.
Big Data Tools PowerPoint Presentation SlidesSlideTeam
The document discusses big data analysis requirements and tools. It covers where big data comes from both internally and externally. It then discusses tools for analyzing big data such as BI tools, in-database analytics, Hadoop, decision management, and discovery tools. Techniques for analyzing big data like classification tree analysis, genetic algorithms, regression analysis, machine learning, and sentiment analysis are also covered. The key benefits and a successful implementation roadmap for big data in an organization are summarized.
Data Con LA 2022 - Why Data Quality vigilance requires an End-to-End, Automat...Data Con LA
Curtis ODell, Global Director Data Integrity at Tricentis
Join me to learn about a new end-to-end data testing approach designed for modern data pipelines that fills dangerous gaps left by traditional data management tools—one designed to handle structured and unstructured data from any source. You'll hear how you can use unique automation technology to reach up to 90 percent test coverage rates and deliver trustworthy analytical and operational data at scale. Several real world use cases from major banks/finance, insurance, health analytics, and Snowflake examples will be presented.
Key Learning Objective
1. Data journeys are complex and you have to ensure integrity of the data end to end across this journey from source to end reporting for compliance
2. Data Management tools do not test data, they profile and monitor at best, and leave serious gaps in your data testing coverage
3. Automation with integration to DevOps and DataOps' CI/CD processes are key to solving this.
4. How this approach has impact in your vertical
Real Time Business Platform by Ivan Novick from PivotalVMware Tanzu Korea
This document discusses Pivotal's real time business platform for maximizing the value of data investments. It recommends identifying business problems with high ROI potential, then focusing data solutions on high-speed ingestion, consolidation, real-time queries, and analytics to drive real-time insights. The platform combines Gemfire for fast transactions with Greenplum for analytics. Use cases discussed include predictive maintenance, fraud detection, and recommendation engines. The platform provides a complete solution from data capture and analytics to application integration.
1. Data analysis can improve business processes by identifying gaps and inefficiencies. Analyzing a company's purchase order and accounts payable data revealed $322 million of open purchase orders that had actually been paid, reducing liability.
2. Fuel card usage analysis found fuel costs increased 15% from 2013 to 2014 despite only a 3% rise in miles driven, suggesting non-compliant fuel card usage. Data on fuel purchases, miles driven, and assigned vehicles was analyzed to identify the cause.
3. Effective data analysis requires understanding the purpose, assessing the relevant data, using the right tools, identifying issues, and improving processes based on insights. This allows risks to be mitigated and more informed management decisions.
SIC (Short Interval Control) is a structured process to regularly review performance data and identify opportunities to improve production effectiveness and efficiency. It involves:
1. Checking performance at short intervals (e.g. daily or every half hour) and making necessary corrections, to prevent small problems from becoming big ones.
2. Controlling process inputs to control outputs and meet goals like increased output, reduced costs and defects.
3. Having team members regularly look back at past performance, plan next actions, and implement plans to continuously improve performance.
The benefits of SIC include increased output, effectiveness, improvement speed, and employee engagement through localized focus and data-driven decision making.
Situational leadership proposes that there is no single best leadership style, and that the most effective leaders adapt their style to fit the development level of the individual or group they are leading. It identifies four leadership styles - directing, coaching, supporting, and delegating - that should be applied based on followers' competence and commitment levels. The directing style provides close supervision, coaching involves more explanation and support, supporting emphasizes praise and facilitation, and delegating turns over responsibility. Matching leadership style to followers' stage of development maximizes their performance.
A ‘Continuous Improvement culture’ is one where both leaders and front line workers constantly drive for improvement, which will be evident from the ‘work habits’
What gets measured, gets managed! What gets managed can be maintained and improved upon. Auditing ensures that the meetings operate at a consistent high standard.
It’s important to get the right people doing the right jobs. Sometimes great people get poor results because they’re doing the wrong job. Get the maximum results with the resources that you have right now.
This document provides the steps and estimated times for a 2L PET cold caustic CIP (clean-in-place) changeover. It involves 15 steps including draining and flushing the filler, filling and draining the carbo-cooler tank twice, switching to a CO2 supply, flushing the filler with product, and conducting a test run to start production. The total estimated time is 1 hour and 40 minutes with the CIP itself taking approximately 45 minutes.
This document discusses process mapping and the differences between process flow mapping and value stream mapping. It defines a process as a group of logically related activities and tasks that transform inputs into specified outputs. Process flow mapping visually depicts the steps in a process, how inputs become outputs, and links to other processes. Value stream mapping considers the whole value stream, identifies non-value added steps between processes, and enables long-term planning, while process flow mapping focuses on a single process, identifies non-value added within the process, and enables shorter-term tactical planning. An example of a process flow map for checking in a paper-based trailer is provided.
Best practices for project execution and deliveryCLIVE MINCHIN
A select set of project management best practices to keep your project on-track, on-cost and aligned to scope. Many firms have don't have the necessary skills, diligence, methods and oversight of their projects; this leads to slippage, higher costs and longer timeframes. Often firms have a history of projects that simply failed to move the needle. These best practices will help your firm avoid these pitfalls but they require fortitude to apply.
HOW TO START UP A COMPANY A STEP-BY-STEP GUIDE.pdf46adnanshahzad
How to Start Up a Company: A Step-by-Step Guide Starting a company is an exciting adventure that combines creativity, strategy, and hard work. It can seem overwhelming at first, but with the right guidance, anyone can transform a great idea into a successful business. Let's dive into how to start up a company, from the initial spark of an idea to securing funding and launching your startup.
Introduction
Have you ever dreamed of turning your innovative idea into a thriving business? Starting a company involves numerous steps and decisions, but don't worry—we're here to help. Whether you're exploring how to start a startup company or wondering how to start up a small business, this guide will walk you through the process, step by step.
Starting a business is like embarking on an unpredictable adventure. It’s a journey filled with highs and lows, victories and defeats. But what if I told you that those setbacks and failures could be the very stepping stones that lead you to fortune? Let’s explore how resilience, adaptability, and strategic thinking can transform adversity into opportunity.
IMPACT Silver is a pure silver zinc producer with over $260 million in revenue since 2008 and a large 100% owned 210km Mexico land package - 2024 catalysts includes new 14% grade zinc Plomosas mine and 20,000m of fully funded exploration drilling.
Discover timeless style with the 2022 Vintage Roman Numerals Men's Ring. Crafted from premium stainless steel, this 6mm wide ring embodies elegance and durability. Perfect as a gift, it seamlessly blends classic Roman numeral detailing with modern sophistication, making it an ideal accessory for any occasion.
https://rb.gy/usj1a2
The APCO Geopolitical Radar - Q3 2024 The Global Operating Environment for Bu...APCO
The Radar reflects input from APCO’s teams located around the world. It distils a host of interconnected events and trends into insights to inform operational and strategic decisions. Issues covered in this edition include:
Taurus Zodiac Sign: Unveiling the Traits, Dates, and Horoscope Insights of th...my Pandit
Dive into the steadfast world of the Taurus Zodiac Sign. Discover the grounded, stable, and logical nature of Taurus individuals, and explore their key personality traits, important dates, and horoscope insights. Learn how the determination and patience of the Taurus sign make them the rock-steady achievers and anchors of the zodiac.
Unveiling the Dynamic Personalities, Key Dates, and Horoscope Insights: Gemin...my Pandit
Explore the fascinating world of the Gemini Zodiac Sign. Discover the unique personality traits, key dates, and horoscope insights of Gemini individuals. Learn how their sociable, communicative nature and boundless curiosity make them the dynamic explorers of the zodiac. Dive into the duality of the Gemini sign and understand their intellectual and adventurous spirit.
The Steadfast and Reliable Bull: Taurus Zodiac Signmy Pandit
Explore the steadfast and reliable nature of the Taurus Zodiac Sign. Discover the personality traits, key dates, and horoscope insights that define the determined and practical Taurus, and learn how their grounded nature makes them the anchor of the zodiac.
Digital Marketing with a Focus on Sustainabilitysssourabhsharma
Digital Marketing best practices including influencer marketing, content creators, and omnichannel marketing for Sustainable Brands at the Sustainable Cosmetics Summit 2024 in New York
Top 10 Free Accounting and Bookkeeping Apps for Small BusinessesYourLegal Accounting
Maintaining a proper record of your money is important for any business whether it is small or large. It helps you stay one step ahead in the financial race and be aware of your earnings and any tax obligations.
However, managing finances without an entire accounting staff can be challenging for small businesses.
Accounting apps can help with that! They resemble your private money manager.
They organize all of your transactions automatically as soon as you link them to your corporate bank account. Additionally, they are compatible with your phone, allowing you to monitor your finances from anywhere. Cool, right?
Thus, we’ll be looking at several fantastic accounting apps in this blog that will help you develop your business and save time.
Anny Serafina Love - Letter of Recommendation by Kellen Harkins, MS.AnnySerafinaLove
This letter, written by Kellen Harkins, Course Director at Full Sail University, commends Anny Love's exemplary performance in the Video Sharing Platforms class. It highlights her dedication, willingness to challenge herself, and exceptional skills in production, editing, and marketing across various video platforms like YouTube, TikTok, and Instagram.
Anny Serafina Love - Letter of Recommendation by Kellen Harkins, MS.
Actionable information 3
1. Improving Packaging Line Performance –
Using the correct Data and Drill Down Analysis
Actionable Information III
www.optimumfx.com
2. Data…Data…Data == Good Information
Excessive data – Lack of information The right data – with drill down analysis
X
Actionable Information
3. Actionable Information
1. What’s the right data to focus on the right areas?
Causal (loss
to critical
machine
Actual time
Machine
stoppages
PDT/NOP
2. How can this be categorised in a useful way?
And Why?
Six loss data
Counter-
measure for
each loss
3.How can we focus our efforts ?
?
4. Site
Line
Loss
Drill Down – What it should be
Categorise
Changeover
Review Loss
vs Target
Cause
Machine
Fault
Review
Changeover
Effectiveness
Critical
Machine
Actual vs
Rated Speed
Review Line
Balance
Categorise
Reject Loss
Review Loss
vs Target
5. Data Drill Down - Tactical LineView
Six loss
Cause pareto
Machine causal loss
Machine fault
OEE vs Total Loss
OEE
60%
LineView loss screen
LineView status screens
6. Data Drill Down - Strategic in LVR
Breakdowns and Minor Stops DrilldownCausal Loss Pareto
Loss Trend
Faults Pareto
Fault Trend
7. Actionable Information
1. What’s the right data to focus on the right areas?
Causal (loss
to critical
machine
Actual time
Machine
stoppages
PDT/NOP
2. How can this be categorised in a useful way?
And Why?
Six loss data
Counter-
measure for
each loss
3.How can we focus our efforts ?
Drill down data
Real-time, Summary
data & trends
?
8. Problem Solving
• Convergent processes
• Divergent processes
Lots of ideas
or opinions
Convergent
process
A specific
problem or
issue in time
Divergent
process
Create many
different
options for
action
Identify one
specific action
Types of process:
• Any process that funnels
your thinking
• Decision Analysis
• 5 Whys
Types of process:
• Any process that creates
ideas
• Brainstorming
• Ishikawa/Fishbone
9. Picking the right tool for the job
Quick and
easy
Detailed
and robust
Large
problem
Small
problem
e.g. 5
Whys
May be an individual or team event
Can be highly subjective and
unrepeatable.
Ideal for providing structure for
highly skilled individuals
e.g. Ishikawa/
Fishbone diagrams
Live on-going process for teams or
individuals with defined outcome
Makes possible cause transparent
through online documentation
Ideal for providing a structured
approach for every day issues
e.g. Formal RCA/
PDCA process
Global 8D
KT Problem
analysis
Typically an off-line analysis event
Highly transparent and replicable –
will guide team to find new
knowledge rather than rely on
existing
Ideal for tackling and closing
complex issues
10. Trended Data - Event in Time
Data Analysis
• Downtime loss average trended up
from around 250mins per week to
around 350mins per week
• This happened around week
commencing 2nd of February
• What changed just before this
week?
Problem Solving Process
• Convergent thinking
• Suggested tool – 5 Whys
11. Trended Data – Incremental Increase
Data Analysis
• Downtime loss average
incrementally trended up from
around less than 200mins per week
to over 600mins per week
• This started happening from 2nd
week of March and progressively got
worse
Problem Solving Process
• Divergent thinking
• Suggested tool – Ishikawa/Fishbone
12. Trended Data – Consistent High Loss
Data Analysis
• Overall the Loss has reduced from
around 1000mins per week to
around 700mins per week,
however it is still above target,
consistently high and does not
show an overall downward trend
Problem Solving Process
• Divergent and then Convergent
thinking
• Suggested tool(s) – Global 8D or KT
Problem Analysis
13. Actionable Information
1. What’s the right data to focus on the right areas?
Causal (loss
to critical
machine
Actual time
Machine
stoppages
PDT/NOP
2. How can this be categorised in a useful way?
And Why?
Six loss data
Counter-
measure for
each loss
3.How can we focus our efforts ?
Drill down data
Real-time, Summary
data & trends
Problem solving – choose best tool
Editor's Notes
Overall introduction:
Check in on time frame – 3 hrs ish – short break at some point
I’m where a different cap for next few hours – not Mr LineView – although there are some references here
Some / quite a bit you may already know – apologies, such eggs, etc
Empty your cup
Be here fully
Be interactive – up for challenge, ask questions as we go, you’ll get out what you put in
Secondary outcome:
Agree how to go allocate to fault level (for now)
40% loss - what kind of problems, where, when, what exactly happened. Getting better or worse.
Top level - Answer series of questions as glue
Add new slide as top level overview – include vision
Get prepared with some real data on faults, loss, etc
Start with a mini session on LineView
What’s the right data ensure we focus on the right areas?
How can this be categorised in a useful way?
How should the data be logged to make it most useful?
How can we drill down to focus our efforts?
How is machine data useful (over and above loss data)?
What tools apply to what kind of problems?