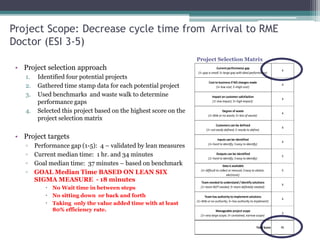
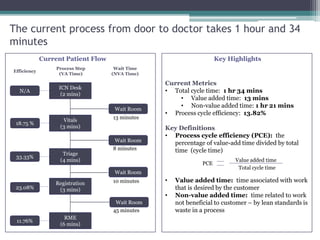
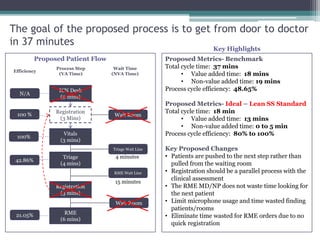
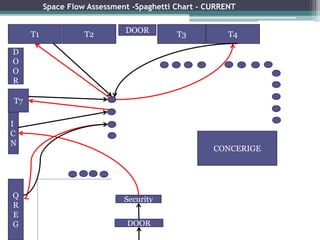
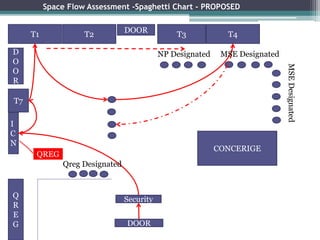
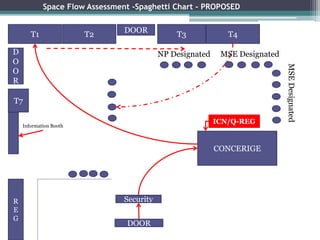
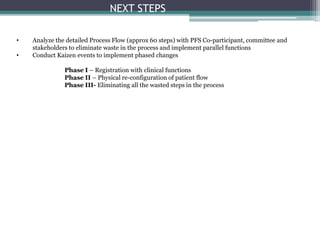
Olive View Medical Center
Emergency Department
Lean Six Sigma: Door to RME Cycle Time
Jordan Kessler, RN
1/9/2014
Project Scope: Decrease cycle time from Arrival to RME
Doctor (ESI 3-5)
• Project selection approach
1. Identified four potential projects
2. Gathered time stamp data for each potential project
3. Used benchmarks and waste walk to determine
performance gaps
4. Selected this project based on the highest score on the
project selection matrix
• Project targets
▫ Performance gap (1-5): 4 – validated by lean measures
▫ Current median time: 1 hr. and 34 minutes
▫ Goal median time: 37 minutes – based on benchmark
▫ GOAL Median Time BASED ON LEAN SIX
SIGMA MEASURE - 18 minutes
 No Wait time in between steps
 No sitting down or back and forth
 Taking only the value added time with at least
80% efficiency rate.
Current performance gap
(1= gap is small; 5= large gap with ideal performance)
4
Cost to business if NO changes made
(1= low cost; 5=high cost)
4
Impact on customer satisfaction
(1= low impact; 5= high impact)
4
Degree of waste
(1= little or no waste; 5= lots of waste)
4
Customers can be defined
(1= not easily defined; 5=easily to define)
4
Inputs can be identified
(1= hard to identify; 5easy to identify)
4
Outputs can be identified
(1= hard to identify; 5easy to identify)
5
Data is available
(1= difficult to collect or manual; 5easy to obtain,
electronic)
5
Team needed to understand / identify solutions
(1= team NOT needed; 5= team definitely needed)
4
Team has authority to implement solutions
(1= little or no authority; 5= has authority to implement)
4
Manageable project scope
(1= very large scope; 5= contained, narrow scope)
3
Total Score 45
Project Selection Matrix
ICN Desk
(2 mins)
RME
(6 mins)
Vitals
(3 mins)
Triage
(4 mins)
Registration
(3 mins)
Wait Room
Wait Room
Wait Room
Wait Room
8 minutes
13 minutes
45 minutes
10 minutes
The current process from door to doctor takes 1 hour and 34
minutes
Current Patient Flow
Current Metrics
• Total cycle time: 1 hr 34 mins
• Value added time: 13 mins
• Non-value added time: 1 hr 21 mins
• Process cycle efficiency: 13.82%
Key Definitions
• Process cycle efficiency (PCE): the
percentage of value-add time divided by total
time (cycle time)
• Value added time: time associated with work
that is desired by the customer
• Non-value added time: time related to work
not beneficial to customer – by lean standards is
waste in a process
N/A
18.75 %
33.33%
23.08%
11.76%
Efficiency
Process Step
(VA Time)
Wait Time
(NVA Time)
Key Highlights
Value added time
Total cycle time
PCE
ICN Desk
(2 mins)
RME
(6 mins)
Vitals
(3 mins)
Triage
(4 mins)
Registration
(3 mins)
Wait Room
Triage Wait Line
RME Wait Line
Wait Room
15 minutes
The goal of the proposed process is to get from door to doctor
in 37 minutes
Proposed Patient Flow
N/A
100 %
100%
42.86%
21.05%
Registration
(3 Mins)
Efficiency
Process Step
(VA Time)
Wait Time
(NVA Time)
Proposed Metrics- Benchmark
Total cycle time: 37 mins
• Value added time: 18 mins
• Non-value added time: 19 mins
Process cycle efficiency: 48.65%
Proposed Metrics- Ideal – Lean SS Standard
Total cycle time: 18 min
• Value added time: 13 mins
• Non-value added time: 0 to 5 min
Process cycle efficiency: 80% to 100%
Key Proposed Changes
• Patients are pushed to the next step rather than
pulled from the waiting room
• Registration should be a parallel process with the
clinical assessment
• The RME MD/NP does not waste time looking for
the next patient
• Limit microphone usage and time wasted finding
patients/rooms
• Eliminate time wasted for RME orders due to no
quick registration
4 minutes
Key Highlights
DOOR
Security
I
C
N
T7
Q
R
E
G
T4T2T1 T3
D
O
O
R
DOOR
CONCERIGE
Space Flow Assessment -Spaghetti Chart - CURRENT
DOOR
Security
I
C
N
T7
Q
R
E
G
T4T2T1 T3
D
O
O
R
DOOR
QREG
CONCERIGE
NP Designated MSE Designated
MSEDesignated
Qreg Designated
Space Flow Assessment -Spaghetti Chart - PROPOSED
DOOR
Security
T7
R
E
G
T4T2T1 T3
D
O
O
R
DOOR
CONCERIGE
NP Designated MSE Designated
MSEDesignated
Space Flow Assessment -Spaghetti Chart - PROPOSED
ICN/Q-REG
Information Booth
NEXT STEPS
• Analyze the detailed Process Flow (approx 60 steps) with PFS Co-participant, committee and
stakeholders to eliminate waste in the process and implement parallel functions
• Conduct Kaizen events to implement phased changes
Phase I – Registration with clinical functions
Phase II – Physical re-configuration of patient flow
Phase III- Eliminating all the wasted steps in the process

LSS-OVMC

  • 1.
    Olive View MedicalCenter Emergency Department Lean Six Sigma: Door to RME Cycle Time Jordan Kessler, RN 1/9/2014
  • 2.
    Project Scope: Decreasecycle time from Arrival to RME Doctor (ESI 3-5) • Project selection approach 1. Identified four potential projects 2. Gathered time stamp data for each potential project 3. Used benchmarks and waste walk to determine performance gaps 4. Selected this project based on the highest score on the project selection matrix • Project targets ▫ Performance gap (1-5): 4 – validated by lean measures ▫ Current median time: 1 hr. and 34 minutes ▫ Goal median time: 37 minutes – based on benchmark ▫ GOAL Median Time BASED ON LEAN SIX SIGMA MEASURE - 18 minutes  No Wait time in between steps  No sitting down or back and forth  Taking only the value added time with at least 80% efficiency rate. Current performance gap (1= gap is small; 5= large gap with ideal performance) 4 Cost to business if NO changes made (1= low cost; 5=high cost) 4 Impact on customer satisfaction (1= low impact; 5= high impact) 4 Degree of waste (1= little or no waste; 5= lots of waste) 4 Customers can be defined (1= not easily defined; 5=easily to define) 4 Inputs can be identified (1= hard to identify; 5easy to identify) 4 Outputs can be identified (1= hard to identify; 5easy to identify) 5 Data is available (1= difficult to collect or manual; 5easy to obtain, electronic) 5 Team needed to understand / identify solutions (1= team NOT needed; 5= team definitely needed) 4 Team has authority to implement solutions (1= little or no authority; 5= has authority to implement) 4 Manageable project scope (1= very large scope; 5= contained, narrow scope) 3 Total Score 45 Project Selection Matrix
  • 3.
    ICN Desk (2 mins) RME (6mins) Vitals (3 mins) Triage (4 mins) Registration (3 mins) Wait Room Wait Room Wait Room Wait Room 8 minutes 13 minutes 45 minutes 10 minutes The current process from door to doctor takes 1 hour and 34 minutes Current Patient Flow Current Metrics • Total cycle time: 1 hr 34 mins • Value added time: 13 mins • Non-value added time: 1 hr 21 mins • Process cycle efficiency: 13.82% Key Definitions • Process cycle efficiency (PCE): the percentage of value-add time divided by total time (cycle time) • Value added time: time associated with work that is desired by the customer • Non-value added time: time related to work not beneficial to customer – by lean standards is waste in a process N/A 18.75 % 33.33% 23.08% 11.76% Efficiency Process Step (VA Time) Wait Time (NVA Time) Key Highlights Value added time Total cycle time PCE
  • 4.
    ICN Desk (2 mins) RME (6mins) Vitals (3 mins) Triage (4 mins) Registration (3 mins) Wait Room Triage Wait Line RME Wait Line Wait Room 15 minutes The goal of the proposed process is to get from door to doctor in 37 minutes Proposed Patient Flow N/A 100 % 100% 42.86% 21.05% Registration (3 Mins) Efficiency Process Step (VA Time) Wait Time (NVA Time) Proposed Metrics- Benchmark Total cycle time: 37 mins • Value added time: 18 mins • Non-value added time: 19 mins Process cycle efficiency: 48.65% Proposed Metrics- Ideal – Lean SS Standard Total cycle time: 18 min • Value added time: 13 mins • Non-value added time: 0 to 5 min Process cycle efficiency: 80% to 100% Key Proposed Changes • Patients are pushed to the next step rather than pulled from the waiting room • Registration should be a parallel process with the clinical assessment • The RME MD/NP does not waste time looking for the next patient • Limit microphone usage and time wasted finding patients/rooms • Eliminate time wasted for RME orders due to no quick registration 4 minutes Key Highlights
  • 5.
  • 6.
    DOOR Security I C N T7 Q R E G T4T2T1 T3 D O O R DOOR QREG CONCERIGE NP DesignatedMSE Designated MSEDesignated Qreg Designated Space Flow Assessment -Spaghetti Chart - PROPOSED
  • 7.
    DOOR Security T7 R E G T4T2T1 T3 D O O R DOOR CONCERIGE NP DesignatedMSE Designated MSEDesignated Space Flow Assessment -Spaghetti Chart - PROPOSED ICN/Q-REG Information Booth
  • 8.
    NEXT STEPS • Analyzethe detailed Process Flow (approx 60 steps) with PFS Co-participant, committee and stakeholders to eliminate waste in the process and implement parallel functions • Conduct Kaizen events to implement phased changes Phase I – Registration with clinical functions Phase II – Physical re-configuration of patient flow Phase III- Eliminating all the wasted steps in the process