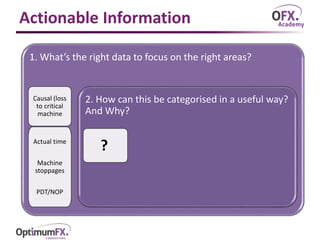
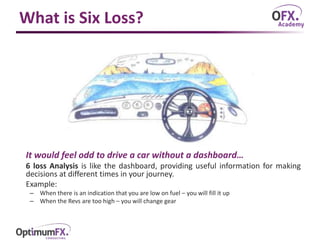
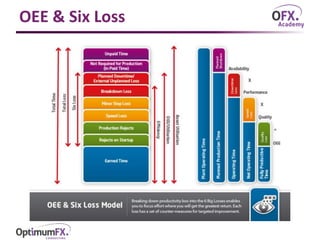
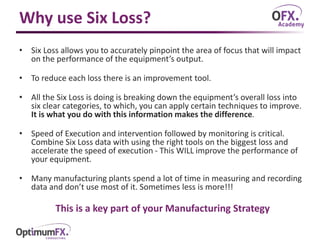
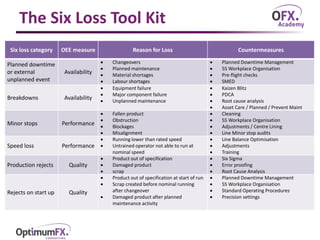
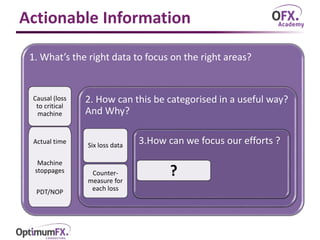
Improving Packaging Line Performance –
Using the correct Data and Drill Down Analysis
Actionable Information II
www.optimumfx.com
Data…Data…Data == Good Information
Excessive data – Lack of information The right data – with drill down analysis
X
Actionable Information
1. What’s the right data to focus on the right areas?
Causal (loss
to critical
machine
Actual time
Machine
stoppages
PDT/NOP
2. How can this be categorised in a useful way?
And Why?
?
What is Six Loss?
It would feel odd to drive a car without a dashboard…
6 loss Analysis is like the dashboard, providing useful information for making
decisions at different times in your journey.
Example:
– When there is an indication that you are low on fuel – you will fill it up
– When the Revs are too high – you will change gear
OEE & Six Loss
Why use Six Loss?
• Six Loss allows you to accurately pinpoint the area of focus that will impact
on the performance of the equipment’s output.
• To reduce each loss there is an improvement tool.
• All the Six Loss is doing is breaking down the equipment’s overall loss into
six clear categories, to which, you can apply certain techniques to improve.
It is what you do with this information makes the difference.
• Speed of Execution and intervention followed by monitoring is critical.
Combine Six Loss data with using the right tools on the biggest loss and
accelerate the speed of execution - This WILL improve the performance of
your equipment.
• Many manufacturing plants spend a lot of time in measuring and recording
data and don’t use most of it. Sometimes less is more!!!
This is a key part of your Manufacturing Strategy
The Six Loss Tool Kit
Six loss category OEE measure Reason for Loss Countermeasures
Planned downtime
or external
unplanned event
Availability
 Changeovers
 Planned maintenance
 Material shortages
 Labour shortages
 Planned Downtime Management
 5S Workplace Organisation
 Pre-flight checks
 SMED
Breakdowns Availability
 Equipment failure
 Major component failure
 Unplanned maintenance
 Kaizen Blitz
 PDCA
 Root cause analysis
 Asset Care / Planned / Prevent Maint
Minor stops Performance
 Fallen product
 Obstruction
 Blockages
 Misalignment
 Cleaning
 5S Workplace Organisation
 Adjustments / Centre Lining
 Line Minor stop audits
Speed loss Performance
 Running lower than rated speed
 Untrained operator not able to run at
nominal speed
 Line Balance Optimisation
 Adjustments
 Training
Production rejects Quality
 Product out of specification
 Damaged product
 scrap
 Six Sigma
 Error proofing
 Root Cause Analysis
Rejects on start up Quality
 Product out of specification at start of run
 Scrap created before nominal running
after changeover
 Damaged product after planned
maintenance activity
 Planned Downtime Management
 5S Workplace Organisation
 Standard Operating Procedures
 Precision settings
Actionable Information
1. What’s the right data to focus on the right areas?
Causal (loss
to critical
machine
Actual time
Machine
stoppages
PDT/NOP
2. How can this be categorised in a useful way?
And Why?
Six loss data
Counter-
measure for
each loss
3.How can we focus our efforts ?
?

Actionable information 2

  • 1.
    Improving Packaging LinePerformance – Using the correct Data and Drill Down Analysis Actionable Information II www.optimumfx.com
  • 2.
    Data…Data…Data == GoodInformation Excessive data – Lack of information The right data – with drill down analysis X Actionable Information
  • 3.
    Actionable Information 1. What’sthe right data to focus on the right areas? Causal (loss to critical machine Actual time Machine stoppages PDT/NOP 2. How can this be categorised in a useful way? And Why? ?
  • 4.
    What is SixLoss? It would feel odd to drive a car without a dashboard… 6 loss Analysis is like the dashboard, providing useful information for making decisions at different times in your journey. Example: – When there is an indication that you are low on fuel – you will fill it up – When the Revs are too high – you will change gear
  • 5.
  • 6.
    Why use SixLoss? • Six Loss allows you to accurately pinpoint the area of focus that will impact on the performance of the equipment’s output. • To reduce each loss there is an improvement tool. • All the Six Loss is doing is breaking down the equipment’s overall loss into six clear categories, to which, you can apply certain techniques to improve. It is what you do with this information makes the difference. • Speed of Execution and intervention followed by monitoring is critical. Combine Six Loss data with using the right tools on the biggest loss and accelerate the speed of execution - This WILL improve the performance of your equipment. • Many manufacturing plants spend a lot of time in measuring and recording data and don’t use most of it. Sometimes less is more!!! This is a key part of your Manufacturing Strategy
  • 7.
    The Six LossTool Kit Six loss category OEE measure Reason for Loss Countermeasures Planned downtime or external unplanned event Availability  Changeovers  Planned maintenance  Material shortages  Labour shortages  Planned Downtime Management  5S Workplace Organisation  Pre-flight checks  SMED Breakdowns Availability  Equipment failure  Major component failure  Unplanned maintenance  Kaizen Blitz  PDCA  Root cause analysis  Asset Care / Planned / Prevent Maint Minor stops Performance  Fallen product  Obstruction  Blockages  Misalignment  Cleaning  5S Workplace Organisation  Adjustments / Centre Lining  Line Minor stop audits Speed loss Performance  Running lower than rated speed  Untrained operator not able to run at nominal speed  Line Balance Optimisation  Adjustments  Training Production rejects Quality  Product out of specification  Damaged product  scrap  Six Sigma  Error proofing  Root Cause Analysis Rejects on start up Quality  Product out of specification at start of run  Scrap created before nominal running after changeover  Damaged product after planned maintenance activity  Planned Downtime Management  5S Workplace Organisation  Standard Operating Procedures  Precision settings
  • 8.
    Actionable Information 1. What’sthe right data to focus on the right areas? Causal (loss to critical machine Actual time Machine stoppages PDT/NOP 2. How can this be categorised in a useful way? And Why? Six loss data Counter- measure for each loss 3.How can we focus our efforts ? ?

Editor's Notes

  • #2 Overall introduction: Check in on time frame – 3 hrs ish – short break at some point I’m where a different cap for next few hours – not Mr LineView – although there are some references here Some / quite a bit you may already know – apologies, such eggs, etc Empty your cup Be here fully Be interactive – up for challenge, ask questions as we go, you’ll get out what you put in Secondary outcome: Agree how to go allocate to fault level (for now)
  • #4 40% loss - what kind of problems, where, when, what exactly happened. Getting better or worse. Top level - Answer series of questions as glue Add new slide as top level overview – include vision Get prepared with some real data on faults, loss, etc Start with a mini session on LineView What’s the right data ensure we focus on the right areas? How can this be categorised in a useful way? How should the data be logged to make it most useful? How can we drill down to focus our efforts? How is machine data useful (over and above loss data)? What tools apply to what kind of problems?
  • #9 40% loss - what kind of problems, where, when, what exactly happened. Getting better or worse. Top level - Answer series of questions as glue Add new slide as top level overview – include vision Get prepared with some real data on faults, loss, etc Start with a mini session on LineView What’s the right data ensure we focus on the right areas? How can this be categorised in a useful way? How should the data be logged to make it most useful? How can we drill down to focus our efforts? How is machine data useful (over and above loss data)? What tools apply to what kind of problems?