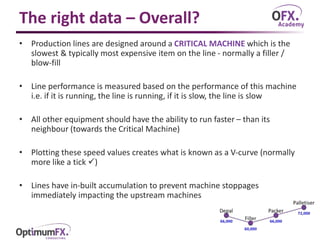
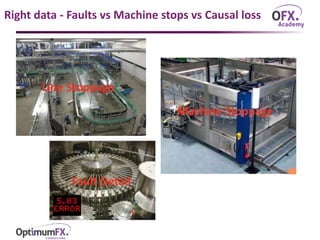
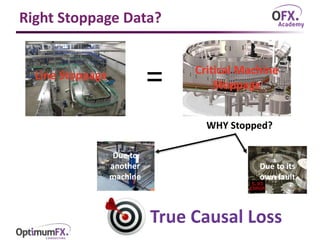
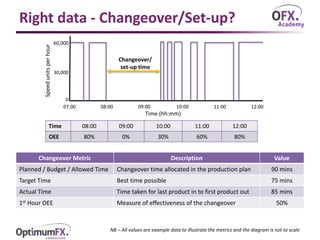
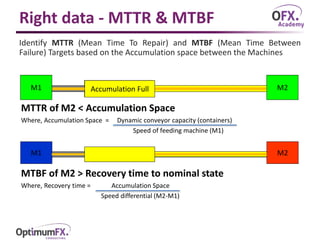
Improving Packaging Line Performance –
Using the correct Data and Drill Down Analysis
Actionable Information I
www.optimumfx.com
Data…Data…Data == Good Information
Excessive data – Lack of information The right data – with drill down analysis
X
Actionable Information
1. What’s the right data to focus on the right areas?
2. How can this be categorised in a useful way?
And Why?
3.How can we focus our efforts ?
?
The right data – Overall?
• Production lines are designed around a CRITICAL MACHINE which is the
slowest & typically most expensive item on the line - normally a filler /
blow-fill
• Line performance is measured based on the performance of this machine
i.e. if it is running, the line is running, if it is slow, the line is slow
• All other equipment should have the ability to run faster – than its
neighbour (towards the Critical Machine)
• Plotting these speed values creates what is known as a V-curve (normally
more like a tick )
• Lines have in-built accumulation to prevent machine stoppages
immediately impacting the upstream machines
Actionable Information
1. What’s the right data to focus on the right areas?
Causal (loss
to critical
machine
?
Right data - Faults vs Machine stops vs Causal loss
Line Stoppage
Machine Stoppage
Fault Detail
Right Stoppage Data?
Line Stoppage
= Critical Machine
Stoppage
WHY Stopped?
Due to
another
machine
Due to its
own fault
Right data - Changeover/Set-up?
60,000
30,000
0
08:00 09:00 10:00 11:00 12:00
Time (hh:mm)
Speedunitsperhour
07:00
Time 08:00 09:00 10:00 11:00 12:00
OEE 80% 0% 30% 60% 80%
Changeover Metric Description Value
Planned / Budget / Allowed Time Changeover time allocated in the production plan 90 mins
Target Time Best time possible 75 mins
Actual Time Time taken for last product in to first product out 85 mins
1st Hour OEE Measure of effectiveness of the changeover 50%
Changeover/
set-up time
NB – All values are example data to illustrate the metrics and the diagram is not to scale
Right data - MTTR & MTBF
Identify MTTR (Mean Time To Repair) and MTBF (Mean Time Between
Failure) Targets based on the Accumulation space between the Machines
MTTR of M2 < Accumulation Space
Where, Accumulation Space = Dynamic conveyor capacity (containers)
Speed of feeding machine (M1)
MTBF of M2 > Recovery time to nominal state
Where, Recovery time = Accumulation Space
Speed differential (M2-M1)
M2M1
M1 M2Nominal State
Accumulation Full
Actionable Information
1. What’s the right data to focus on the right areas?
Causal (loss
to critical
machine
Actual time
Machine
stoppages
PDT/NOP
2. How can this be categorised in a useful way?
And Why?
?

Actionable information 1

  • 1.
    Improving Packaging LinePerformance – Using the correct Data and Drill Down Analysis Actionable Information I www.optimumfx.com
  • 2.
    Data…Data…Data == GoodInformation Excessive data – Lack of information The right data – with drill down analysis X Actionable Information
  • 3.
    Actionable Information 1. What’sthe right data to focus on the right areas? 2. How can this be categorised in a useful way? And Why? 3.How can we focus our efforts ? ?
  • 4.
    The right data– Overall? • Production lines are designed around a CRITICAL MACHINE which is the slowest & typically most expensive item on the line - normally a filler / blow-fill • Line performance is measured based on the performance of this machine i.e. if it is running, the line is running, if it is slow, the line is slow • All other equipment should have the ability to run faster – than its neighbour (towards the Critical Machine) • Plotting these speed values creates what is known as a V-curve (normally more like a tick ) • Lines have in-built accumulation to prevent machine stoppages immediately impacting the upstream machines
  • 5.
    Actionable Information 1. What’sthe right data to focus on the right areas? Causal (loss to critical machine ?
  • 6.
    Right data -Faults vs Machine stops vs Causal loss Line Stoppage Machine Stoppage Fault Detail
  • 7.
    Right Stoppage Data? LineStoppage = Critical Machine Stoppage WHY Stopped? Due to another machine Due to its own fault
  • 8.
    Right data -Changeover/Set-up? 60,000 30,000 0 08:00 09:00 10:00 11:00 12:00 Time (hh:mm) Speedunitsperhour 07:00 Time 08:00 09:00 10:00 11:00 12:00 OEE 80% 0% 30% 60% 80% Changeover Metric Description Value Planned / Budget / Allowed Time Changeover time allocated in the production plan 90 mins Target Time Best time possible 75 mins Actual Time Time taken for last product in to first product out 85 mins 1st Hour OEE Measure of effectiveness of the changeover 50% Changeover/ set-up time NB – All values are example data to illustrate the metrics and the diagram is not to scale
  • 9.
    Right data -MTTR & MTBF Identify MTTR (Mean Time To Repair) and MTBF (Mean Time Between Failure) Targets based on the Accumulation space between the Machines MTTR of M2 < Accumulation Space Where, Accumulation Space = Dynamic conveyor capacity (containers) Speed of feeding machine (M1) MTBF of M2 > Recovery time to nominal state Where, Recovery time = Accumulation Space Speed differential (M2-M1) M2M1 M1 M2Nominal State Accumulation Full
  • 10.
    Actionable Information 1. What’sthe right data to focus on the right areas? Causal (loss to critical machine Actual time Machine stoppages PDT/NOP 2. How can this be categorised in a useful way? And Why? ?

Editor's Notes

  • #2 Overall introduction: Check in on time frame – 3 hrs ish – short break at some point I’m where a different cap for next few hours – not Mr LineView – although there are some references here Some / quite a bit you may already know – apologies, such eggs, etc Empty your cup Be here fully Be interactive – up for challenge, ask questions as we go, you’ll get out what you put in Secondary outcome: Agree how to go allocate to fault level (for now)
  • #4 40% loss - what kind of problems, where, when, what exactly happened. Getting better or worse. Top level - Answer series of questions as glue Add new slide as top level overview – include vision Get prepared with some real data on faults, loss, etc Start with a mini session on LineView What’s the right data ensure we focus on the right areas? How can this be categorised in a useful way? How should the data be logged to make it most useful? How can we drill down to focus our efforts? How is machine data useful (over and above loss data)? What tools apply to what kind of problems?
  • #6 40% loss - what kind of problems, where, when, what exactly happened. Getting better or worse. Top level - Answer series of questions as glue Add new slide as top level overview – include vision Get prepared with some real data on faults, loss, etc Start with a mini session on LineView What’s the right data ensure we focus on the right areas? How can this be categorised in a useful way? How should the data be logged to make it most useful? How can we drill down to focus our efforts? How is machine data useful (over and above loss data)? What tools apply to what kind of problems?
  • #8 Explore faults with the team How does fault information relate to causal loss
  • #11 40% loss - what kind of problems, where, when, what exactly happened. Getting better or worse. Top level - Answer series of questions as glue Add new slide as top level overview – include vision Get prepared with some real data on faults, loss, etc Start with a mini session on LineView What’s the right data ensure we focus on the right areas? How can this be categorised in a useful way? How should the data be logged to make it most useful? How can we drill down to focus our efforts? How is machine data useful (over and above loss data)? What tools apply to what kind of problems?