Get the fullversion of this
presentation + commercial use
Join Plus
Translate this presentation
to any language
Translate
Learn more about this
presentation with our video
Watch now
For personal and educational use only. For commercial use, join Plus.
By using this presentation, you agree to our Terms & Conditions.
2.
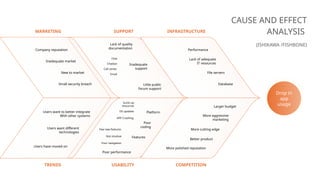
CAUSE AND EFFECT
ANALYSIS
(ISHIKAWA/FISHBONE)
Drop in
app
usage
MARKETING SUPPORT INFRASTRUCTURE
TRENDS USABILITY COMPETITION
Company reputation
Inadequate market
New to market
Small security breach
Lack of quality
documentation
Little public
forum support
Inadequate
support
Chat
Chatbot
Call center
Email
Performance
Lack of adequate
IT resources
File servers
Database
Users have moved on
Users want different
technologies
Users want to better integrate
With other systems
Platform
Features
Few new features
Not intuitive
Poor navigation
Poor performance
Sucks up
resources
OS updates
APP Crashing
Poor
coding
Larger budget
More aggressive
marketing
More cutting edge
Better product
More polished reputation
3.
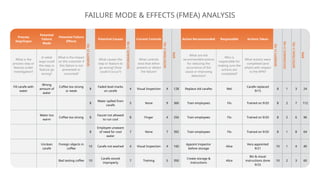
FAILURE MODE &EFFECTS (FMEA) ANALYSIS
Process
Step/Input
Potential
Failure
Mode
Potential Failure
Effects
SEVERITY
(1-10)
Potential Causes
OCCURANCE
(1-10)
Current Controls
DETECTION
(1-10)
RPN
Action Recommended Responsible Actions Taken
SEVERITY
(1-10)
OCCURANCE
(1-10)
DETECTION
(1-10)
RPN
What is the
process step or
feature under
investigation?
In what
ways could
the step or
feature go
wrong?
What is the impact
on the customer if
this failure is not
prevented or
corrected?
What causes the
step or feature to
go wrong? (how
could it occur?)
What controls
exist that either
prevent or detect
the failure?
What are the
recommended actions
for reducing the
occurrence of the
cause or improving
detection?
Who is
responsible for
making sure the
actions are
completed?
What actions were
completed (and
when) with respect
to the RPN?
Fill carafe with
water
Wrong
amount of
water
Coffee too strong
or weak
8
Faded level marks
on carafe
4 Visual Inspection 4 128 Replace old carafes Mel
Carafe replaced
9/15
8 1 3 24
8
Water spilled from
carafe
5 None 9 360 Train employees Flo Trained on 9/20 8 2 7 112
Water too
warm
Coffee too strong 8
Faucet not allowed
to run cool
8 Finger 4 256 Train employees Flo Trained on 9/20 8 2 6 96
8
Employee unaware
of need for cool
water
7 None 7 392 Train employees Flo Trained on 9/20 8 1 8 64
Unclean
carafe
Foreign objects in
coffee
10 Carafe not washed 4 Visual Inspection 4 160
Appoint inspector
before storage
Alice
Vera appointed
9/21
10 1 4 40
Bad tasting coffee 10
Carafe stored
improperly
7 Training 5 350
Create storage &
instructions
Alice
Bin & visual
instructions done
9/25
10 2 3 60
4.
Airspeed
anomaly:
blocked
probe
Keyhole wasp
ecology &
behavior
Keyholewasp
ecology &
behavior
Keyhole wasp
ecology &
behavior
Training
Hardware
systems/
alerting
technology
Pilot rejects
takeoff
Training
Hardware
systems/
alerting
technology
Pilot rejects
takeoff
Training
Hardware
systems/
alerting
technology
Pilot rejects
takeoff- failed
recovery
Training
Hardware
systems/
alerting
technology
Pilot rejects
takeoff- failed
recovery
BOW TIE ANALYSIS
Low speed
rejected takeoff
B2 B2 B1 D1
Runaway
overrun
C5 B3 C3 C4
Return to land
C4 B3 B2 C2
High speed
rejected takeoff
B2 B3 B1 D1
Keyhole wasp
Research
project
Wasp
control
Airport
inspections
Awareness
raising
Pitot covers Pitot design Pitot heating
Pitot
covered
Maintenance
inspection
Covers removed
5.
PARETO ANALYSIS (80/20RULE)
Wrong supplier Excess count Too few count Wrong size Wrong
instrument set
Missing item Damaged item Other
0
20
40
60
80
100
-20%
0%
20%
40%
60%
80%
100%
Frequency
Cumulative
percentage
USEFUL MANY
VITAL FEW
6.
Situation
Appraisal
A
PROCESS
KEY
Problem
Analysis
B
Decision
Analysis
C
Potential problem
analysis
D
Potential opportunity
analysis
E
Performance
System
F
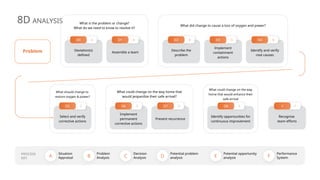
8DANALYSIS What is the problem or change?
What do we need to know to resolve it?
What did change to cause a loss of oxygen and power?
Recognize
team efforts
Select and verify
corrective actions
Implement
permanent
corrective actions
Prevent recurrence
Identify opportunities for
continuous improvement
What should change to
restore oxygen & power?
What could change on the way home that
would jeopardize their safe arrival?
What could change on the way
home that would enhance their
safe arrival
Deviation(s)
defined
Assemble a team
Describe the
problem
Implement
containment
actions
Identify and verify
root causes
C
D5 D
D6 D
D7 E
D8 F
Y
A
D0 A
D1 B
D2 D
D3 B
D4
Problem
7.
EVENTS FAILURE CAUSEANALYSIS
The management
fearing any negative
consequences from an
inspector's report
Inspector inspects the
home or school
Do not challenge the
report, but appraise the
inspector
Inspector interprets
compliance with the
standards
Actively encouraging
and promoting a no
restraint policy
Child leaves the hose
Inspector provides
subjective advice on the
use of retrain
Inspector not trained or
operationally
competent to do so
Manager not trained or
operationally
competent to do so
Staff fear discipline/
precautions
Staff don’t stop the child
from leaving
Advises that children
cannot be stopped or
restrained
Child is harmed
Secondary
Events
Primary
Events
Secondary
Events
Systematic and/or casual factors
Systematic and/or casual factors
8.
Mis-allocation
No clear rules
Chartof accounts “messy”
Growth is not planned
Missing efficiencies in business
Lack of clear management lines
Information lagging – not in real time
Weak budgeting
Need to measure and report on actual
and not perceived profitability
MIND MAPPING
FOR ROOT CAUSE
Need for clarity of
what is delivering
profit to the business
Business Structure
Overheads
Reporting
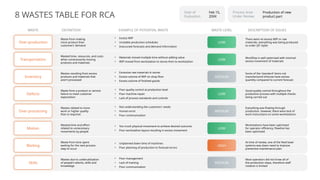
WASTE DEFINITION EXAMPLEOF POTENTIAL WASTE WASTE LEVEL DESCRIPTION OF ISSUES
Skills
Waste from making
more product than
customers' demand
Wasted time, resources, and costs
when unnecessarily moving
products and materials
Wastes resulting from excess
products and materials that
aren't processed
Waste from a product or service
failure to meet customer
expectation
Wastes related to more
work or higher quality
than is required
Wasted time and effort
related to unnecessary
movements by people
Waste from time spent
waiting for the next process
step to occur
Wastes due to underutilization
of people's talents, skills and
knowledge
• Excess WIP
• Unstable production schedules
• Inaccurate forecasts and demand information
• Materials moved multiple time without adding value
• WIP moved from workstation to stores then to workstation
• Excessive raw materials in stores
• Excess volume of WIP on shop floor
• Excess volume of finished goods
• Poor quality control at production level
• Poor machine repair
• Lack of process standards and controls
• Not understanding the customers' needs
• Human error
• Poor communication
• Too much physical movement to achieve desired outcome
• Poor workstation layout resulting in excess movement
• Unplanned down time of machines
• Poor planning of production to forecast errors
• Poor management
• Lack of training
• Poor communication
LOW
LOW
MEDIUM
LOW
MEDIUM
LOW
HIGH
MEDIUM
There were no excess WIP or raw
materials, everything was being produced
to order (JIT style)
Workflow is well optimized with minimal
excess movement of materials
Some of the 'standard' items not
manufactured inhouse have excess
quantity compared to current forecast
Good quality control throughout the
production process with multiple checks
being carried out
Everything was flowing through
production, however, there were lack of
work instructions on some workstations
Workstations have been optimized
for operator efficiency; flowline has
been optimized
At time of review, one of the feed bowl
systems was down need to improve
preventive maintenance plan
Most operators did not know all of
the production steps, therefore staff
rotation is limited
8 WASTES TABLE FOR RCA
Date of
Evaluation
Feb 15,
20XX
Process Area
Under Review
Production of new
product part
Waiting
Motion
Over-processing
Defects
Inventory
Transportation
Over-production
11.
FIVE WHYS ANALYSIS
Inadequateproject
management
Cadre not specified
System downtime
Task done manually
due to system
downtime
Project deadline
missed
Report not
submitted
Suppliers not paid
Late delivery of
goods
Team failed to
complete tasks on
time
No one to run the
report
Late delivery
Dispatch delayed
Task priorities were
not well-defined
Person responsible
on leave
Job took too long
Magazines not
ready on time
Project manager
didn’t communicate
clearly
No person to cover
Ran out of paper
Delay in supply of
materials
Lack of regular
project progress
reviews
No support staff
Incorrect ink used
Wrong specification
sent to supplier
Over-reliance on
informal
communication
methods
No recruitment
Incorrect ink in
store
Mix-up by
purchasing division
ISSUE WHY 1 WHY 2 WHY 3 WHY 4 WHY 5
ROOT
CAUSE
12.
• Influence oflocal trade unions
resisting foreign brands
• Market control by a few large
distribution networks
• Local elites prefer established,
incumbent brands
• Local customers are hesitant to
trust foreign brands
• Valuing personal relationships
over digital interactions
• Restrictive import taxes
increased product costs
• Local content Bureaucratic
delays in obtaining licenses
and permits
• Weak partnerships with local
distributors or influencers
• Inadequate localization of
messaging and brand
positioning.
• Inadequate local training
programs for new users
• Poor integration of local
payment methods.
• Poor availability of customer
support in local languages
• Inconsistent supply chain for
timely product distribution
POWER ROOT
CAUSE
REGULATION
ROOT CAUSE
MINDSET ROOT
CAUSE
CONNECTION
ROOT CAUSE
COMPONENT
ROOT CAUSE
RESOURCE
ROOT CAUSE
Potential customer base in
new market demonstrated
interest in our offerings, yet
sales figures failed to meet
projection by more than 50%.
PROBLEM
MINDSET ROOT CAUSE
What local beliefs, values, or attitudes may
have caused the problem?
RCA MAP
CONNECTION ROOT CAUSE
How have the current connections and
exchanges between local customers and
organizations caused the problem?
RESOURCE ROOT CAUSE
How is the availability and quality of local
resources causing the problem?
REGULATION ROOT CAUSE
What policies or regulatory measures
caused the problem, and how?
COMPONENT ROOT CAUSE
How is the design and delivery of local
programs or services causing the problem?
POWER ROOT CAUSE
In what ways do local power dynamics
cause the problem?
13.
11 8 276 2 28 19
Total
ISSUE CHECK SHEET
Wrong orders
Reworked orders
Late deliveries
Shipping damage
Late payments
Monday Tuesday Wednesday Thursday Friday Saturday Sunday
14.
ISSUE REPORT
ROOT CAUSEVerified By
Verified
Date
1
Revision: Reinspection by QE showed discrepant tools (2) are s lightly longer (.437) than nondiscrepant tools of lot. Also noted was EDM pattern displayed over etch
condition causing a wash-out or rounding of the features.
A Osbourn 1/12/2012
2 Sampling size by Final Inspection not adequate to screen out discrepant tools. A Osbourn 1/12/2009
3
Revision: EDM operator did not adjust machine or hit target during EDM burn causing the Discrepancy. Operator burn too deep on part and did not verify the depth.
Machine allows for manual adjustments during processing to hit the target
A Osbourn 1/12/2009
CORRECTIVE ACTION Owner Date Done? Verified By
Verified
Date
1 Revision: Retrain EDM operators for proper adjustment and verification of EDM machine and target depth. M. Hernandez 1/8/2012
✓ A Osbourn 1/8/2012
CONTAINMENT Owner Date Done? Verified By
Verified
Date
1 Locate, remove from stock, and quarantine all units from referenced build. M. Hernandez 1/8/2012
✓ A Osbourn 1/8/2012
2 Inspect all remaining parts: fourteen (14) parts pulled from stock for applicable "T" dimension E Miller 1/8/2009 A Osbourn 1/8/2009
3
Reinspection (see item 2 above) found one (1) additional tool that exhibited the referenced discrepancy. Tool was segregated
and scrapped
E Miller 1/8/2009
✓ A Osbourn 1/8/2009
4 Revision 100% inspection of stock, shipping and Final Inspection for 'T' parameter of referenced tool. Y Chavez
1/11/200
9 ✓ A Osbourn 1/12/2009
CUSTOMER PROBLEMS
“T” size is out of specification
COMPANY’S FINDINGS
Measurement of referenced tool confirms customer complaint of T“ dimension
not conforming to 0.0032”+/-0.0003”s specification, is 0.00365”
15.
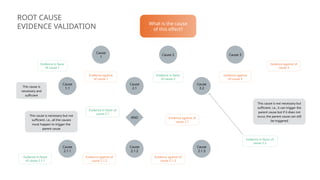
ROOT CAUSE
EVIDENCE VALIDATION
Cause
1.1
Cause
2.1
Cause
2.2
AND
Cause
2.1.1
Cause
2.1.2
Cause
2.1.3
Cause
1
Cause2 Cause 3
Evidence in favor
of cause 1
Evidence against
of cause 1
Evidence in favor
of cause 2
Evidence against
of cause 3
Evidence against of
cause 3
Evidence in favor of
cause 2.1
Evidence against of
cause 2.1
Evidence in favor of
cause 2.2
Evidence against of
cause 2.1.3
Evidence against of
cause 2.1.2
Evidence in favor
of cause 2.1.1
This cause is necessary but not
sufficient. i.e., all the causes
must happen to trigger the
parent cause
This cause is not necessary but
sufficient. i.e., it can trigger the
parent cause but if it does not
occur, the parent cause can still
be triggered
This cause is
necessary and
sufficient
What is the cause
of this effect?
Get the fullversion of this
presentation with this slide
when you join You Exec Plus.
Start today
18.
Get the fullversion of this
presentation with this slide
when you join You Exec Plus.
Start today
19.
Related
Root Cause AnalysisProblem-Solving Frameworks
Risk Management Six Sigma
The following resources are
related to this framework and
can save you hours of work.
If you’re a free or paid
member, log into You Exec first
for a better download
experience.