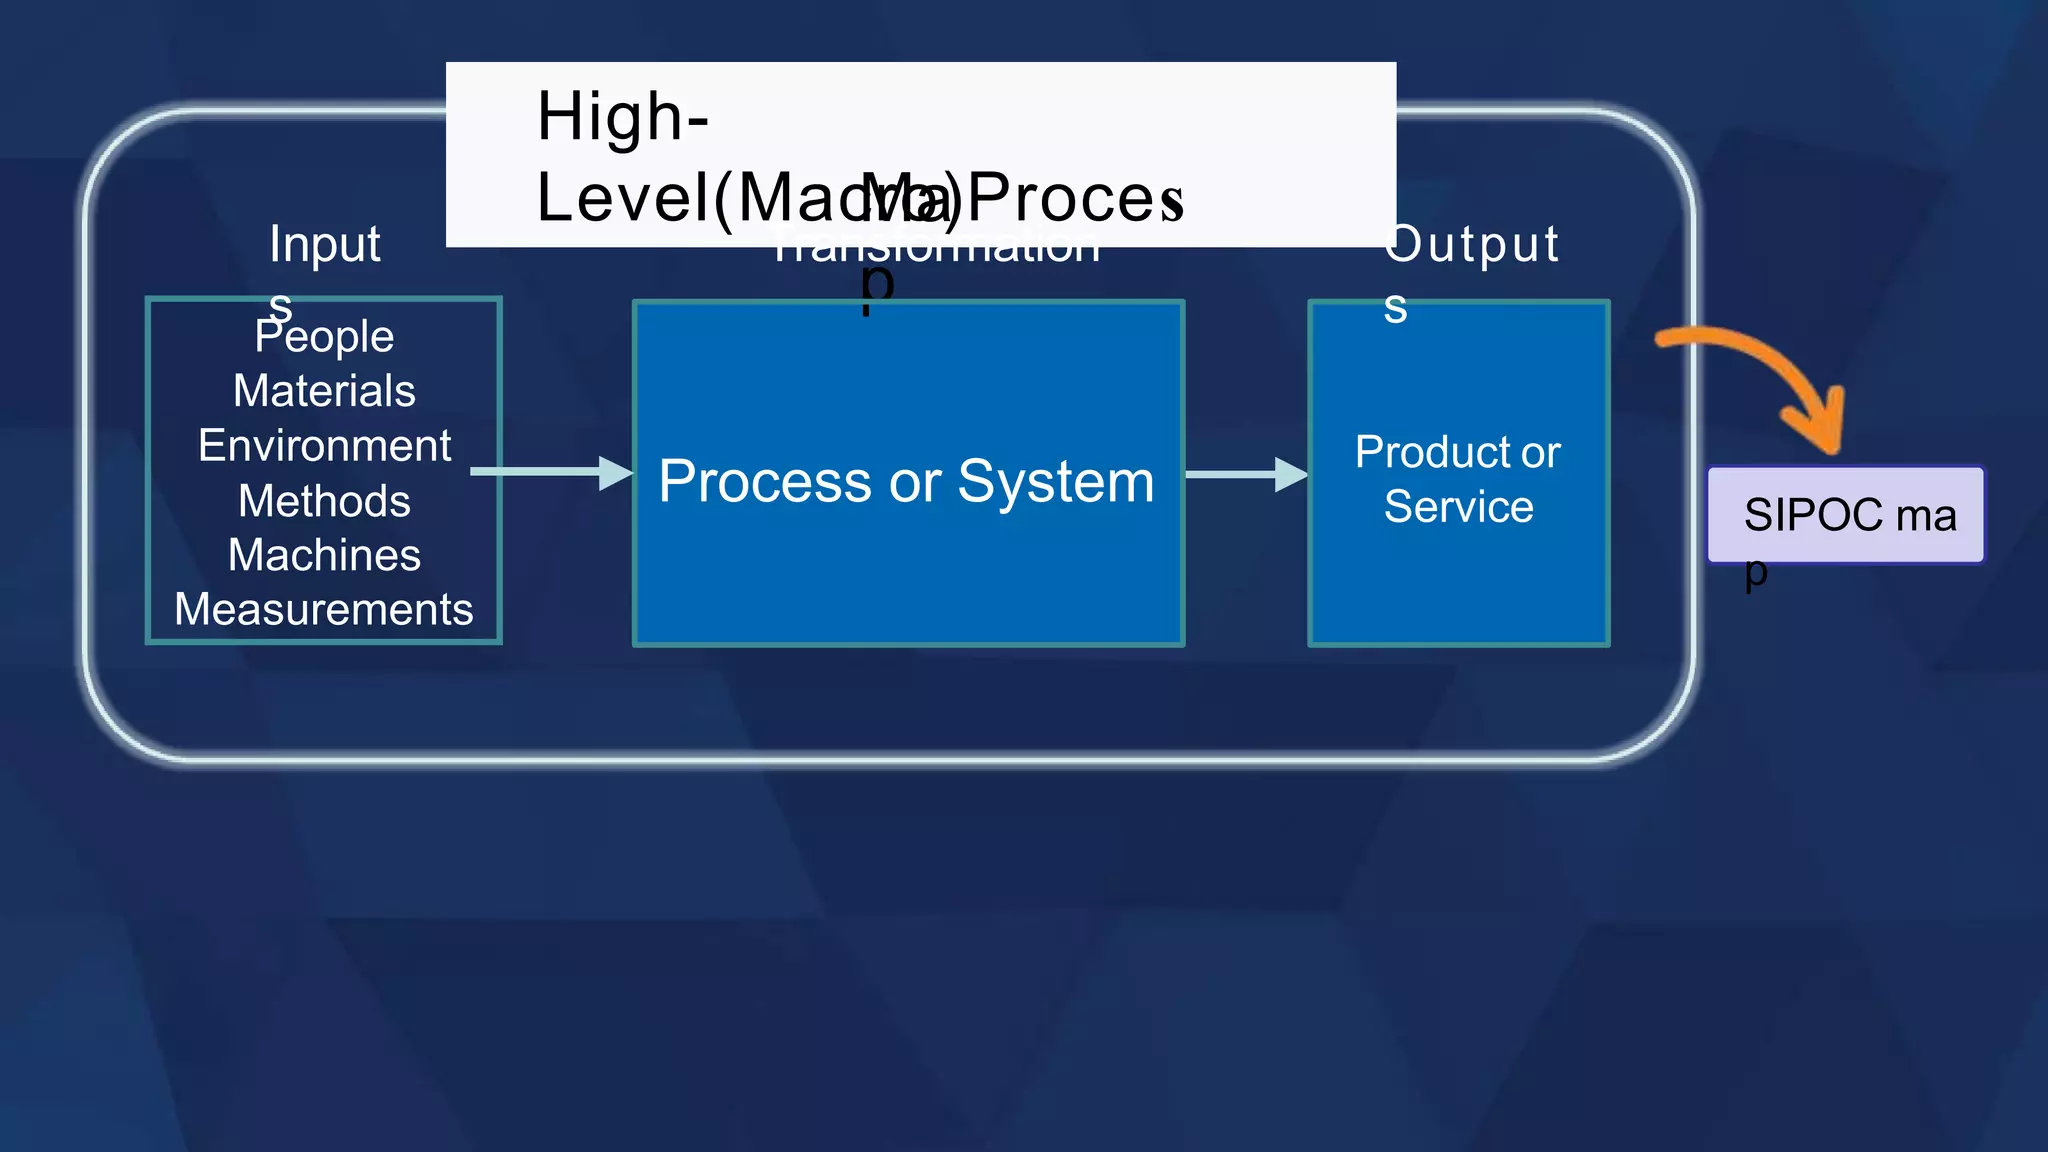
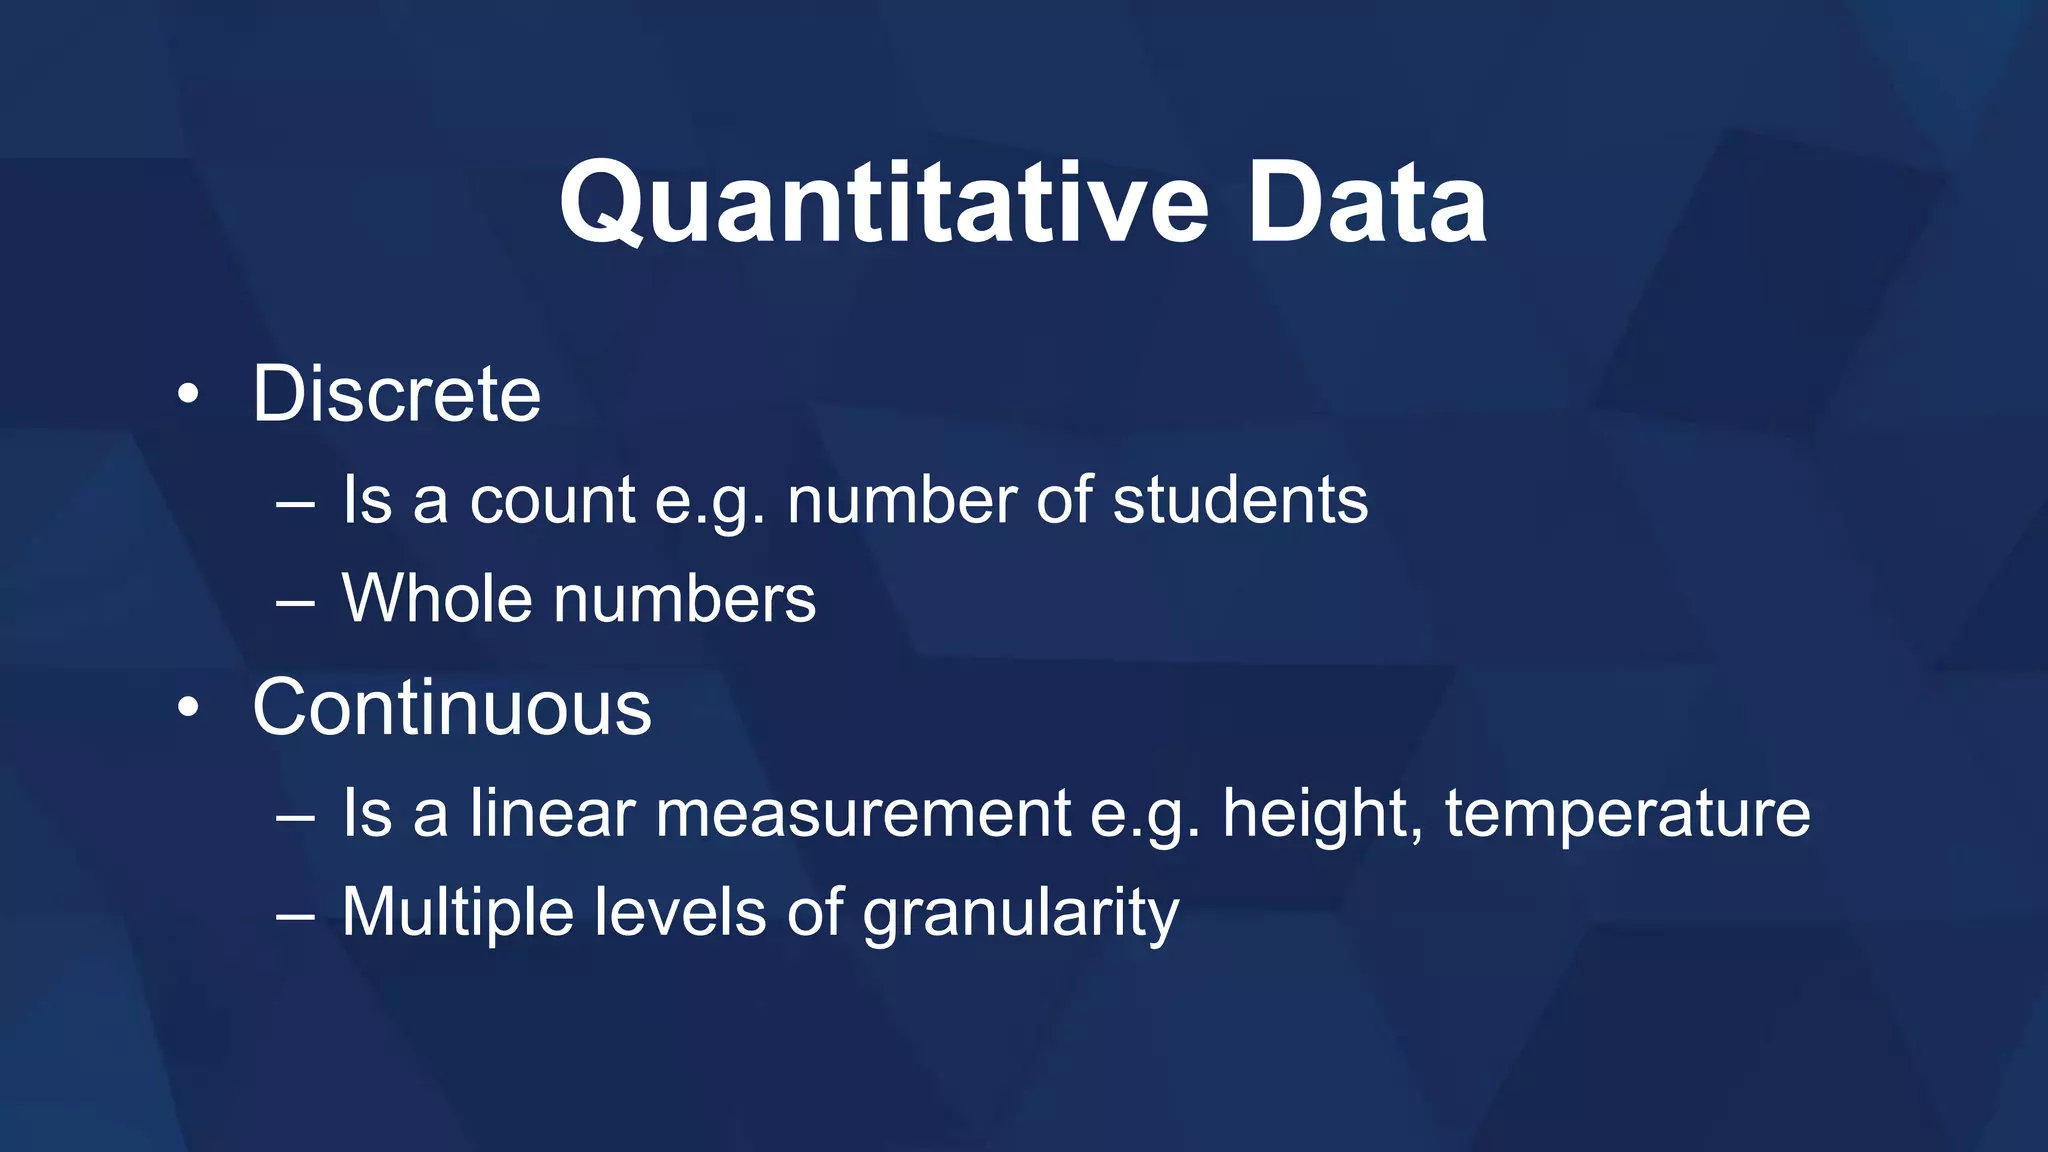
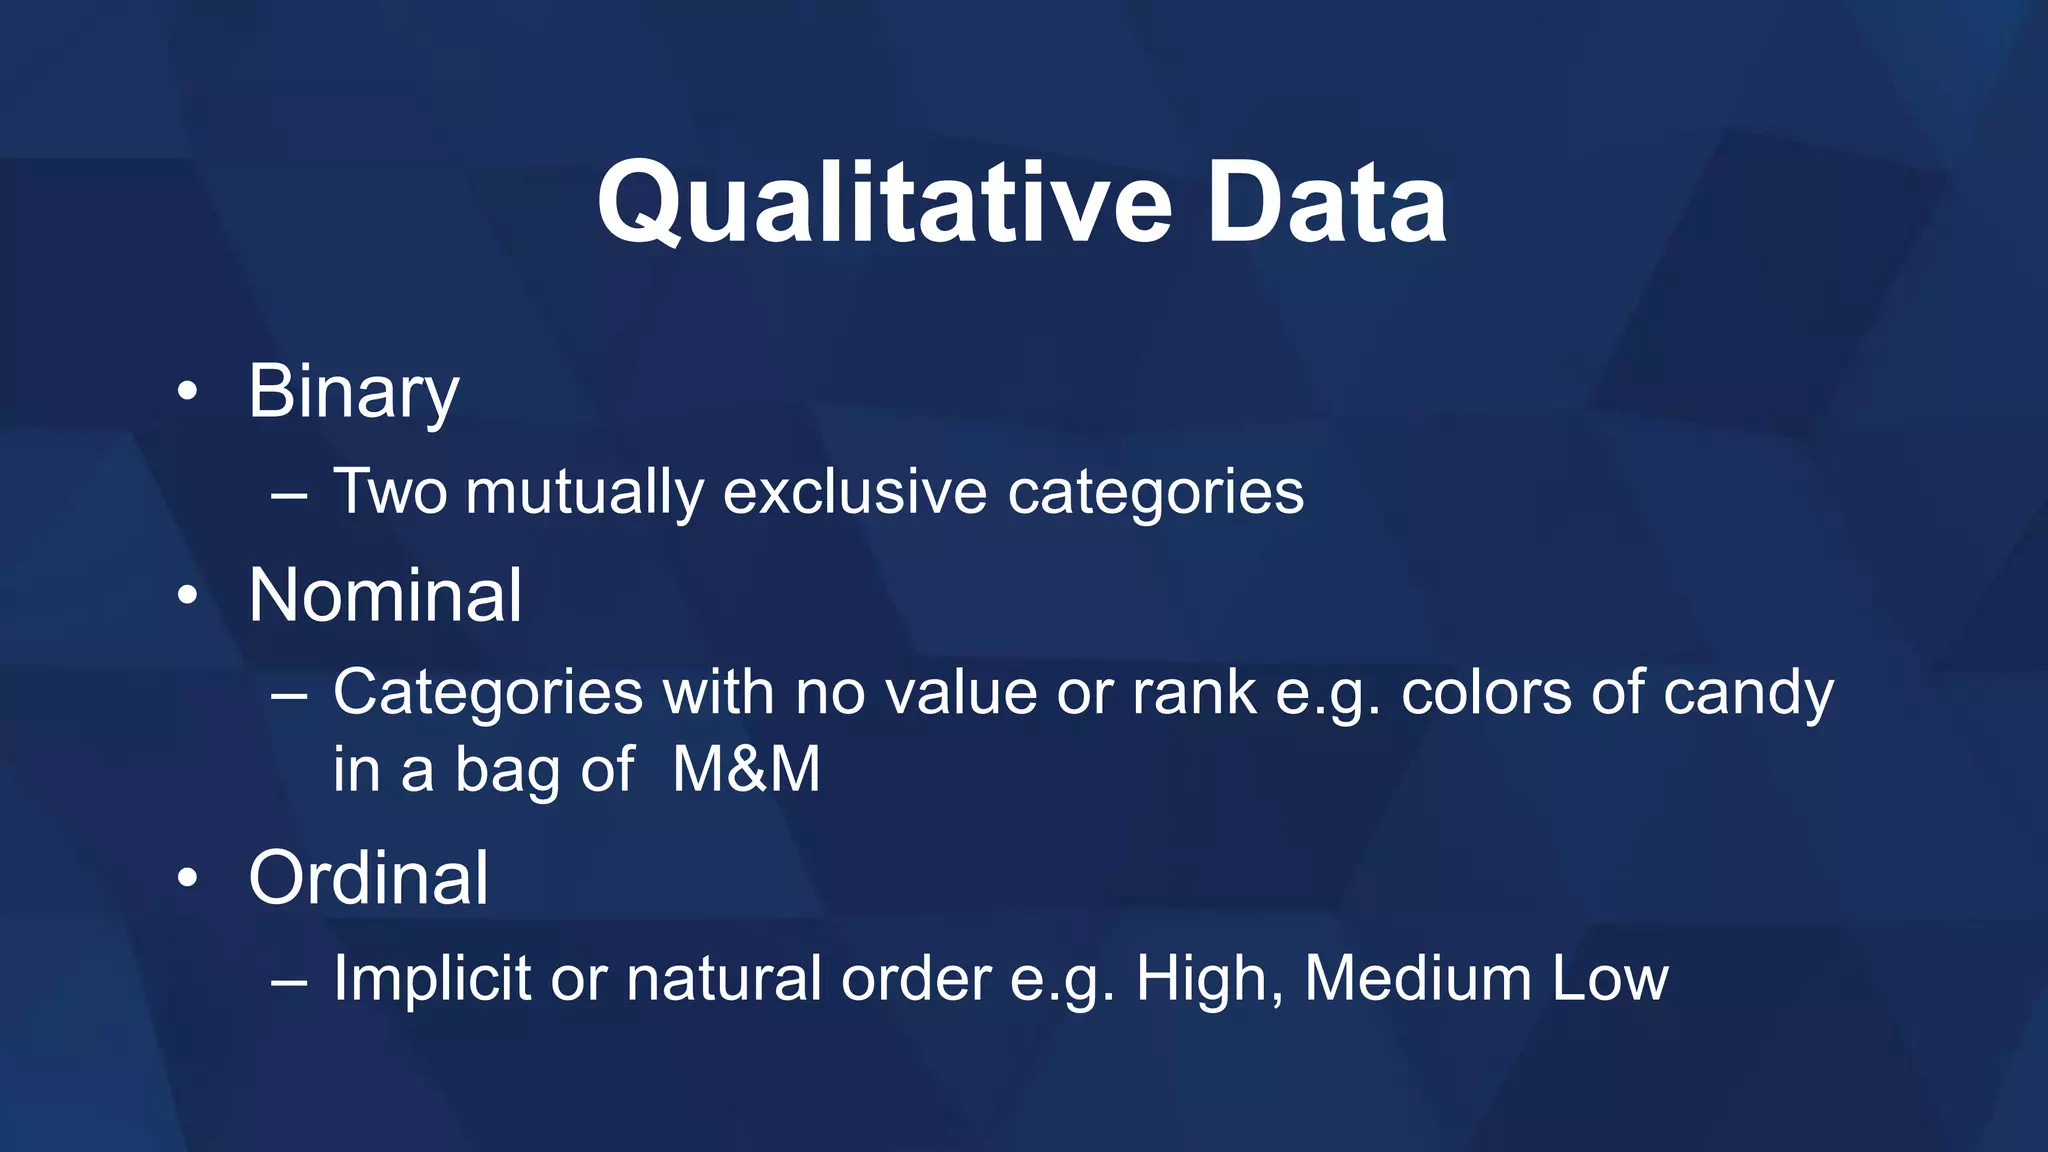
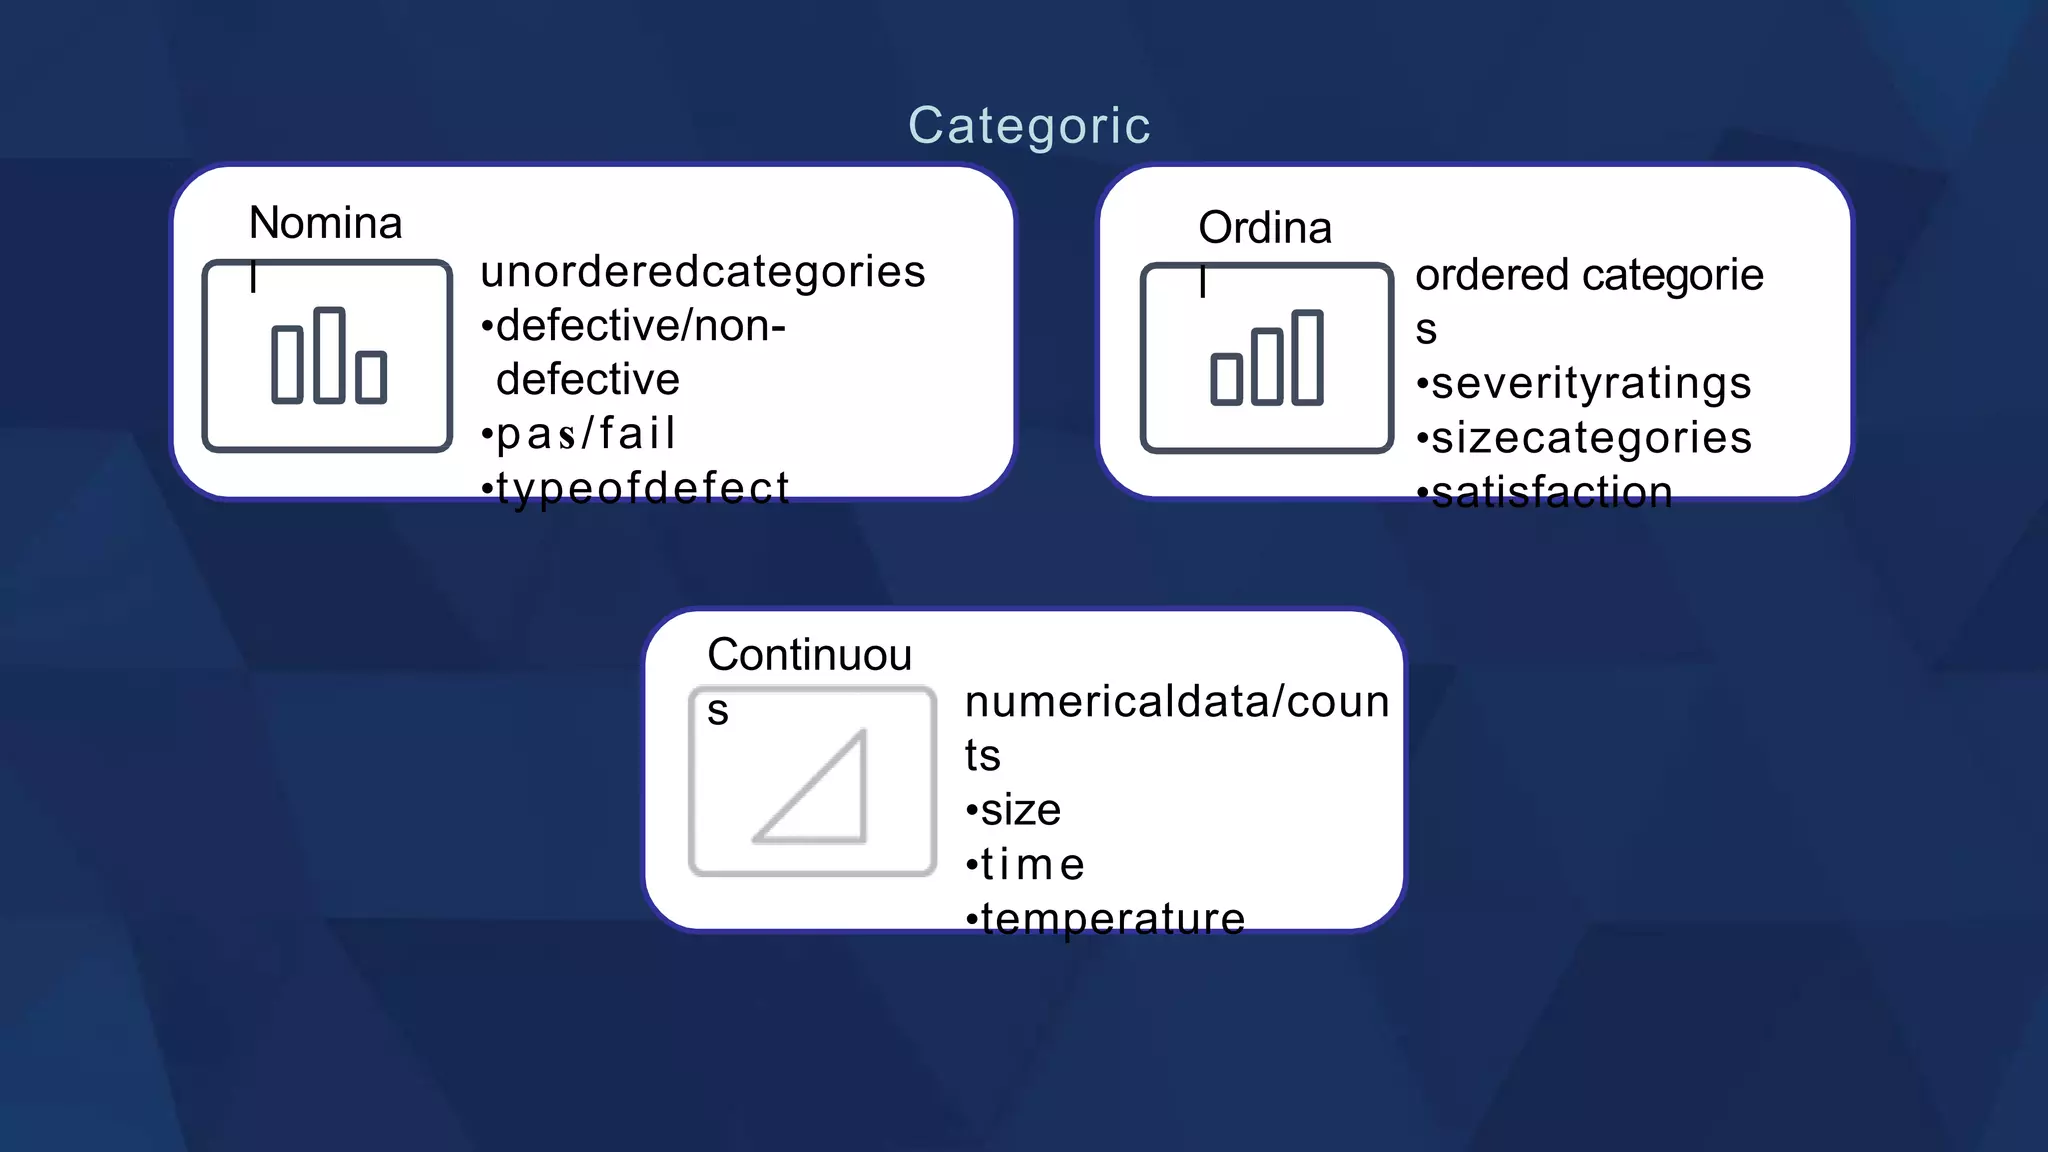
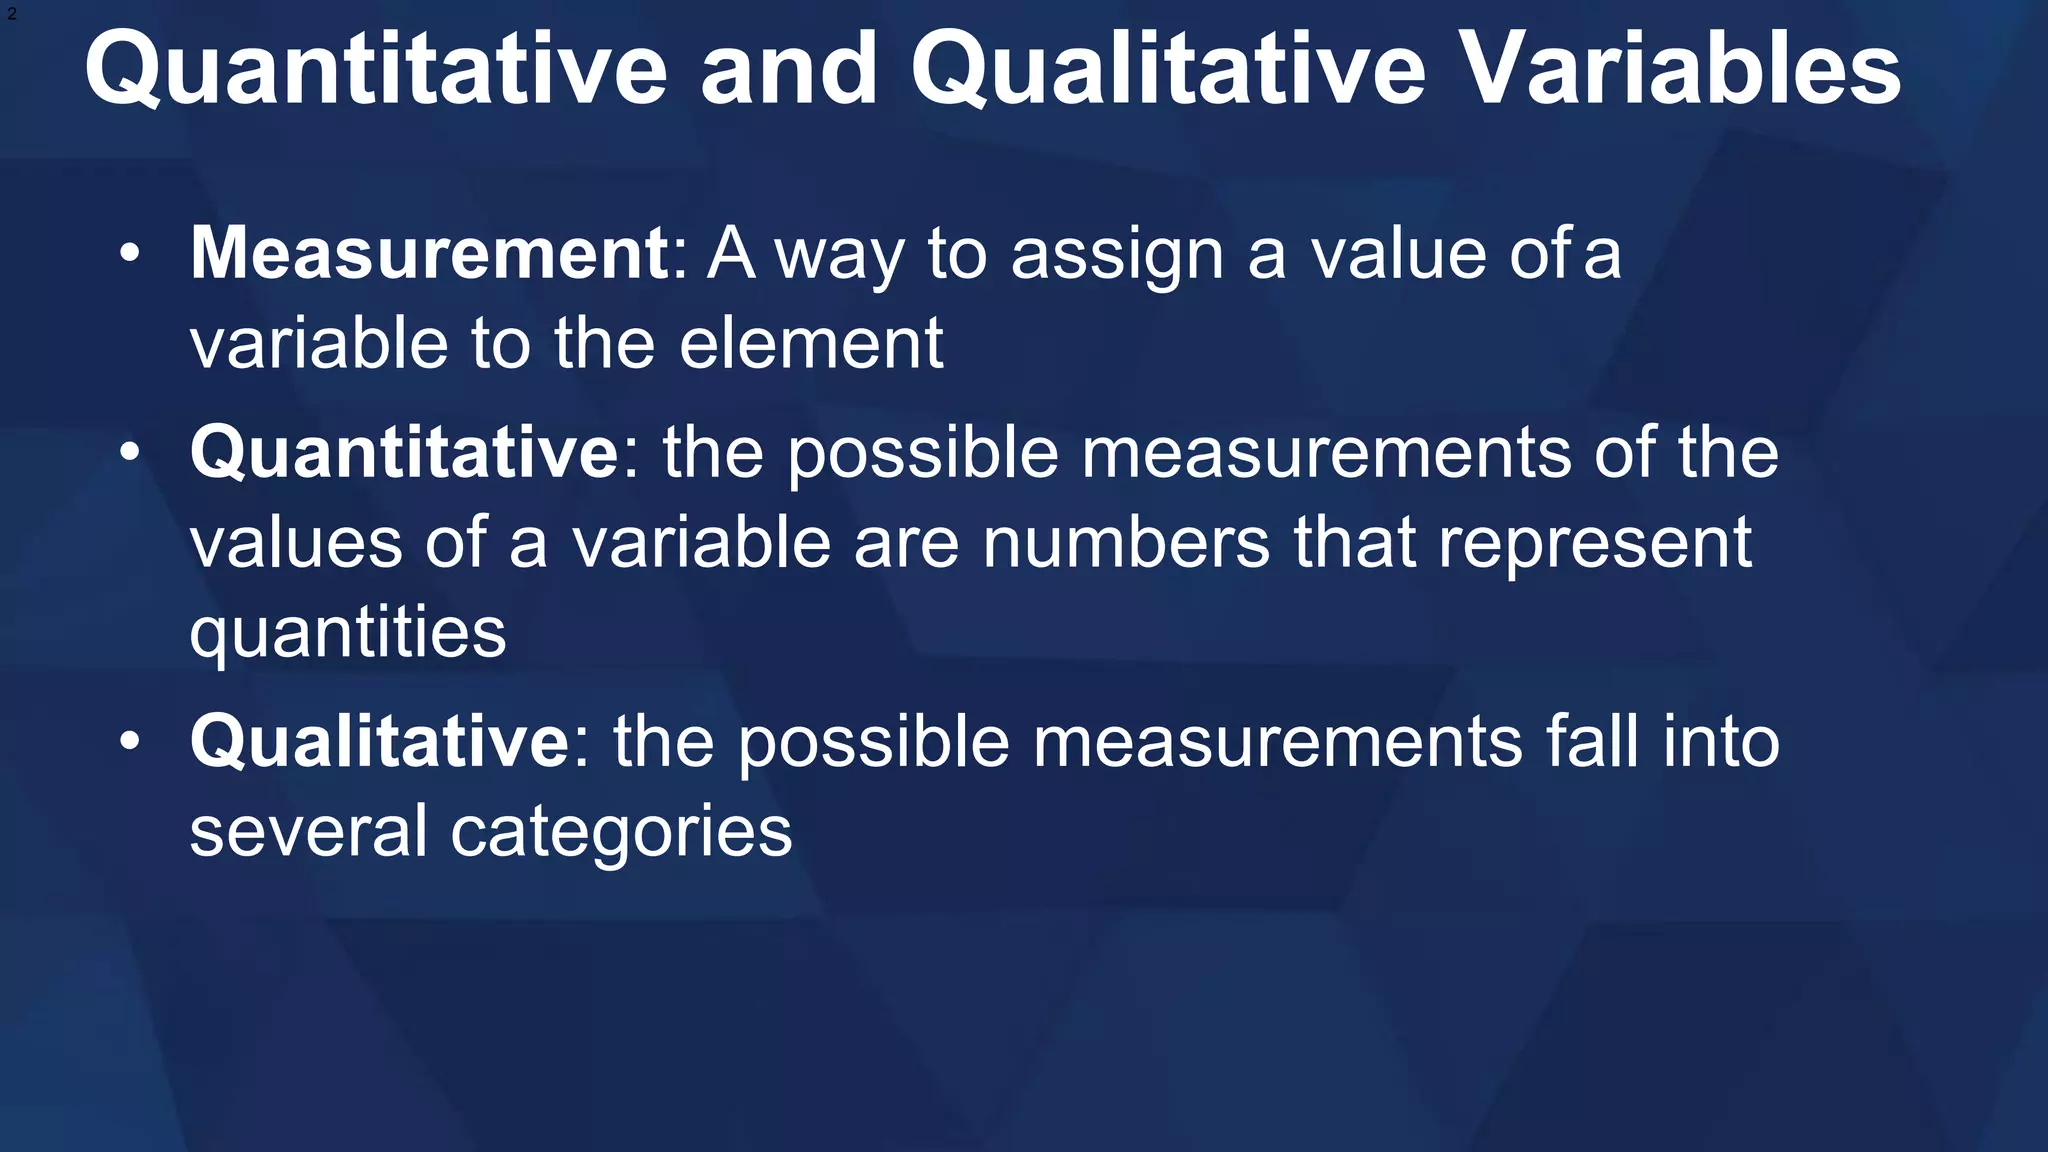
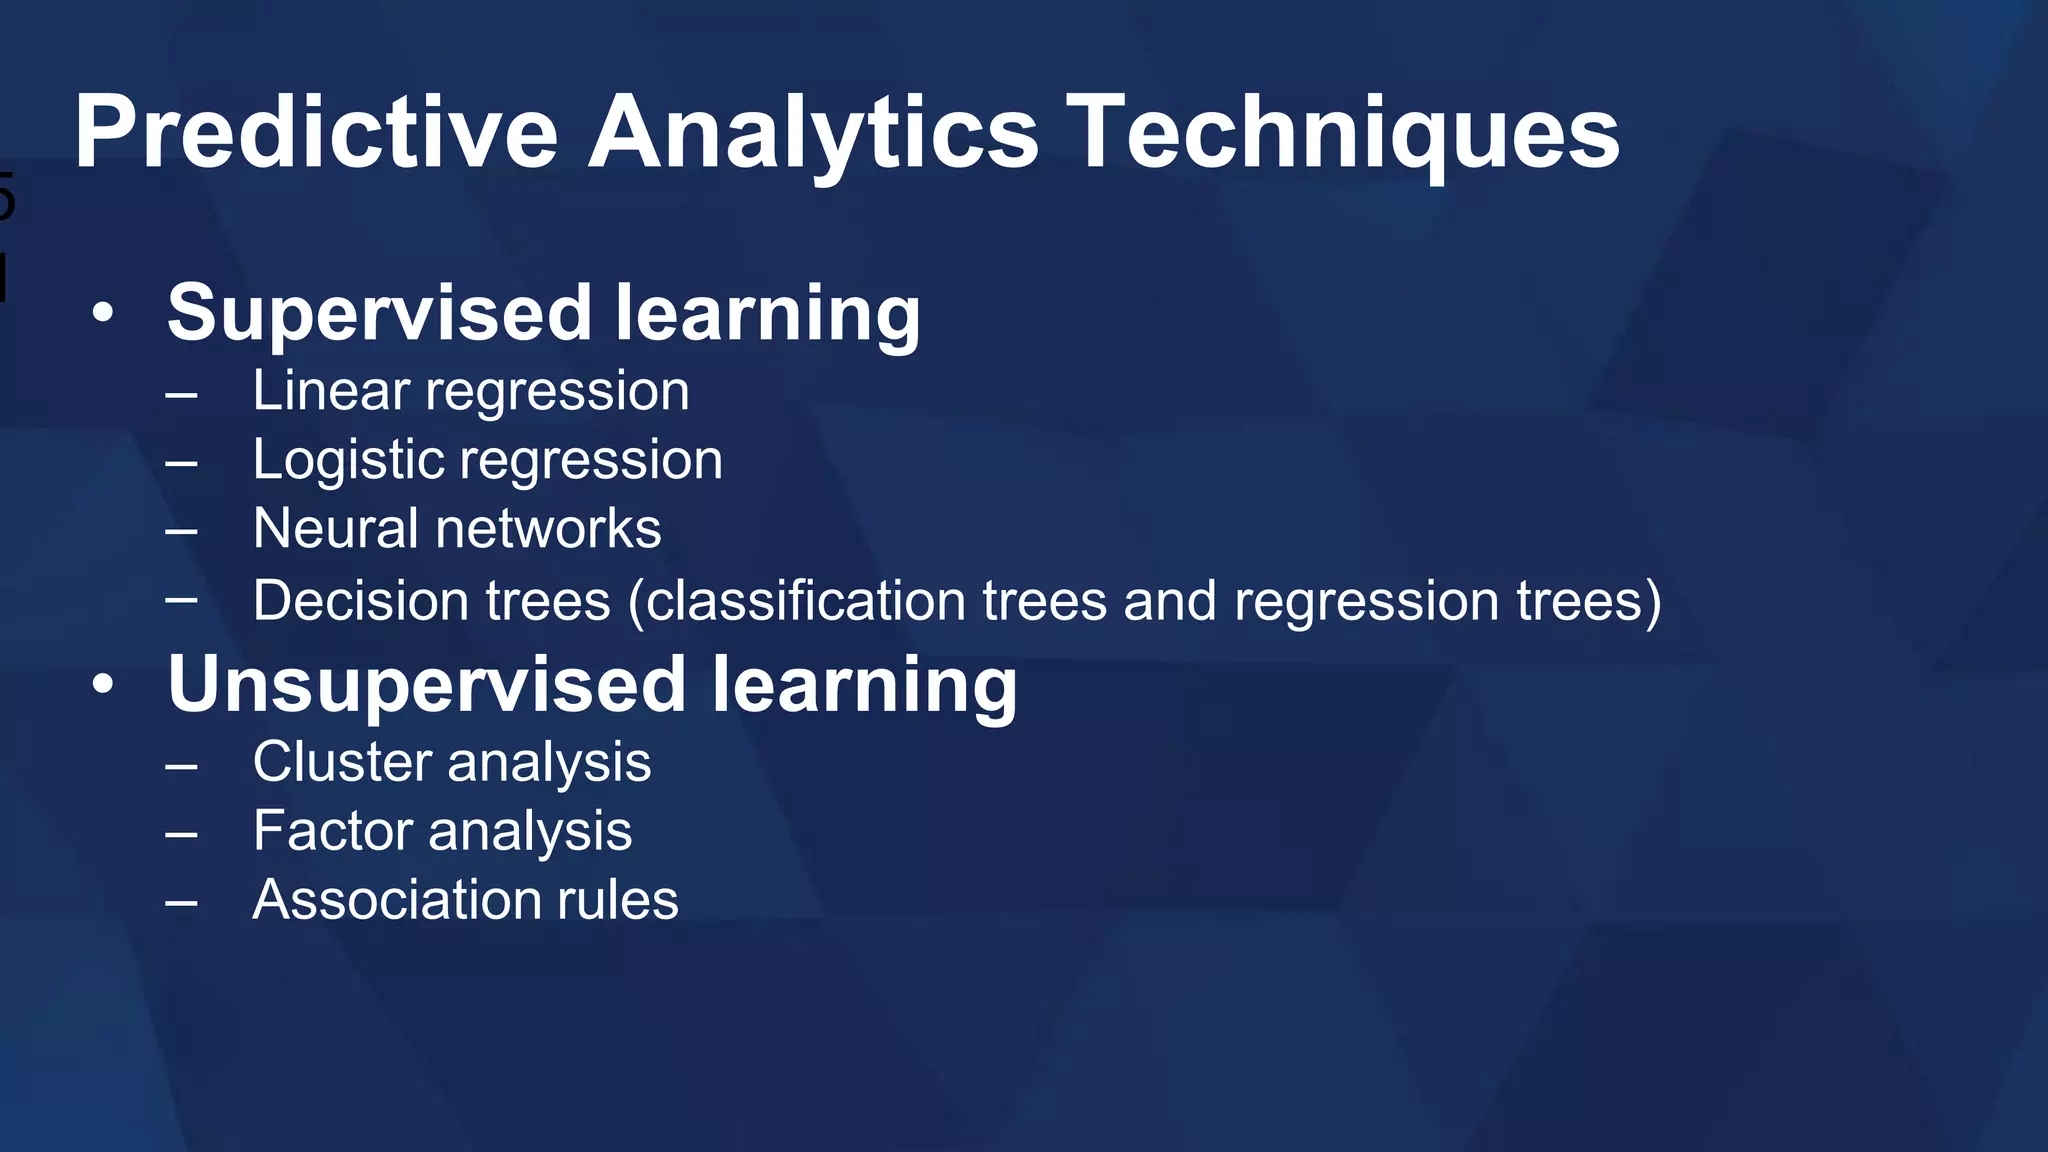
Defining a Problem
Data
Driven
Decisions
ANALYTICAL THINKING
Segment 1
Thephilosophyofproceslearningandactionbasedonthefollo
wing fundamentalprinciples:
•Alworkocursinasystemofinterconnectedproceses,
•Variationexistsinallproceses,and
•Understandingandreducingvariationarekeystosuces.
̶
ASQStatisticsDivision,GlosaryandTable
s
forStatisticalQualityControl,FourthEditio
n,
(Milwauke,WI:ASQQualityPres,2004).
AnalyticalThinking
Making Decisions with Data
• Quantify and interpret the variation you
observe
• Determine which method to use and when
Dotheyieldvaluesforweeks12and13indicaterealchangesintheproc
ess? Oraretheytheresultofrandom variation?
Use a control
chart for time-
.
ordered data
upper
control
limit
lower
control
limit
range o
f
random
variation
common cause
variation
(inherent o th
e proces)
typica
l
typica
l
Toimproveanyproces,younedtounderstand
...
•theproces
•thevariationintheproces
•thecausesofvariation
PROBLEM SOLVING
Segment II
Problem:
afailuretomeetthedesiredle
vel ofperformance
CommonProblem-
SolvingMethodologies
PDSA (PDCA) DMAIC (Six Sigma) A3 (Toyota) 8D (Eight Disciplines)
Plan
Define Clarify the problem
Form team and collect data
Measure
Break down the problem Describe the problem
Set the target/goal Contain the problem (interim)
Analyze
Analyze root causes Analyze root causes
Develop countermeasures Identify corrective actions
Do Improve Implement countermeasures Implement corrective actions
Study (Check)
Control
Evaluate results Implement preventive actions
Act Standardize success Verify and congratulate team
Identify
Problem/
Opportunity
Identify
Potential
Causes
Evaluate
and
Confirm
Causes
Identify
Potential
Solutions
Evaluate
and Select
Solutions
Implement
and
Confirm
Solutions
Standardize
, Monitor,
and Control
Process
AnalyticalProblemSolvin
g
P
r
o
b
l
e
m Cause Solution S
u
s
t
a
i
n
Identify
Problem/
Opportunity
Identify
Potential
Causes
Evaluate
and
Confirm
Causes
Identify
Potential
Solutions
Evaluate
and Select
Solutions
Implement
and
Confirm
Solutions
Standardize
, Monitor,
and Control
Process
AnalyticalProblemSolvin
g
Proble
m
Cause Solution S
u
s
t
a
i
n
Identify
Problem/
Opportunity
Identify
Potential
Causes
Evaluate
and
Confirm
Causes
Identify
Potential
Solutions
Evaluate
and Select
Solutions
Implement
and
Confirm
Solutions
Standardize
, Monitor,
and Control
Process
AnalyticalProblemSolvin
g
P
r
o
b
l
e
m Cause Solution S
u
s
t
a
i
n
SpectrumofProble
ms
Harder
Problems
Easier
Problems
Criteria Easier Problems Harder Problems
Time to solve Hours, days Months, years
Complexity Low, one-dimensional,
problem is well defined
High, multidimensional,
problem is ill defined
Scope Small, limited to one
process or one process
step
Large, problem spans
multiple processes or
organizational boundaries
Is there data? Relevant, high-quality data
are readily available
No relevant data, difficult to
measure, need to collect or
compile
Cause Single, identifiable Multiple, hard to identify,
interconnected
Success Measured, quantifiable Immeasurable, fuzzy
Solution Simple, straightforward Complex, multi-phased,
multi-dimensional
̶
W. Edwards Demin
g
InGodwetrust,
allothersmustbringdat
a!
Supportyourdecisionswithda
ta.
High
Low
Low High
Frequency o
f
Problem
s
Medium
ComplexityofProble
ms
Youcanusestatistic
al
thinking to solve mos
t problems.
DEFINING PROBLEM
Segment III
Existing
State
Desire
d
State
Proble
m
Identify
Problem/
Opportunity
Identify
Potential
Causes
Evaluate
and
Confirm
Causes
Identify
Potential
Solutions
Evaluate
and Select
Solutions
Implement
and
Confirm
Solutions
Standardize
, Monitor,
and Control
Process
AnalyticalProblemSolvin
g
Proble
m
Cause Solution Sustai
n
Poorly
Defined
Problem
Can't Identify
Root Causes
Can't Solve
Problem
Won’t
Collect
Right Data
Problem Statement
• what
• when
• where
• how much (how many)
Problem Statement
Problem Statement
The yields for black anodized parts are
extremely low.
initial
statement
Problem Statement
Currently, the black anodizing process has very low
daily yields, usually below 40%, and is averaging
19% yield. This results in high scrap and rework
costs. Also, Components Inc.'s largest customer is
threatening to find another supplier if quality and on-
time delivery are not substantially improved. In the
past six months, scrap and rework costs have
totaled approximately $450,000 and on-time
delivery is below 60%.
revised
statement
Project Goal Statement
Determinehowprogr
es
wilbemeasured.
Project Goal
Statement
Improve the black anodize process yield from
19% to a minimum of 90% by July xxxx (a six-
month timeframe).
DEFINING THE PROCESS
Segment IV
People
Materials
Environment
Methods
Machines
Measurements
Product or
Service
Input
s
Transformation Output
s
Process or System
The Cook,
Rice, Water, Salt,
Kitchen Temp,
Method Used,
Stove, Pot,
Cooking Temp
White Rice -
Tender, Fluffy,
Delicious
High-Level(Macro)ProcesMap
Make boiled white rice.
Inputs ProcesSteps
Outputs
To understand the process
1.Observe the process in action.
2.Interview people involved in the process.
3.Interview internal suppliers and internal
customers.
4.Review operating procedures or manuals.
People
Materials
Environment
Methods
Machines
Measurements
Product or
Service
Input
s
Output
s
SIPOC ma
p
High-
Level(Macro)Proces
Ma
p
Process or System
Transformation
WHAT IS DATA?
Segment V
What is Data?
• Data is the building block of modern economy
• Data can be in various formats
• Data can be subjective
• Data can be derived
• Data can be deceptive
Data
• Data: facts and figures from which conclusions can
be drawn
• Data set: the data that are collected for a particular
study
– Elements: may be people, objects, events, or otherentries
• Variable: any characteristic of an element
7
Data Types
• Quantitative data
– Numbers and things that can be measured
objectively
• Qualitative data
– Characters and descriptions that could have
subjective measurement
Quantitative Data
• Discrete
– Is a count e.g. number of students
– Whole numbers
• Continuous
– Is a linear measurement e.g. height, temperature
– Multiple levels of granularity
Qualitative Data
• Binary
– Two mutually exclusive categories
• Nominal
– Categories with no value or rank e.g. colors of candy
in a bag of M&M
• Ordinal
– Implicit or natural order e.g. High, Medium Low
Categoric
al
unorderedcategories
•defective/non-
defective
•pas/fail
•typeofdefect
Nomina
l
Ordina
l ordered categorie
s
•severityratings
•sizecategories
•satisfaction
Continuou
s numericaldata/coun
ts
•size
•time
•temperature
Quantitative and Qualitative Variables
• Measurement: A way to assign a value of a
variable to the element
• Quantitative: the possible measurements of the
values of a variable are numbers that represent
quantities
• Qualitative: the possible measurements fall into
several categories
2
Cross-Sectional Data
• Cross-sectional data: Data collected at the
same or approximately the same point in time
• Time series data: data collected over
different time periods
3
Data Sources, Data Warehousing,
and Big Data
• Existing sources: data already gathered by public or private sources
–
–
–
–
Internet
Library
US Government
Data collection agency
• Experimental and observational studies: data we collect ourselves
for a specific purpose
–
–
Response variable: variable of interest
Factors: other variables related to response variable
4
Transactional Data, Data Warehousing,
and Big Data
• Companies hope to use past behavior and other
information to predict customer responses
• Data warehousing: a process of centralized data
management and retrieval
– Its objective is the creation and maintenance of a central repository for all
of an organization’s data
• Big data: massive amounts of data
–
–
Often collected in real time in different forms
Sometimes needing quick analysis
BUSINESS ANALYTICS AND
BIG DATA
Segment VI
Business Analytics
• The use of traditional and newly developed
statistical methods, advances in IS, and
techniques from management science to
explore and investigate past performance
4
7
Business Analytics Terms
• Descriptive Analytics
• Predictive Analytics
• Prescriptive Analytics
4
8
Descriptive Analytics
• Descriptive analytics is the interpretation of
historical data to better understand a problem
– Useful in discovering historical trends
– Identifying problems with data
– Providing preliminary relationship amongst
variables
Applications of Predictive Analytics
• Anomaly (outlier) detection
• Association learning
• Classification
• Cluster detection
• Prediction
• Factor detection
5
0
Predictive Analytics Techniques
• Supervised learning
–
–
–
–
Linear regression
Logistic regression
Neural networks
Decision trees (classification trees and regression trees)
• Unsupervised learning
–
–
–
Cluster analysis
Factor analysis
Association rules
5
1
Prescriptive Analytics
5
2
Techniques that combine external and internal
constraints with results from descriptive or predictive
analytics to recommend an optimal course of action

Module_1___Analytical_Thinking___Problem_Solving.ppt.pptx