Download as PDF, PPTX


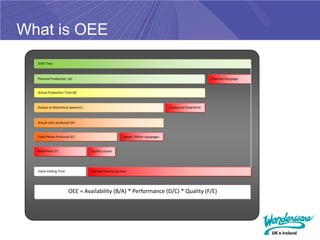


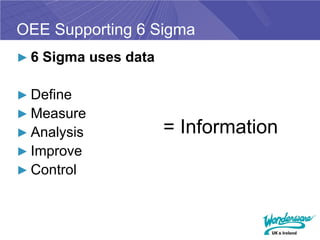
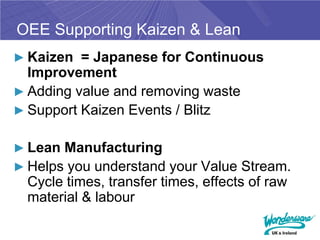


The document discusses the importance of Overall Equipment Effectiveness (OEE) in optimizing manufacturing efficiency, emphasizing its role in driving improvements, monitoring performance, and reducing costs. It outlines the components of OEE, such as availability, performance, and quality, and the necessity of a culture that supports its implementation across all levels of a company. Additionally, it highlights the value of real-time data collection and reporting in continuous improvement initiatives like lean manufacturing and Six Sigma.


