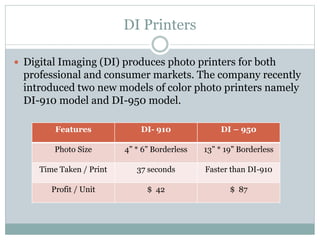
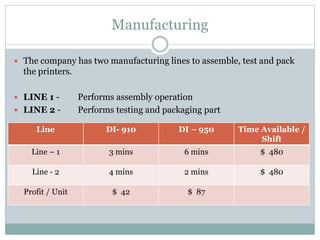
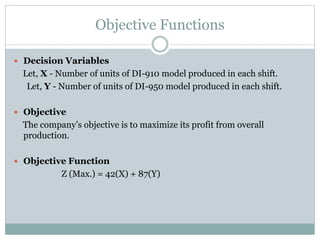
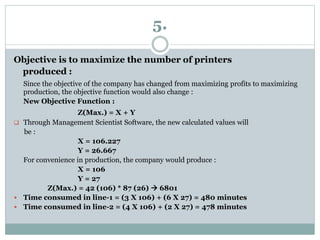
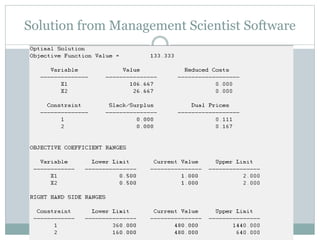
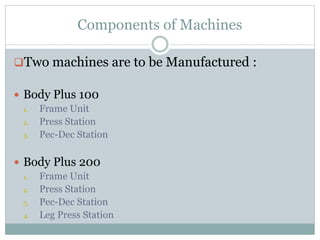
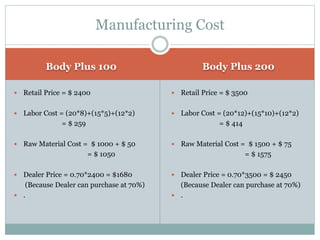
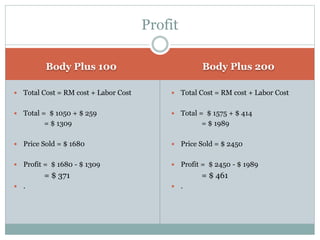
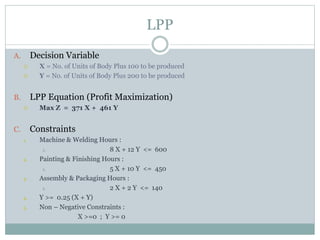
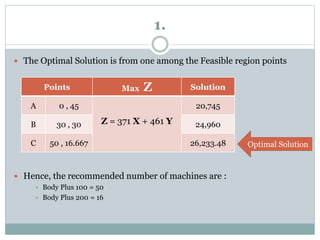
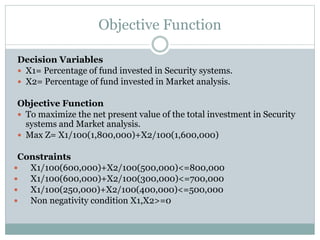
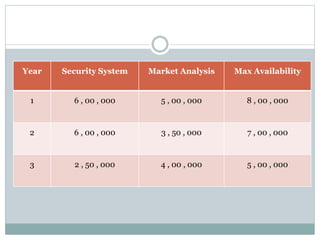
Operational Research
Brenda Gaytan
CASE STUDY
1. Workload Balancing
2. Production Strategy
3. Hart Venture Capital
4. Product Mix
5. Investment Strategy
DIGITAL IMAGING (DI)
PHOTO PRINTERS
( A N I N T R O D U C T I O N T O M A N A G E M E N T S C I E N C E )
P G : 8 4 - 8 5
WORKLOAD BALANCING
DI Printers
 Digital Imaging (DI) produces photo printers for both
professional and consumer markets. The company recently
introduced two new models of color photo printers namely
DI-910 model and DI-950 model.
Features DI- 910 DI – 950
Photo Size 4” * 6” Borderless 13” * 19” Borderless
Time Taken / Print 37 seconds Faster than DI-910
Profit / Unit $ 42 $ 87
Manufacturing
 The company has two manufacturing lines to assemble, test and pack
the printers.
 LINE 1 - Performs assembly operation
 LINE 2 - Performs testing and packaging part
Line DI- 910 DI – 950 Time Available /
Shift
Line – 1 3 mins 6 mins $ 480
Line - 2 4 mins 2 mins $ 480
Profit / Unit $ 42 $ 87
Objective Functions
 Decision Variables
Let, X - Number of units of DI-910 model produced in each shift.
Let, Y - Number of units of DI-950 model produced in each shift.
 Objective
The company’s objective is to maximize its profit from overall
production.
 Objective Function
Z (Max.) = 42(X) + 87(Y)
Constraints
 Subject To :
For Line 1
3X + 6Y <= 480
For Line 2
4X + 2Y <= 480
Non-Negativity Constraints
X >= 0
Y >= 0
1 (a).
Recommended number of units of each printer to be produced to maximize
the profit :
No. of DI-910 model printers to be produced i.e. X = 0
No. of DI-950 model printers to be produced i.e. Y = 80
Z(Max.) = 42 (0) * 87 (80)  6960
 Now while producing 80 DI-950 printers :
Time used in Assembly Line = 6 X 80 = 480 minutes
Time used in Testing & Packaging = 2 X 80 = 160 minutes
 Time i.e. not utilised in Testing & Packaging = 480 – 160 = 320
minutes
 Line -2 i.e. Testing & Packaging is Idle for 320 minutes/shift
Area under ABCD
is the feasible region
Optimal solution i.e.
Z(max) is at A = 6960
(b).
Possible reasons for not implementing the recommendation :
Thus, management may not be manufacturing only DI-
950 model printers as :
 Resources on Line 2 will not be utilized fully as there will be an
idle time of 320 minutes (more than half of the total time of the
shift).
 Production/Supply of DI-950 model printers may be in excess of
market demand.
 Demand of DI-910 model printers will be left unfulfilled.
Solution from Management Scientist Software
2.
DI Company wants to produce as many DI-910
model printers as DI-950 model printers :
 Now in this case, a new constraint will further be added to the original
problem :
X >= Y, or
X – Y >= 0
We will achieve our optimal point at :
X = 53.33
Y = 53.33
But since production of printers can not be done in this way,
the company would produce :
X = 54
Y = 53
Z(Max.) = 42 (54) * 87 (53)  6880
Feasible region is ABCD
Optimal point at A (x=54,y=53)
Max. profit i.e. Zmax = 6880
Solution from Management Scientist Software
3.
Analysis of resource utilization on Line 1 and Line 2 in reference to
solution developed in part (2) :
Time used in Assembly line = (3 X 54) + (6 X 53) = 480
minutes
Time used in Testing & Packaging = (4 X 54) + (2 X 53) = 322
minutes
 Time i.e. not utilized in Testing & Packaging =
480 – 322 = 158 minutes
Now as there is a lot of time in Line 2 still unused, the main
concern for the company would be how to utilize this unused
time in a productive manner so that it add value to the
company as well as its profits.
4.
Management wants to limit the time difference between both the lines
by 30 minutes or less :
In this case, a new constraint will be added to the original problem :
(3X + 6Y ) – (4X + 2Y) <= 30, or
- X + 4Y <= 30
 Through Management Scientist Software, the new calculated values will
be :
X = 96.667
Y = 31.667
Z(Max.) = 42(96.667) + 87(31.667)  6815
 Time consumed in Line 1 = (3 X 96.667) + (6 X 31.667) = 480 minutes
 Time consumed in Line-2 = (4 X 96.667) + (2 X 31.667) = 450 minutes
Time Difference = 480 – 450  30 minutes
Solution from Management Scientist Software
Feasible region is ABCD
Optimal solution is at A (x=96.667,y=31.667)
Max. profit i.e. Zmax= 6815
 Now again since the production of printers can not be
done in this way, the company would produce :
X = 98
Y = 31
Z(Max.) = 42 (98) * 87 (31)  6813
 Time consumed in Line 1 = (3 X 98) + (6 X 31) = 480 minutes
 Time consumed in Line-2 = (4 X 98) + (2 X 31) = 454 minutes
Time Difference = 480 – 454  26 minutes
5.
Objective is to maximize the number of printers
produced :
Since the objective of the company has changed from maximizing profits to maximizing
production, the objective function would also change :
New Objective Function :
Z(Max.) = X + Y
 Through Management Scientist Software, the new calculated values will
be :
X = 106.227
Y = 26.667
For convenience in production, the company would produce :
X = 106
Y = 27
Z(Max.) = 42 (106) * 87 (26)  6801
 Time consumed in line-1 = (3 X 10⁶) + (6 X 27) = 480 minutes
 Time consumed in line-2 = (4 X 10⁶) + (2 X 27) = 478 minutes
Solution from Management Scientist Software
BETTER FITNESS INC. (BFI)
EXERCISE EQUIPMENT MANUFACTURING
( A N I N T R O D U C T I O N T O M A N A G E M E N T S C I E N C E )
P G : 8 5 - 8 6
PRODUCTION STRATEGY
Components of Machines
Two machines are to be Manufactured :
 Body Plus 100
1. Frame Unit
2. Press Station
3. Pec-Dec Station
 Body Plus 200
1. Frame Unit
2. Press Station
3. Pec-Dec Station
4. Leg Press Station
Activities Involved in Manufacturing
 There are various activities involved in per unit
manufacturing of ‘Body Plus 100’ and ‘Body Plus 200’ :
 Machining and Welding
 Painting and Finishing
 Assembling, Packaging and Testing
 Three of these activities take separate time for both the
machines
Body Plus 100
Machine &
Welding
Time
(Hrs)
Painting &
Finishing
Time
(Hrs)
Assembling,
Testing &
Packaging
(Hrs)
Raw
Material
Cost
($)
Packaging
Cost
($)
Frame Unit 4 2
2
450
50Press Station 2 1 300
Pec-Dec Station 2 2 250
Total 8 5 2 1000 50
Body Plus 200
Machine &
Welding
Time
(Hrs)
Painting &
Finishing
Time
(Hrs)
Assembling,
Testing &
Packaging
(Hrs)
Raw
Material
Cost
($)
Packaging
Cost
($)
Frame Unit 5 4
2
650
75
Press Station 3 2 400
Pec-Dec Station 2 2 250
Leg Press
Station
2 2 200
Total 12 10 2 1500 75
Process Time
Machine & Welding
Time
Painting & Finishing
Time
Assembling, Testing
& Packaging Time
Labor Cost / Hour $ 20 $ 15 $ 12
Total Time (Hrs) Cost / Hour
Machine & Welding Time 600 20
Painting & Finishing Time 450 15
Assembling, Testing and Packaging Time 140 12
For the Next Production Period Management Estimates the Hours and Labor Cost
Body Plus 100 Body Plus 200
 Retail Price = $ 2400
 Labor Cost = (20*8)+(15*5)+(12*2)
= $ 259
 Raw Material Cost = $ 1000 + $ 50
= $ 1050
 Dealer Price = 0.70*2400 = $1680
(Because Dealer can purchase at 70%)
 .
 Retail Price = $ 3500
 Labor Cost = (20*12)+(15*10)+(12*2)
= $ 414
 Raw Material Cost = $ 1500 + $ 75
= $ 1575
 Dealer Price = 0.70*3500 = $ 2450
(Because Dealer can purchase at 70%)
 .
Manufacturing Cost
Body Plus 100 Body Plus 200
 Total Cost = RM cost + Labor Cost
 Total = $ 1050 + $ 259
= $ 1309
 Price Sold = $ 1680
 Profit = $ 1680 - $ 1309
= $ 371
 .
 Total Cost = RM cost + Labor Cost
 Total = $ 1575 + $ 414
= $ 1989
 Price Sold = $ 2450
 Profit = $ 2450 - $ 1989
= $ 461
 .
Profit
LPP
A. Decision Variable
 X = No. of Units of Body Plus 100 to be produced
 Y = No. of Units of Body Plus 200 to be produced
B. LPP Equation (Profit Maximization)
 Max Z = 371 X + 461 Y
C. Constraints
1. Machine & Welding Hours :
1. 8 X + 12 Y <= 600
2. Painting & Finishing Hours :
1. 5 X + 10 Y <= 450
3. Assembly & Packaging Hours :
1. 2 X + 2 Y <= 140
4. Y >= 0.25 (X + Y)
5. Non – Negative Constraints :
X >=0 ; Y >= 0
Plotted Graph
1.
 The Optimal Solution is from one among the Feasible region points
 Hence, the recommended number of machines are :
 Body Plus 100 = 50
 Body Plus 200 = 16
Points Max Z Solution
A 0 , 45
Z = 371 X + 461 Y
20,745
B 30 , 30 24,960
C 50 , 16.667 26,233.48 Optimal Solution
2.
 If the constraint of “producing atleast 25% of Body Plus 200” is
removed.
 Then the graph shall be plotted for the following constraints:
1. Machine & Welding Hours :
1. 8 X + 12 Y <= 600
2. Painting & Finishing Hours :
1. 5 X + 10 Y <= 450
3. Assembly & Packaging Hours :
1. 2 X + 2 Y <= 140
4. Non – Negative Constraints :
X >=0 ; Y >= 0
New Graph
New Solution
 The Optimal Solution is from one among the Feasible region points
 Hence, the recommended number of machines are :
 Body Plus 100 = 60
 Body Plus 200 = 10
 The Profit Margin Increases by
= $ 26,870 - $ 26,233.48
= $ 636.52
Points Max Z Solution
A 0 , 45
Z = 371 X + 461 Y
20,745
B 30 , 30 24,960
C 60 , 10 26,870
D 70 , 0 25,970
Optimal Solution
3.
 We can see that the “Upper Limit” in ‘X’ is not fixed, whereas in ‘Y’ it is
1113 units
 When looking at the Objective function Coefficient ranges we see that
the objective function yields maximum profits (1113 units) by selling
only Body Plus 200.
 Also, the reduced costs of manufacturing only Body Plus 200 is 652.
 Therefore, the efforts should be expended, in Body Plus 200 to yield
maximum profit.
Software Solution
HART VENTURE CAPITAL (HVC)
VENTURE CAPITAL FOR SOFTWARE
DEVELOPMENT
( A N I N T R O D U C T I O N T O M A N A G E M E N T S C I E N C E )
P G : 8 6 - 8 7
HART VENTURE CAPITAL
Objective Function
Decision Variables
 X1= Percentage of fund invested in Security systems.
 X2= Percentage of fund invested in Market analysis.
Objective Function
 To maximize the net present value of the total investment in Security
systems and Market analysis.
 Max Z= X1/100(1,800,000)+X2/100(1,600,000)
Constraints
 X1/100(600,000)+X2/100(500,000)<=800,000
 X1/100(600,000)+X2/100(300,000)<=700,000
 X1/100(250,000)+X2/100(400,000)<=500,000
 Non negativity condition X1,X2>=0
Year Security System Market Analysis Max Availability
1 6 , 00 , 000 5 , 00 , 000 8 , 00 , 000
2 6 , 00 , 000 3 , 50 , 000 7 , 00 , 000
3 2 , 50 , 000 4 , 00 , 000 5 , 00 , 000
Graph
0
0.2
0.4
0.6
0.8
1
1.2
1.4
1.6
1.8
2
0 0.2 0.4 0.6 0.8 1 1.2 1.4 1.6 1.8 2
Y=Percentageofinvestmentinmarketanalysis
X = Percentage of investment in security system
600000X+500000Y<800000
600000X+350000Y<700000
250000X+400000Y<500000
1.
 HVC should invest 60.87% in Security systems and 86.95%
in Market analysis.
 Net present value of total investment is $2,486,956.522
2.
 Capital Allocation Plan :
Year 1 Year 2 Year 3
Security Systems $ 3, 65, 220 $ 3, 65, 220 $ 1, 52, 175
Market Analysis $ 4, 34, 750 $ 3, 04, 325 $ 3, 47, 800
Slack Funds $ 30 $ 30, 455 $ 25
3.
 Assuming that the additional $100000 is made available to
HVC to be invested in any year.
 HVC should choose to invest these funds in these
proportions in the two projects
 The following effects will take place :
A. % invested funded for Security Systems will become 68%
B. % invested funded for Market Analysis will become 82%
C. Net Present Value will become $2536000.
Year 1 Year 2 Year 3
Security Systems $ 4, 08, 000 $ 4, 08, 000 $ 1, 70, 000
Market Analysis $ 4, 10, 000 $ 2, 87, 000 $ 3, 28, 000
Slack Funds $ 82, 000 $ 5, 000 $ 2, 000
4.
 Assuming the additional $100000 is committed for
the first year itself, the capital allocation plan is
 For Security systems:
1. Year 1 = $413,112
2. Year 2 = $413,112
3. Year 2 = $172,130
 For market analysis:
1. Year 1 = $409,835
2. Year 2 = $286,884
3. Year 2 = $327,868
5.
 As we saw, when an additional $100000 is invested,
the net present value goes up by $49140 with a slack
of $89000. These slack funds may be reinvested in
lucrative options available with HVC.
TJ’S INC.
NUT MIXES FOR SALE TO GROCERY
CHAINS
( A N I N T R O D U C T I O N T O M A N A G E M E N T S C I E N C E )
P G : 1 5 1 - 1 5 2
PRODUCT MIX
Problem
 TJ’s Incorporated makes three nut mixes for sale to grocery chains located in
the southeast. The three mixes, referred to as the Regular Mix, the Deluxe Mix,
and the Holiday Mix, are made by mixing different percentages of types of nuts.
 In preparation for the fall season, TJ’s has just purchased the following
shipments of nuts at the prices shown :
Type of Nut Shipment Amount Cost per Shipment
Almond 6000 7500
Brazil 7500 7125
Filbert 7500 6750
Pecan 6000 7200
Walnut 7500 7875
Percentage of Nuts Regular Mix Deluxe Mix Holiday Mix
Almonds 15 % 20 % 25 %
Brazil Nuts 25 % 20 % 15 %
Filberts 25 % 20 % 15 %
Pecans 10 % 20 % 25 %
Walnuts 25 % 20 % 20 %
Type of Mix Profit Contribution
Per Unit
Orders
Regular Mix $ 1.65 10, 000
Deluxe Mix $ 2.00 3, 000
Holiday Mix $ 2.25 5, 000
Managerial Report
Perform an analysis of TJ’s product mix problem, and prepare a report for
TJ’s president that summarizes your finding. Be sure to include
information and analysis on the following:
1. The cost per pound of the nuts included in the Regular, Deluxe, and
Holiday mixes.
2. The optimal product mix and the total profit contribution.
3. Recommendations regarding how the total profit contribution can be
increased if additional quantities of nuts can be purchased.
4. A recommendation as to whether TJ’s should purchase an additional
1,000 pounds of almonds for $1,000 from a supplier who overbought.
5. Recommendations on how profit contribution could be increased (if
at all) if TJ’s does not satisfy all existing orders.
L.P.P Formulation
Decision variables :
 R = pounds of Regular Mix
 D = pounds of Deluxe Mix
 H = pounds of Holiday Mix
Objective function :
 Z = 1.65R + 2.00D + 2.25H - 36450
Constraints
 R > 10000
 D > 3000
 H > 5000
 .15R + .20D + .25H < 6000
 .15R + .20D + .15H < 7500
 .10R + .20D + .25H < 6000
 .25R + .20D + .20H < 7500
 R, D, H > 0
S
o
l
u
t
i
o
n
F
r
o
m
M
a
n
a
g
e
m
e
n
t
S
c
i
e
n
t
i
s
t
S
o
f
t
w
a
r
e
Interpretation
 The Objective Function Value : optimal solution - maximum profit -
$61375.
 Subtract $36450 from the original Objective Function Value
 Subtract the total cost per shipment of the different nuts,
 Optimal Solution - maximum profits - $24935.
 Optimal decision production = 17500 of regular mix,10625 of deluxe mix,
and 5000 of holiday mix.
 Optimal solution exceeds the customer orders for regular Mix by 7500
pounds
 Optimal solution exceeds the customer orders for deluxe Mix by 7625
pounds
 Holiday mix binding constraint(zero surplus)
 The negative dual price indicates that increasing the customer orders for
Holiday mix from 5000 to 5001 pounds will actually decrease the profit
contribution by $0.18.
Recommendations
 Increase the quantity of almonds and walnuts purchased by Tj’s and
increase their profit contribution at rate of $8.5 per pound of almonds
and $1.5 per pound of walnuts.
 No more buying of brazil nuts, filberts and pecans.
 Almonds - For each additional pound purchased the profit would
increase @ $8.5 for 583 pounds.
 Walnuts - For each additional pound purchased the profit would
increase @ $1.5 for 250 pounds.
 Dual price of -.175 for the pounds of holiday mix indicate the desire to
reduce the production of this mix.
 The range of feasibility indicates the need to reduce the customer
orders to zero and the value of reduction @ $.18 per pound.
J.D. WILLIAMS INC.
INVESTMENT ADVISORY FIRM
( A N I N T R O D U C T I O N T O M A N A G E M E N T S C I E N C E )
P G : 1 5 2 - 1 5 3
INVESTMENT STRATEGY
Objective Function
The Case talks about an Investment Advisory firm having more than $120
million of funds with numerous clients.
The problem at hand is about an $800,000 new investment which is to be
invested in three portfolios
Therefore
Decision Variables:
X1=Investment in growth fund
X2=Investment in income fund
X3=Investment in money market fund
Objective Function:
Maximize Z= 0.18X1+0.125X2+0.075X3
Constraints
Subject to:
1) -0.8 X1+0.2 X2+0.2 X3<0
2) -0.6 X1+0.4 X2+0.4 X3>0
3) 0.2 X1-0.8 X2+0.2 X3<0
4) 0.5 X1-0.5 X2+0.5 X3>0
5) 0.3 X1+0.3 X2-0.7 X3<0
6) 1 X1+1 X2+1 X3=800000
7) 0.05 X1+0.02 X2-0.04 X3<0
Solution
LINEAR PROGRAMMING PROBLEM
Max Z = 0.18 X1+0.125 X2+0.075 X3
OPTIMAL SOLUTION
Objective Function Value = 94133.333
Variable Value Reduced Costs
-------------- --------------- ------------------
X1 248888.889 0.000
X2 160000.000 0.000
X3 391111.111 0.000
Constraint Slack/Surplus Dual Prices
-------------- --------------- ------------------
1 88888.889 0.000
2 71111.111 0.000
3 0.000 0.020
4 240000.000 0.000
5 151111.111 0.000
6 0.000 0.118
7 0.000 1.167
OBJECTIVE COEFFICIENT RANGES
Variable Lower Limit Current Value Upper Limit
------------ --------------- --------------- ---------------
X1 0.150 0.180 No Upper Limit
X2 No Lower Limit 0.125 0.145
X3 0.015 0.075 0.180
RIGHT HAND SIDE RANGES
Constraint Lower Limit Current Value Upper Limit
------------ --------------- --------------- ---------------
1 -88888.889 0.000 No Upper Limit
2 No Lower Limit 0.000 71111.111
3 -133333.333 0.000 106666.667
4 No Lower Limit 0.000 240000.000
5 -151111.111 0.000 No Upper Limit
6 0.000 800000.000 No Upper Limit
7 -8000.000 0.000 6400.000
1.
From the above solution out of 800,000 the
investment should be as follows:
Growth Fund: $248888.889
Income Fund: $160000.000
Money Market Fund: $391111.111
The annual growth anticipated from the investment
recommendation is $94133.333
2.
 If the clients risk index increased from 0.05 to 0.055
 The new yield index would increase by $4666.67 to
$98800
3 (a).
If the annual yield for growth fund is decreased to 16% for
Growth then the investment recommendation would be
as follows
Growth fund :$248890; Change: 1.111
Income Fund :$160000; Change: 0
Money Market Fund :$391110 ; Change: 0
The value of yield per year is $89155.650 from $94133.333
with a change of $4977.68
3 (b).
If the annual yield for growth fund is decreased to 14% for
Growth then the investment recommendation would be as
follows
Growth fund :$160000; Change: $88888.889
Income Fund :$293335; Change: $133335
Money Market Fund :$346665 ;Change: $44446.11
The value of yield per year is $85066.750.650 from
$94133.333 with a change of $9066.583
4.
 According to the question there will be an additional constraint added
as:
X1<=X2
i.e., X1-X2<=0
With the following constraints added the investment recommendation
is as follows :
Growth fund :$213334; Change: $35554.889
Income Fund :$213334; Change: $53334
Money Market Fund :$373332; Change: $17779.11
The value of yield per year is $93066.770 from $94133.333 with a change
of $1066.563
5.
 Yes the asset allocation model can be used can be used for
any number of clients as long as the values of
Growth Fund is above 15%
Income Fund is below 14.5%
Money market Fund is in between 1.5% to 18%
Bibliography & Reference
 An Introduction to Management Science :
Quantitative Approaches to Decision Making
 The Management Scientist Version 6.0 Software

Operational Research

  • 1.
    Operational Research Brenda Gaytan CASESTUDY 1. Workload Balancing 2. Production Strategy 3. Hart Venture Capital 4. Product Mix 5. Investment Strategy
  • 2.
    DIGITAL IMAGING (DI) PHOTOPRINTERS ( A N I N T R O D U C T I O N T O M A N A G E M E N T S C I E N C E ) P G : 8 4 - 8 5 WORKLOAD BALANCING
  • 3.
    DI Printers  DigitalImaging (DI) produces photo printers for both professional and consumer markets. The company recently introduced two new models of color photo printers namely DI-910 model and DI-950 model. Features DI- 910 DI – 950 Photo Size 4” * 6” Borderless 13” * 19” Borderless Time Taken / Print 37 seconds Faster than DI-910 Profit / Unit $ 42 $ 87
  • 4.
    Manufacturing  The companyhas two manufacturing lines to assemble, test and pack the printers.  LINE 1 - Performs assembly operation  LINE 2 - Performs testing and packaging part Line DI- 910 DI – 950 Time Available / Shift Line – 1 3 mins 6 mins $ 480 Line - 2 4 mins 2 mins $ 480 Profit / Unit $ 42 $ 87
  • 5.
    Objective Functions  DecisionVariables Let, X - Number of units of DI-910 model produced in each shift. Let, Y - Number of units of DI-950 model produced in each shift.  Objective The company’s objective is to maximize its profit from overall production.  Objective Function Z (Max.) = 42(X) + 87(Y)
  • 6.
    Constraints  Subject To: For Line 1 3X + 6Y <= 480 For Line 2 4X + 2Y <= 480 Non-Negativity Constraints X >= 0 Y >= 0
  • 7.
    1 (a). Recommended numberof units of each printer to be produced to maximize the profit : No. of DI-910 model printers to be produced i.e. X = 0 No. of DI-950 model printers to be produced i.e. Y = 80 Z(Max.) = 42 (0) * 87 (80)  6960  Now while producing 80 DI-950 printers : Time used in Assembly Line = 6 X 80 = 480 minutes Time used in Testing & Packaging = 2 X 80 = 160 minutes  Time i.e. not utilised in Testing & Packaging = 480 – 160 = 320 minutes  Line -2 i.e. Testing & Packaging is Idle for 320 minutes/shift
  • 8.
    Area under ABCD isthe feasible region Optimal solution i.e. Z(max) is at A = 6960
  • 9.
    (b). Possible reasons fornot implementing the recommendation : Thus, management may not be manufacturing only DI- 950 model printers as :  Resources on Line 2 will not be utilized fully as there will be an idle time of 320 minutes (more than half of the total time of the shift).  Production/Supply of DI-950 model printers may be in excess of market demand.  Demand of DI-910 model printers will be left unfulfilled.
  • 10.
    Solution from ManagementScientist Software
  • 11.
    2. DI Company wantsto produce as many DI-910 model printers as DI-950 model printers :  Now in this case, a new constraint will further be added to the original problem : X >= Y, or X – Y >= 0 We will achieve our optimal point at : X = 53.33 Y = 53.33 But since production of printers can not be done in this way, the company would produce : X = 54 Y = 53 Z(Max.) = 42 (54) * 87 (53)  6880
  • 12.
    Feasible region isABCD Optimal point at A (x=54,y=53) Max. profit i.e. Zmax = 6880
  • 13.
    Solution from ManagementScientist Software
  • 14.
    3. Analysis of resourceutilization on Line 1 and Line 2 in reference to solution developed in part (2) : Time used in Assembly line = (3 X 54) + (6 X 53) = 480 minutes Time used in Testing & Packaging = (4 X 54) + (2 X 53) = 322 minutes  Time i.e. not utilized in Testing & Packaging = 480 – 322 = 158 minutes Now as there is a lot of time in Line 2 still unused, the main concern for the company would be how to utilize this unused time in a productive manner so that it add value to the company as well as its profits.
  • 15.
    4. Management wants tolimit the time difference between both the lines by 30 minutes or less : In this case, a new constraint will be added to the original problem : (3X + 6Y ) – (4X + 2Y) <= 30, or - X + 4Y <= 30  Through Management Scientist Software, the new calculated values will be : X = 96.667 Y = 31.667 Z(Max.) = 42(96.667) + 87(31.667)  6815  Time consumed in Line 1 = (3 X 96.667) + (6 X 31.667) = 480 minutes  Time consumed in Line-2 = (4 X 96.667) + (2 X 31.667) = 450 minutes Time Difference = 480 – 450  30 minutes
  • 16.
    Solution from ManagementScientist Software
  • 17.
    Feasible region isABCD Optimal solution is at A (x=96.667,y=31.667) Max. profit i.e. Zmax= 6815
  • 18.
     Now againsince the production of printers can not be done in this way, the company would produce : X = 98 Y = 31 Z(Max.) = 42 (98) * 87 (31)  6813  Time consumed in Line 1 = (3 X 98) + (6 X 31) = 480 minutes  Time consumed in Line-2 = (4 X 98) + (2 X 31) = 454 minutes Time Difference = 480 – 454  26 minutes
  • 19.
    5. Objective is tomaximize the number of printers produced : Since the objective of the company has changed from maximizing profits to maximizing production, the objective function would also change : New Objective Function : Z(Max.) = X + Y  Through Management Scientist Software, the new calculated values will be : X = 106.227 Y = 26.667 For convenience in production, the company would produce : X = 106 Y = 27 Z(Max.) = 42 (106) * 87 (26)  6801  Time consumed in line-1 = (3 X 10⁶) + (6 X 27) = 480 minutes  Time consumed in line-2 = (4 X 10⁶) + (2 X 27) = 478 minutes
  • 20.
    Solution from ManagementScientist Software
  • 21.
    BETTER FITNESS INC.(BFI) EXERCISE EQUIPMENT MANUFACTURING ( A N I N T R O D U C T I O N T O M A N A G E M E N T S C I E N C E ) P G : 8 5 - 8 6 PRODUCTION STRATEGY
  • 22.
    Components of Machines Twomachines are to be Manufactured :  Body Plus 100 1. Frame Unit 2. Press Station 3. Pec-Dec Station  Body Plus 200 1. Frame Unit 2. Press Station 3. Pec-Dec Station 4. Leg Press Station
  • 23.
    Activities Involved inManufacturing  There are various activities involved in per unit manufacturing of ‘Body Plus 100’ and ‘Body Plus 200’ :  Machining and Welding  Painting and Finishing  Assembling, Packaging and Testing  Three of these activities take separate time for both the machines
  • 24.
    Body Plus 100 Machine& Welding Time (Hrs) Painting & Finishing Time (Hrs) Assembling, Testing & Packaging (Hrs) Raw Material Cost ($) Packaging Cost ($) Frame Unit 4 2 2 450 50Press Station 2 1 300 Pec-Dec Station 2 2 250 Total 8 5 2 1000 50
  • 25.
    Body Plus 200 Machine& Welding Time (Hrs) Painting & Finishing Time (Hrs) Assembling, Testing & Packaging (Hrs) Raw Material Cost ($) Packaging Cost ($) Frame Unit 5 4 2 650 75 Press Station 3 2 400 Pec-Dec Station 2 2 250 Leg Press Station 2 2 200 Total 12 10 2 1500 75
  • 26.
    Process Time Machine &Welding Time Painting & Finishing Time Assembling, Testing & Packaging Time Labor Cost / Hour $ 20 $ 15 $ 12 Total Time (Hrs) Cost / Hour Machine & Welding Time 600 20 Painting & Finishing Time 450 15 Assembling, Testing and Packaging Time 140 12 For the Next Production Period Management Estimates the Hours and Labor Cost
  • 27.
    Body Plus 100Body Plus 200  Retail Price = $ 2400  Labor Cost = (20*8)+(15*5)+(12*2) = $ 259  Raw Material Cost = $ 1000 + $ 50 = $ 1050  Dealer Price = 0.70*2400 = $1680 (Because Dealer can purchase at 70%)  .  Retail Price = $ 3500  Labor Cost = (20*12)+(15*10)+(12*2) = $ 414  Raw Material Cost = $ 1500 + $ 75 = $ 1575  Dealer Price = 0.70*3500 = $ 2450 (Because Dealer can purchase at 70%)  . Manufacturing Cost
  • 28.
    Body Plus 100Body Plus 200  Total Cost = RM cost + Labor Cost  Total = $ 1050 + $ 259 = $ 1309  Price Sold = $ 1680  Profit = $ 1680 - $ 1309 = $ 371  .  Total Cost = RM cost + Labor Cost  Total = $ 1575 + $ 414 = $ 1989  Price Sold = $ 2450  Profit = $ 2450 - $ 1989 = $ 461  . Profit
  • 29.
    LPP A. Decision Variable X = No. of Units of Body Plus 100 to be produced  Y = No. of Units of Body Plus 200 to be produced B. LPP Equation (Profit Maximization)  Max Z = 371 X + 461 Y C. Constraints 1. Machine & Welding Hours : 1. 8 X + 12 Y <= 600 2. Painting & Finishing Hours : 1. 5 X + 10 Y <= 450 3. Assembly & Packaging Hours : 1. 2 X + 2 Y <= 140 4. Y >= 0.25 (X + Y) 5. Non – Negative Constraints : X >=0 ; Y >= 0
  • 30.
  • 31.
    1.  The OptimalSolution is from one among the Feasible region points  Hence, the recommended number of machines are :  Body Plus 100 = 50  Body Plus 200 = 16 Points Max Z Solution A 0 , 45 Z = 371 X + 461 Y 20,745 B 30 , 30 24,960 C 50 , 16.667 26,233.48 Optimal Solution
  • 32.
    2.  If theconstraint of “producing atleast 25% of Body Plus 200” is removed.  Then the graph shall be plotted for the following constraints: 1. Machine & Welding Hours : 1. 8 X + 12 Y <= 600 2. Painting & Finishing Hours : 1. 5 X + 10 Y <= 450 3. Assembly & Packaging Hours : 1. 2 X + 2 Y <= 140 4. Non – Negative Constraints : X >=0 ; Y >= 0
  • 33.
  • 34.
    New Solution  TheOptimal Solution is from one among the Feasible region points  Hence, the recommended number of machines are :  Body Plus 100 = 60  Body Plus 200 = 10  The Profit Margin Increases by = $ 26,870 - $ 26,233.48 = $ 636.52 Points Max Z Solution A 0 , 45 Z = 371 X + 461 Y 20,745 B 30 , 30 24,960 C 60 , 10 26,870 D 70 , 0 25,970 Optimal Solution
  • 35.
    3.  We cansee that the “Upper Limit” in ‘X’ is not fixed, whereas in ‘Y’ it is 1113 units  When looking at the Objective function Coefficient ranges we see that the objective function yields maximum profits (1113 units) by selling only Body Plus 200.  Also, the reduced costs of manufacturing only Body Plus 200 is 652.  Therefore, the efforts should be expended, in Body Plus 200 to yield maximum profit.
  • 36.
  • 37.
    HART VENTURE CAPITAL(HVC) VENTURE CAPITAL FOR SOFTWARE DEVELOPMENT ( A N I N T R O D U C T I O N T O M A N A G E M E N T S C I E N C E ) P G : 8 6 - 8 7 HART VENTURE CAPITAL
  • 38.
    Objective Function Decision Variables X1= Percentage of fund invested in Security systems.  X2= Percentage of fund invested in Market analysis. Objective Function  To maximize the net present value of the total investment in Security systems and Market analysis.  Max Z= X1/100(1,800,000)+X2/100(1,600,000) Constraints  X1/100(600,000)+X2/100(500,000)<=800,000  X1/100(600,000)+X2/100(300,000)<=700,000  X1/100(250,000)+X2/100(400,000)<=500,000  Non negativity condition X1,X2>=0
  • 39.
    Year Security SystemMarket Analysis Max Availability 1 6 , 00 , 000 5 , 00 , 000 8 , 00 , 000 2 6 , 00 , 000 3 , 50 , 000 7 , 00 , 000 3 2 , 50 , 000 4 , 00 , 000 5 , 00 , 000
  • 40.
    Graph 0 0.2 0.4 0.6 0.8 1 1.2 1.4 1.6 1.8 2 0 0.2 0.40.6 0.8 1 1.2 1.4 1.6 1.8 2 Y=Percentageofinvestmentinmarketanalysis X = Percentage of investment in security system 600000X+500000Y<800000 600000X+350000Y<700000 250000X+400000Y<500000
  • 42.
    1.  HVC shouldinvest 60.87% in Security systems and 86.95% in Market analysis.  Net present value of total investment is $2,486,956.522
  • 43.
    2.  Capital AllocationPlan : Year 1 Year 2 Year 3 Security Systems $ 3, 65, 220 $ 3, 65, 220 $ 1, 52, 175 Market Analysis $ 4, 34, 750 $ 3, 04, 325 $ 3, 47, 800 Slack Funds $ 30 $ 30, 455 $ 25
  • 44.
    3.  Assuming thatthe additional $100000 is made available to HVC to be invested in any year.  HVC should choose to invest these funds in these proportions in the two projects  The following effects will take place : A. % invested funded for Security Systems will become 68% B. % invested funded for Market Analysis will become 82% C. Net Present Value will become $2536000.
  • 45.
    Year 1 Year2 Year 3 Security Systems $ 4, 08, 000 $ 4, 08, 000 $ 1, 70, 000 Market Analysis $ 4, 10, 000 $ 2, 87, 000 $ 3, 28, 000 Slack Funds $ 82, 000 $ 5, 000 $ 2, 000
  • 46.
    4.  Assuming theadditional $100000 is committed for the first year itself, the capital allocation plan is  For Security systems: 1. Year 1 = $413,112 2. Year 2 = $413,112 3. Year 2 = $172,130  For market analysis: 1. Year 1 = $409,835 2. Year 2 = $286,884 3. Year 2 = $327,868
  • 47.
    5.  As wesaw, when an additional $100000 is invested, the net present value goes up by $49140 with a slack of $89000. These slack funds may be reinvested in lucrative options available with HVC.
  • 48.
    TJ’S INC. NUT MIXESFOR SALE TO GROCERY CHAINS ( A N I N T R O D U C T I O N T O M A N A G E M E N T S C I E N C E ) P G : 1 5 1 - 1 5 2 PRODUCT MIX
  • 49.
    Problem  TJ’s Incorporatedmakes three nut mixes for sale to grocery chains located in the southeast. The three mixes, referred to as the Regular Mix, the Deluxe Mix, and the Holiday Mix, are made by mixing different percentages of types of nuts.  In preparation for the fall season, TJ’s has just purchased the following shipments of nuts at the prices shown : Type of Nut Shipment Amount Cost per Shipment Almond 6000 7500 Brazil 7500 7125 Filbert 7500 6750 Pecan 6000 7200 Walnut 7500 7875
  • 50.
    Percentage of NutsRegular Mix Deluxe Mix Holiday Mix Almonds 15 % 20 % 25 % Brazil Nuts 25 % 20 % 15 % Filberts 25 % 20 % 15 % Pecans 10 % 20 % 25 % Walnuts 25 % 20 % 20 % Type of Mix Profit Contribution Per Unit Orders Regular Mix $ 1.65 10, 000 Deluxe Mix $ 2.00 3, 000 Holiday Mix $ 2.25 5, 000
  • 51.
    Managerial Report Perform ananalysis of TJ’s product mix problem, and prepare a report for TJ’s president that summarizes your finding. Be sure to include information and analysis on the following: 1. The cost per pound of the nuts included in the Regular, Deluxe, and Holiday mixes. 2. The optimal product mix and the total profit contribution. 3. Recommendations regarding how the total profit contribution can be increased if additional quantities of nuts can be purchased. 4. A recommendation as to whether TJ’s should purchase an additional 1,000 pounds of almonds for $1,000 from a supplier who overbought. 5. Recommendations on how profit contribution could be increased (if at all) if TJ’s does not satisfy all existing orders.
  • 52.
    L.P.P Formulation Decision variables:  R = pounds of Regular Mix  D = pounds of Deluxe Mix  H = pounds of Holiday Mix Objective function :  Z = 1.65R + 2.00D + 2.25H - 36450
  • 53.
    Constraints  R >10000  D > 3000  H > 5000  .15R + .20D + .25H < 6000  .15R + .20D + .15H < 7500  .15R + .20D + .15H < 7500  .10R + .20D + .25H < 6000  .25R + .20D + .20H < 7500  R, D, H > 0
  • 54.
  • 56.
    Interpretation  The ObjectiveFunction Value : optimal solution - maximum profit - $61375.  Subtract $36450 from the original Objective Function Value  Subtract the total cost per shipment of the different nuts,  Optimal Solution - maximum profits - $24935.  Optimal decision production = 17500 of regular mix,10625 of deluxe mix, and 5000 of holiday mix.  Optimal solution exceeds the customer orders for regular Mix by 7500 pounds  Optimal solution exceeds the customer orders for deluxe Mix by 7625 pounds  Holiday mix binding constraint(zero surplus)  The negative dual price indicates that increasing the customer orders for Holiday mix from 5000 to 5001 pounds will actually decrease the profit contribution by $0.18.
  • 57.
    Recommendations  Increase thequantity of almonds and walnuts purchased by Tj’s and increase their profit contribution at rate of $8.5 per pound of almonds and $1.5 per pound of walnuts.  No more buying of brazil nuts, filberts and pecans.  Almonds - For each additional pound purchased the profit would increase @ $8.5 for 583 pounds.  Walnuts - For each additional pound purchased the profit would increase @ $1.5 for 250 pounds.  Dual price of -.175 for the pounds of holiday mix indicate the desire to reduce the production of this mix.  The range of feasibility indicates the need to reduce the customer orders to zero and the value of reduction @ $.18 per pound.
  • 58.
    J.D. WILLIAMS INC. INVESTMENTADVISORY FIRM ( A N I N T R O D U C T I O N T O M A N A G E M E N T S C I E N C E ) P G : 1 5 2 - 1 5 3 INVESTMENT STRATEGY
  • 59.
    Objective Function The Casetalks about an Investment Advisory firm having more than $120 million of funds with numerous clients. The problem at hand is about an $800,000 new investment which is to be invested in three portfolios Therefore Decision Variables: X1=Investment in growth fund X2=Investment in income fund X3=Investment in money market fund Objective Function: Maximize Z= 0.18X1+0.125X2+0.075X3
  • 60.
    Constraints Subject to: 1) -0.8X1+0.2 X2+0.2 X3<0 2) -0.6 X1+0.4 X2+0.4 X3>0 3) 0.2 X1-0.8 X2+0.2 X3<0 4) 0.5 X1-0.5 X2+0.5 X3>0 5) 0.3 X1+0.3 X2-0.7 X3<0 6) 1 X1+1 X2+1 X3=800000 7) 0.05 X1+0.02 X2-0.04 X3<0
  • 61.
    Solution LINEAR PROGRAMMING PROBLEM MaxZ = 0.18 X1+0.125 X2+0.075 X3 OPTIMAL SOLUTION Objective Function Value = 94133.333 Variable Value Reduced Costs -------------- --------------- ------------------ X1 248888.889 0.000 X2 160000.000 0.000 X3 391111.111 0.000
  • 62.
    Constraint Slack/Surplus DualPrices -------------- --------------- ------------------ 1 88888.889 0.000 2 71111.111 0.000 3 0.000 0.020 4 240000.000 0.000 5 151111.111 0.000 6 0.000 0.118 7 0.000 1.167
  • 63.
    OBJECTIVE COEFFICIENT RANGES VariableLower Limit Current Value Upper Limit ------------ --------------- --------------- --------------- X1 0.150 0.180 No Upper Limit X2 No Lower Limit 0.125 0.145 X3 0.015 0.075 0.180 RIGHT HAND SIDE RANGES Constraint Lower Limit Current Value Upper Limit ------------ --------------- --------------- --------------- 1 -88888.889 0.000 No Upper Limit 2 No Lower Limit 0.000 71111.111 3 -133333.333 0.000 106666.667 4 No Lower Limit 0.000 240000.000 5 -151111.111 0.000 No Upper Limit 6 0.000 800000.000 No Upper Limit 7 -8000.000 0.000 6400.000
  • 64.
    1. From the abovesolution out of 800,000 the investment should be as follows: Growth Fund: $248888.889 Income Fund: $160000.000 Money Market Fund: $391111.111 The annual growth anticipated from the investment recommendation is $94133.333
  • 65.
    2.  If theclients risk index increased from 0.05 to 0.055  The new yield index would increase by $4666.67 to $98800
  • 66.
    3 (a). If theannual yield for growth fund is decreased to 16% for Growth then the investment recommendation would be as follows Growth fund :$248890; Change: 1.111 Income Fund :$160000; Change: 0 Money Market Fund :$391110 ; Change: 0 The value of yield per year is $89155.650 from $94133.333 with a change of $4977.68
  • 67.
    3 (b). If theannual yield for growth fund is decreased to 14% for Growth then the investment recommendation would be as follows Growth fund :$160000; Change: $88888.889 Income Fund :$293335; Change: $133335 Money Market Fund :$346665 ;Change: $44446.11 The value of yield per year is $85066.750.650 from $94133.333 with a change of $9066.583
  • 68.
    4.  According tothe question there will be an additional constraint added as: X1<=X2 i.e., X1-X2<=0 With the following constraints added the investment recommendation is as follows : Growth fund :$213334; Change: $35554.889 Income Fund :$213334; Change: $53334 Money Market Fund :$373332; Change: $17779.11 The value of yield per year is $93066.770 from $94133.333 with a change of $1066.563
  • 69.
    5.  Yes theasset allocation model can be used can be used for any number of clients as long as the values of Growth Fund is above 15% Income Fund is below 14.5% Money market Fund is in between 1.5% to 18%
  • 70.
    Bibliography & Reference An Introduction to Management Science : Quantitative Approaches to Decision Making  The Management Scientist Version 6.0 Software