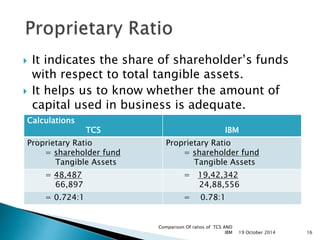
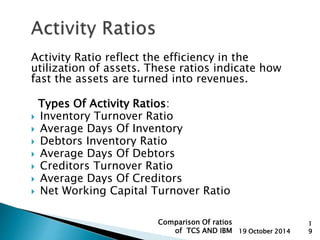
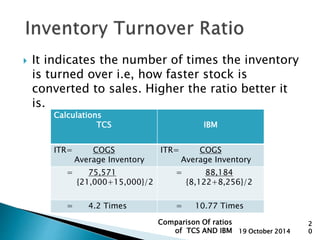
Presented By: 
Ujaas Madhan 
Dharmender Goyal 
Kunal Raj 
Ashish Anurag 
Prakash Kumar 
19 October 2014 1 
Comparison Of ratios 
of TCS AND IBM
Important ratio analysis of TCS and IBM 
Following Ratios are compared: 
 Profitability Ratio. 
 Liquidity Ratio. 
 Leverage Ratio. 
 Activity Ratio. 
 Market/Shareholder’s Ratio. 
19 October 2014 2 
Comparison Of ratios 
of TCS AND IBM
 It is assumed that $1=Rs 62. 
 Figures of IBM are in Rs Million. 
 Figures of TCS are in Rs Crores. 
 Only important ratios are compared in each 
type of ratios. 
19 October 2014 
Comparison Of ratios 
of TCS AND IBM 3
In Profitability Ratios, the profit is compared 
to sales, that is, profit is expressed as a 
percentage of sales. 
Types of Profitability Ratios: 
 Gross Profit Ratio. 
 Net Profit Ratio. 
 Return on Investment. 
 Operating Profit Ratio. 
 Return on Shareholder Funds. 
 Return on Equity. 
19 October 2014 4 
Comparison Of ratios 
of TCS AND IBM
 Gross Profit measures the percentage of 
gross profit to sales. 
 Higher the Gross Profit ratio better it is. 
CALCULATIONS 
TATA CONSULTANCY 
SERVICES(TCS) 
International Business Machine 
(IBM) 
GP= Gross Profit *100 
Sales 
GP= Gross Profit *100 
Sales 
= 6,238 *100 
81,809 
= 7.62% 
= 1,79,056 *100 
2,67,240 
= 67.10% 
19 October 2014 5 
Comparison Of ratios 
of TCS AND IBM
Operating Profit ratios measures the 
percentage of operating profit (EBIT) in 
comparison to sales. 
19 October 2014 6 
Calculations 
TCS IBM 
Operating Profit Ratios 
= Operating Profit *100 
Sales 
Operating Profit Ratios 
= Operating Profit *100 
Sales 
= 19,331 *100 
81,809 
= 23.63% 
= 1,34,602 *100 
2,67,240 
= 50.36% 
Comparison Of ratios 
of TCS AND IBM
 Net profit ratio measures the percentage of 
net profit in comparison to sales. 
NP=GP-Indirect Expenses +Indirect 
Incomes 
Calculations 
TCS IBM 
Net Profit= Net Profit *100 
Sales 
Net Profit= Net Profit *100 
Sales 
= 19,163*100 
81,809 
= 90,272 *100 
2,67,240 
= 23.42% = 33.72% 
19 October 2014 7 
Comparison Of ratios 
of TCS AND IBM
 Total Investment in a business represents the 
fixed assets plus working capital. 
 ROI measures the effectiveness of investment 
in the business. 
Calculations 
TCS IBM 
ROI= Net Profit+Interest*{1-Tax}*100 
Total Investment 
= Net Profit+Interest*{1-Tax}*100 
Total Investment 
= 19,163 * 100 
24,240+67,137-15,670 
= 25.31% 
= 1,34,602 *100 
21,31,060 
= 6.31% 
19 October 2014 8 
Comparison Of ratios 
of TCS AND IBM
 It indicate the earnings with respect to the 
owner’s equity. 
 Owner’s equity represents equity capital and 
reserves. 
Calculations 
TCS IBM 
ROE= Net Profit * 100 
Equity Share Capital 
ROE= Net Profit * 100 
Equity Share Capital 
= 19,163 * 100 
48,487 
= 7,78,879 *100 
19,42,342 
= 39.52% = 40.10% 
19 October 2014 9 
Comparison Of ratios 
of TCS AND IBM
This ratio compares the net profit with the 
shareholders funds and is calculated as 
follows: 
Calculations 
TCS IBM 
Return on sh.holder fund Return on sh.holder fund 
= Net Profit * 100 
Shareholder’s Funds 
= 19,163 * 100 
49,194 
= 38.95% 
= Net Profit * 100 
Shareholder’s Funds 
= 90,272 *100 
19,42,342 
= 4.64% 
19 October 2014 
1 
0 
Comparison Of ratios 
of TCS AND IBM
 Liquidity ratio measures the company’s ability 
to generate cash resources to meet its 
current obligations. 
Types of Liquidity Ratios : 
 Current Ratio 
 Quick/Acid-Test Ratio 
19 October 2014 
1 
1 
Comparison Of ratios 
of TCS AND IBM
 Current ratio measures the current assets in 
comparison to current liabilities. 
 The ideal ratio for current ratio is 2:1. 
Calculations 
TCS IBM 
Current Ratio= Current Assets 
Current Liabilities 
Current Ratio= Current Assets 
Current Liabilities 
= 42,897 
15,670 
=1,11,476 
1,88,666 
= 2.74:1 = 0.59:1 
19 October 2014 
1 
2 
Comparison Of ratios 
of TCS AND IBM
 It is computed by taking quick assets that are 
readily convertible into cash. 
Calculations 
TCS IBM 
QR= Current Assets-Inventory 
Current Liabilities 
QR= Current Assets-Inventory 
Current Liabilities 
= 42,882 
15,670 
= 77,353 
1,88,666 
= 2.73:1 = 0.41:1 
19 October 2014 
1 
3 
Comparison Of ratios 
of TCS AND IBM
Leverage ratio measures the extent of risk that 
the company takes by introducing debt into 
finance. 
Types Of Leverage Ratio: 
 Debt-Equity Ratio 
 Proprietary Ratio 
 Interest Coverage Ratio 
 Total Debt To Total Assets 
19 October 2014 
1 
4 
Comparison Of ratios 
of TCS AND IBM
 It indicates the proportion of debt in relation 
to equity. 
 A heavy debt in capital is considered risky. 
Calculations 
TCS IBM 
Debt equity ratio 
= Debt 
equity 
Debt equity ratio 
= Debt 
equity 
= 127 
48,487 
= 17,05,248 
19,42,342 
=0.0026:1 = 0.877:1 
19 October 2014 
1 
5 
Comparison Of ratios 
of TCS AND IBM
 It indicates the share of shareholder’s funds 
with respect to total tangible assets. 
 It helps us to know whether the amount of 
capital used in business is adequate. 
Calculations 
TCS IBM 
Proprietary Ratio 
= shareholder fund 
Tangible Assets 
Proprietary Ratio 
= shareholder fund 
Tangible Assets 
= 48,487 
66,897 
= 19,42,342 
24,88,556 
= 0.724:1 = 0.78:1 
19 October 2014 16 
Comparison Of ratios of TCS AND 
IBM
 It is used to ensure that a company’s 
earnings are sufficient to meet its interest 
liabilities. 
 If ratio is greater than 1, the interest payment 
can be covered. 
Calculations 
TCS IBM 
ICR= EBIT 
Interest 
ICR= EBIT 
Interest 
= 19,331 
1680 
= 1,34,602 
23,746 
= 11.506 Times = 5.668 Times 
19 October 2014 17 
Comparison Of ratios of TCS AND 
IBM
 It indicates that the company has sufficient 
assets to meet its debt obligations. 
Calculations 
TCS IBM 
TDTAR= Total Debt 
Total Assets 
TDTAR= Total Debt 
Total Assets 
= 254 
67,137 
= 17,05,248 
24,88,556 
= 0.00378:1 = 0.68:1 
19 October 2014 
1 
8 
Comparison Of ratios 
of TCS AND IBM
Activity Ratio reflect the efficiency in the 
utilization of assets. These ratios indicate how 
fast the assets are turned into revenues. 
Types Of Activity Ratios: 
 Inventory Turnover Ratio 
 Average Days Of Inventory 
 Debtors Inventory Ratio 
 Average Days Of Debtors 
 Creditors Turnover Ratio 
 Average Days Of Creditors 
 Net Working Capital Turnover Ratio 
19 October 2014 
1 
9 
Comparison Of ratios 
of TCS AND IBM
 It indicates the number of times the inventory 
is turned over i.e, how faster stock is 
converted to sales. Higher the ratio better it 
is. 
Calculations 
TCS IBM 
ITR= COGS 
Average Inventory 
ITR= COGS 
Average Inventory 
= 75,571 
{21,000+15,000}/2 
= 88,184 
{8,122+8,256}/2 
= 4.2 Times = 10.77 Times 
19 October 2014 
2 
0 
Comparison Of ratios 
of TCS AND IBM
 The Velocity of Inventories is expressed as 
number of days of inventories carried by the 
company as at the balance sheet date. 
Calculations 
TCS IBM 
ADOI= 365 
Inventory Turnover 
ADOI= 365 
Inventory Turnover 
= 365 
4.2 
= 365 
10.77 
= 87 Days = 34 Days 
19 October 2014 21 
Comparison Of ratios of TCS AND 
IBM
 It indicates the number of times debtors are 
turned over in a year. 
 If the turnover is high, it means that the 
company’s credit collection is efficient. 
Calculations 
TCS IBM 
DTR= Credit Sales 
Average Debtor 
DTR= Credit Sales 
Average Debtor 
= 81,809 
{14,095+18,230}/2 
= 2,67,240 
{14,880+15,020}/2 
= 5.061 Times = 17.87 Times 
19 October 2014 
2 
2 
Comparison Of ratios 
of TCS AND IBM
 The Velocity of debtors is expressed by the 
number of days of credit sales. 
Calculations 
TCS IBM 
ADOD= 365 
Debtors Turnover 
ADOD= 365 
Debtors Turnover 
= 365 
5.061 
= 365 
17.87 
= 72 Days = 21 Days 
19 October 2014 
2 
3 
Comparison Of ratios 
of TCS AND IBM
 It represents the number of days of creditors 
to credit purchases. Reasonable CTR indicates 
credit terms are negotiated. 
Calculations 
TCS IBM 
CTR= Credit Purchases 
Average Creditors 
CTR= Credit Purchases 
Average Creditors 
= 29,570 
{4269+5536}/2 
= 86428 
{4996+6058}/2 
= 6.03 Times = 15.63 Times 
19 October 2014 
2 
4 
Comparison Of ratios 
of TCS AND IBM
 The Velocity of Creditors can be expressed as 
number of days of credit purchases. 
Calculations 
TCS IBM 
ADOC= 365 
Creditors Turnover 
ADOC= 365 
Creditors Turnover 
= 365 
6.03 
= 365 
15.63 
= 61 Days = 23 Days 
19 October 2014 
2 
5 
Comparison Of ratios 
of TCS AND IBM
 It measure the effectiveness of the 
management of working capital. 
Calculations 
TCS IBM 
NWCTR= Sales 
Net Working Capital 
NWCTR= Sales 
Net Working Capital 
= 81,809 
{42,897-15,670} 
= 2,67,240 
{148378-101794} 
= 3.01 Times = 5.74 Times 
19 October 2014 
2 
6 
Comparison Of ratios 
of TCS AND IBM
 These Ratios are useful to the company to 
evaluate the company’s performance. 
Types of Market Ratio: 
 Earning Per Share (EPS) 
 Price Earnings Ratio 
 Dividend Per Share(DPS) 
19 October 2014 
2 
7 
Comparison Of ratios 
of TCS AND IBM
 The ratio reflects the earnings of the 
company for a specific period, per equity 
share. 
Calculations 
TCS IBM 
EPS= Net Income of equity shareholders 
Number of equity shares outstanding 
EPS= Net Income of equity shareholders 
Number of equity shares outstanding 
EPS = 19,163 
197.566 
EPS= 3265 = 2.61 
8521 
= Rs 97.67 Per Share =2.61* 62($ to rupees) 
= Rs 161.82 Per Share 
19 October 2014 
2 
8 
Comparison Of ratios 
of TCS AND IBM
 It is the relationship between the market price 
and EPS. 
 Increase in Market price and EPS will increase 
PE ratio. 
Calculations 
TCS IBM 
PER= Market Price Per Share 
EPS 
PER= Market Price Per Share 
EPS 
= 2100 
97 
= 6448 
164.30 
= 21.64 Times = 39.24 Times 
19 October 2014 
2 
9 
Comparison Of ratios 
of TCS AND IBM
It measures the amount of dividend declared 
per equity shareholder. It is calculated as 
follows: 
Calculations 
TCS IBM 
DPR= Equity dividends paid 
Earning for equity shareholders 
DPR= Equity dividends paid 
Earning for equity shareholders 
= 5162 
197.566 
= 268212 
8652 
= Rs 26.11 Per Share = Rs 31 Per Share 
19 October 2014 
3 
0 
Comparison Of ratios 
of TCS AND IBM
19 October 2014 
Comparison Of ratios 
of TCS AND IBM 
3 
1

Accounts ratio analysis.....!!

  • 1.
    Presented By: UjaasMadhan Dharmender Goyal Kunal Raj Ashish Anurag Prakash Kumar 19 October 2014 1 Comparison Of ratios of TCS AND IBM
  • 2.
    Important ratio analysisof TCS and IBM Following Ratios are compared:  Profitability Ratio.  Liquidity Ratio.  Leverage Ratio.  Activity Ratio.  Market/Shareholder’s Ratio. 19 October 2014 2 Comparison Of ratios of TCS AND IBM
  • 3.
     It isassumed that $1=Rs 62.  Figures of IBM are in Rs Million.  Figures of TCS are in Rs Crores.  Only important ratios are compared in each type of ratios. 19 October 2014 Comparison Of ratios of TCS AND IBM 3
  • 4.
    In Profitability Ratios,the profit is compared to sales, that is, profit is expressed as a percentage of sales. Types of Profitability Ratios:  Gross Profit Ratio.  Net Profit Ratio.  Return on Investment.  Operating Profit Ratio.  Return on Shareholder Funds.  Return on Equity. 19 October 2014 4 Comparison Of ratios of TCS AND IBM
  • 5.
     Gross Profitmeasures the percentage of gross profit to sales.  Higher the Gross Profit ratio better it is. CALCULATIONS TATA CONSULTANCY SERVICES(TCS) International Business Machine (IBM) GP= Gross Profit *100 Sales GP= Gross Profit *100 Sales = 6,238 *100 81,809 = 7.62% = 1,79,056 *100 2,67,240 = 67.10% 19 October 2014 5 Comparison Of ratios of TCS AND IBM
  • 6.
    Operating Profit ratiosmeasures the percentage of operating profit (EBIT) in comparison to sales. 19 October 2014 6 Calculations TCS IBM Operating Profit Ratios = Operating Profit *100 Sales Operating Profit Ratios = Operating Profit *100 Sales = 19,331 *100 81,809 = 23.63% = 1,34,602 *100 2,67,240 = 50.36% Comparison Of ratios of TCS AND IBM
  • 7.
     Net profitratio measures the percentage of net profit in comparison to sales. NP=GP-Indirect Expenses +Indirect Incomes Calculations TCS IBM Net Profit= Net Profit *100 Sales Net Profit= Net Profit *100 Sales = 19,163*100 81,809 = 90,272 *100 2,67,240 = 23.42% = 33.72% 19 October 2014 7 Comparison Of ratios of TCS AND IBM
  • 8.
     Total Investmentin a business represents the fixed assets plus working capital.  ROI measures the effectiveness of investment in the business. Calculations TCS IBM ROI= Net Profit+Interest*{1-Tax}*100 Total Investment = Net Profit+Interest*{1-Tax}*100 Total Investment = 19,163 * 100 24,240+67,137-15,670 = 25.31% = 1,34,602 *100 21,31,060 = 6.31% 19 October 2014 8 Comparison Of ratios of TCS AND IBM
  • 9.
     It indicatethe earnings with respect to the owner’s equity.  Owner’s equity represents equity capital and reserves. Calculations TCS IBM ROE= Net Profit * 100 Equity Share Capital ROE= Net Profit * 100 Equity Share Capital = 19,163 * 100 48,487 = 7,78,879 *100 19,42,342 = 39.52% = 40.10% 19 October 2014 9 Comparison Of ratios of TCS AND IBM
  • 10.
    This ratio comparesthe net profit with the shareholders funds and is calculated as follows: Calculations TCS IBM Return on sh.holder fund Return on sh.holder fund = Net Profit * 100 Shareholder’s Funds = 19,163 * 100 49,194 = 38.95% = Net Profit * 100 Shareholder’s Funds = 90,272 *100 19,42,342 = 4.64% 19 October 2014 1 0 Comparison Of ratios of TCS AND IBM
  • 11.
     Liquidity ratiomeasures the company’s ability to generate cash resources to meet its current obligations. Types of Liquidity Ratios :  Current Ratio  Quick/Acid-Test Ratio 19 October 2014 1 1 Comparison Of ratios of TCS AND IBM
  • 12.
     Current ratiomeasures the current assets in comparison to current liabilities.  The ideal ratio for current ratio is 2:1. Calculations TCS IBM Current Ratio= Current Assets Current Liabilities Current Ratio= Current Assets Current Liabilities = 42,897 15,670 =1,11,476 1,88,666 = 2.74:1 = 0.59:1 19 October 2014 1 2 Comparison Of ratios of TCS AND IBM
  • 13.
     It iscomputed by taking quick assets that are readily convertible into cash. Calculations TCS IBM QR= Current Assets-Inventory Current Liabilities QR= Current Assets-Inventory Current Liabilities = 42,882 15,670 = 77,353 1,88,666 = 2.73:1 = 0.41:1 19 October 2014 1 3 Comparison Of ratios of TCS AND IBM
  • 14.
    Leverage ratio measuresthe extent of risk that the company takes by introducing debt into finance. Types Of Leverage Ratio:  Debt-Equity Ratio  Proprietary Ratio  Interest Coverage Ratio  Total Debt To Total Assets 19 October 2014 1 4 Comparison Of ratios of TCS AND IBM
  • 15.
     It indicatesthe proportion of debt in relation to equity.  A heavy debt in capital is considered risky. Calculations TCS IBM Debt equity ratio = Debt equity Debt equity ratio = Debt equity = 127 48,487 = 17,05,248 19,42,342 =0.0026:1 = 0.877:1 19 October 2014 1 5 Comparison Of ratios of TCS AND IBM
  • 16.
     It indicatesthe share of shareholder’s funds with respect to total tangible assets.  It helps us to know whether the amount of capital used in business is adequate. Calculations TCS IBM Proprietary Ratio = shareholder fund Tangible Assets Proprietary Ratio = shareholder fund Tangible Assets = 48,487 66,897 = 19,42,342 24,88,556 = 0.724:1 = 0.78:1 19 October 2014 16 Comparison Of ratios of TCS AND IBM
  • 17.
     It isused to ensure that a company’s earnings are sufficient to meet its interest liabilities.  If ratio is greater than 1, the interest payment can be covered. Calculations TCS IBM ICR= EBIT Interest ICR= EBIT Interest = 19,331 1680 = 1,34,602 23,746 = 11.506 Times = 5.668 Times 19 October 2014 17 Comparison Of ratios of TCS AND IBM
  • 18.
     It indicatesthat the company has sufficient assets to meet its debt obligations. Calculations TCS IBM TDTAR= Total Debt Total Assets TDTAR= Total Debt Total Assets = 254 67,137 = 17,05,248 24,88,556 = 0.00378:1 = 0.68:1 19 October 2014 1 8 Comparison Of ratios of TCS AND IBM
  • 19.
    Activity Ratio reflectthe efficiency in the utilization of assets. These ratios indicate how fast the assets are turned into revenues. Types Of Activity Ratios:  Inventory Turnover Ratio  Average Days Of Inventory  Debtors Inventory Ratio  Average Days Of Debtors  Creditors Turnover Ratio  Average Days Of Creditors  Net Working Capital Turnover Ratio 19 October 2014 1 9 Comparison Of ratios of TCS AND IBM
  • 20.
     It indicatesthe number of times the inventory is turned over i.e, how faster stock is converted to sales. Higher the ratio better it is. Calculations TCS IBM ITR= COGS Average Inventory ITR= COGS Average Inventory = 75,571 {21,000+15,000}/2 = 88,184 {8,122+8,256}/2 = 4.2 Times = 10.77 Times 19 October 2014 2 0 Comparison Of ratios of TCS AND IBM
  • 21.
     The Velocityof Inventories is expressed as number of days of inventories carried by the company as at the balance sheet date. Calculations TCS IBM ADOI= 365 Inventory Turnover ADOI= 365 Inventory Turnover = 365 4.2 = 365 10.77 = 87 Days = 34 Days 19 October 2014 21 Comparison Of ratios of TCS AND IBM
  • 22.
     It indicatesthe number of times debtors are turned over in a year.  If the turnover is high, it means that the company’s credit collection is efficient. Calculations TCS IBM DTR= Credit Sales Average Debtor DTR= Credit Sales Average Debtor = 81,809 {14,095+18,230}/2 = 2,67,240 {14,880+15,020}/2 = 5.061 Times = 17.87 Times 19 October 2014 2 2 Comparison Of ratios of TCS AND IBM
  • 23.
     The Velocityof debtors is expressed by the number of days of credit sales. Calculations TCS IBM ADOD= 365 Debtors Turnover ADOD= 365 Debtors Turnover = 365 5.061 = 365 17.87 = 72 Days = 21 Days 19 October 2014 2 3 Comparison Of ratios of TCS AND IBM
  • 24.
     It representsthe number of days of creditors to credit purchases. Reasonable CTR indicates credit terms are negotiated. Calculations TCS IBM CTR= Credit Purchases Average Creditors CTR= Credit Purchases Average Creditors = 29,570 {4269+5536}/2 = 86428 {4996+6058}/2 = 6.03 Times = 15.63 Times 19 October 2014 2 4 Comparison Of ratios of TCS AND IBM
  • 25.
     The Velocityof Creditors can be expressed as number of days of credit purchases. Calculations TCS IBM ADOC= 365 Creditors Turnover ADOC= 365 Creditors Turnover = 365 6.03 = 365 15.63 = 61 Days = 23 Days 19 October 2014 2 5 Comparison Of ratios of TCS AND IBM
  • 26.
     It measurethe effectiveness of the management of working capital. Calculations TCS IBM NWCTR= Sales Net Working Capital NWCTR= Sales Net Working Capital = 81,809 {42,897-15,670} = 2,67,240 {148378-101794} = 3.01 Times = 5.74 Times 19 October 2014 2 6 Comparison Of ratios of TCS AND IBM
  • 27.
     These Ratiosare useful to the company to evaluate the company’s performance. Types of Market Ratio:  Earning Per Share (EPS)  Price Earnings Ratio  Dividend Per Share(DPS) 19 October 2014 2 7 Comparison Of ratios of TCS AND IBM
  • 28.
     The ratioreflects the earnings of the company for a specific period, per equity share. Calculations TCS IBM EPS= Net Income of equity shareholders Number of equity shares outstanding EPS= Net Income of equity shareholders Number of equity shares outstanding EPS = 19,163 197.566 EPS= 3265 = 2.61 8521 = Rs 97.67 Per Share =2.61* 62($ to rupees) = Rs 161.82 Per Share 19 October 2014 2 8 Comparison Of ratios of TCS AND IBM
  • 29.
     It isthe relationship between the market price and EPS.  Increase in Market price and EPS will increase PE ratio. Calculations TCS IBM PER= Market Price Per Share EPS PER= Market Price Per Share EPS = 2100 97 = 6448 164.30 = 21.64 Times = 39.24 Times 19 October 2014 2 9 Comparison Of ratios of TCS AND IBM
  • 30.
    It measures theamount of dividend declared per equity shareholder. It is calculated as follows: Calculations TCS IBM DPR= Equity dividends paid Earning for equity shareholders DPR= Equity dividends paid Earning for equity shareholders = 5162 197.566 = 268212 8652 = Rs 26.11 Per Share = Rs 31 Per Share 19 October 2014 3 0 Comparison Of ratios of TCS AND IBM
  • 31.
    19 October 2014 Comparison Of ratios of TCS AND IBM 3 1