Downloaded 836 times
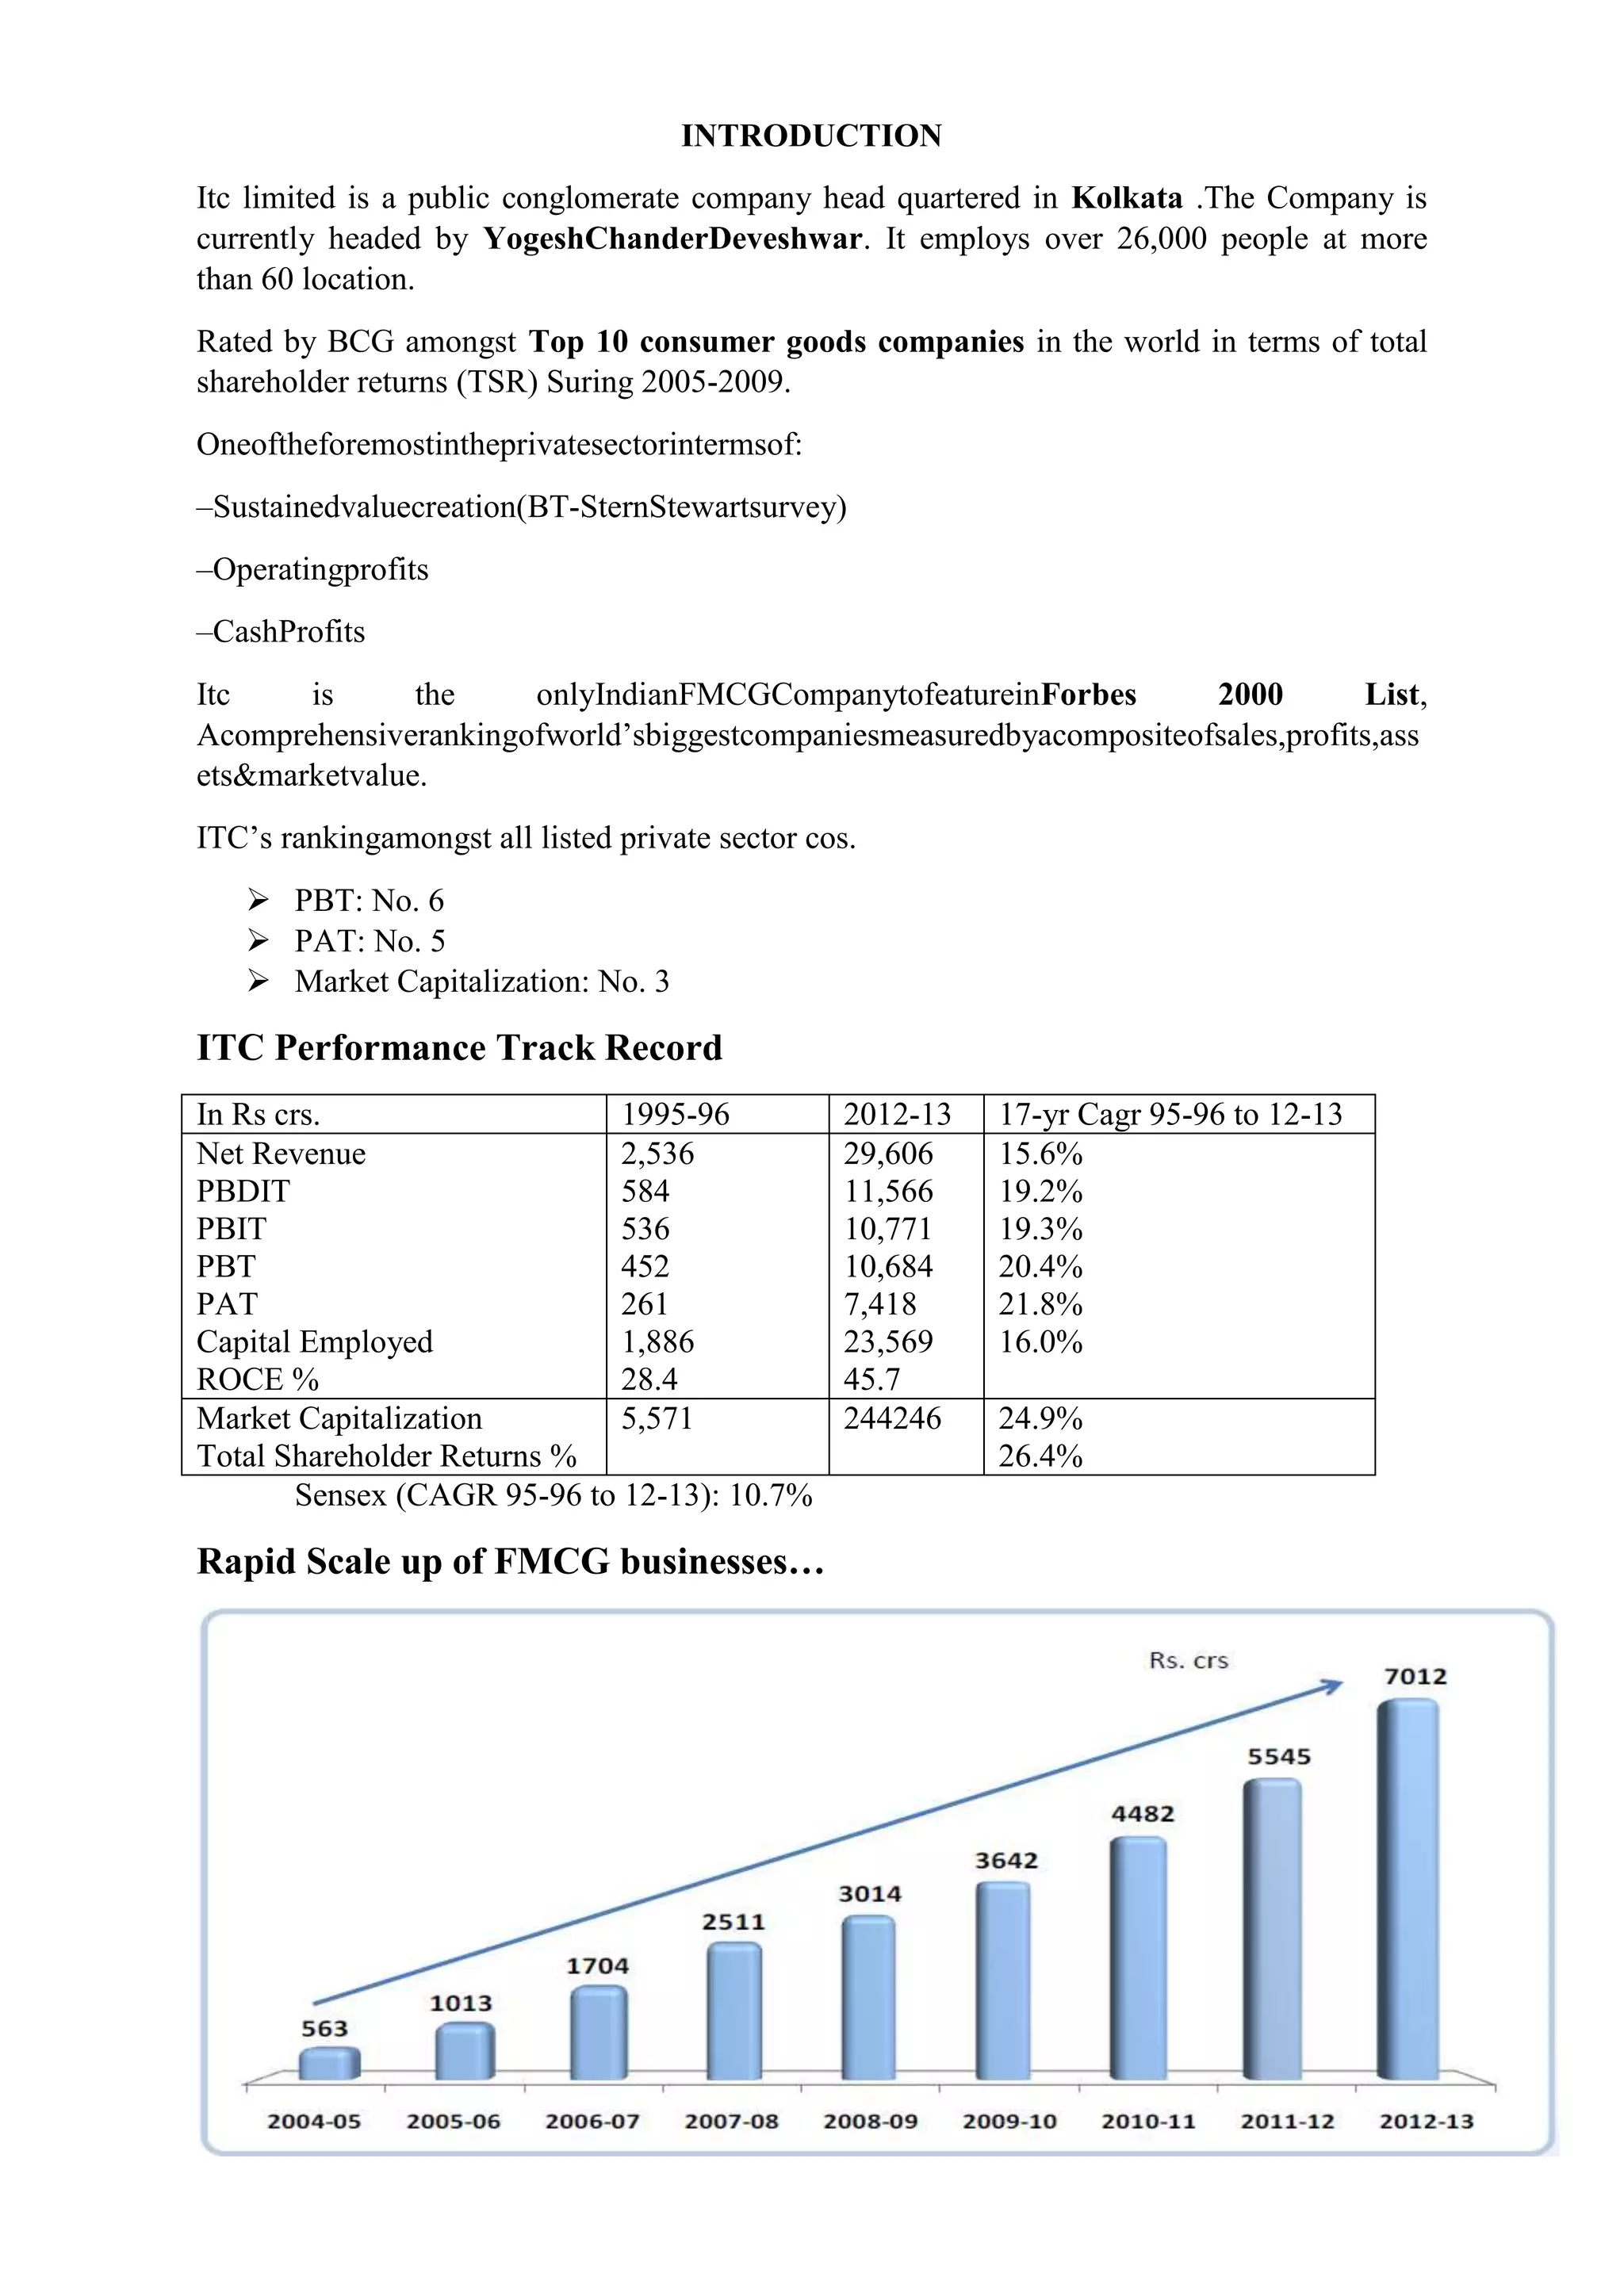
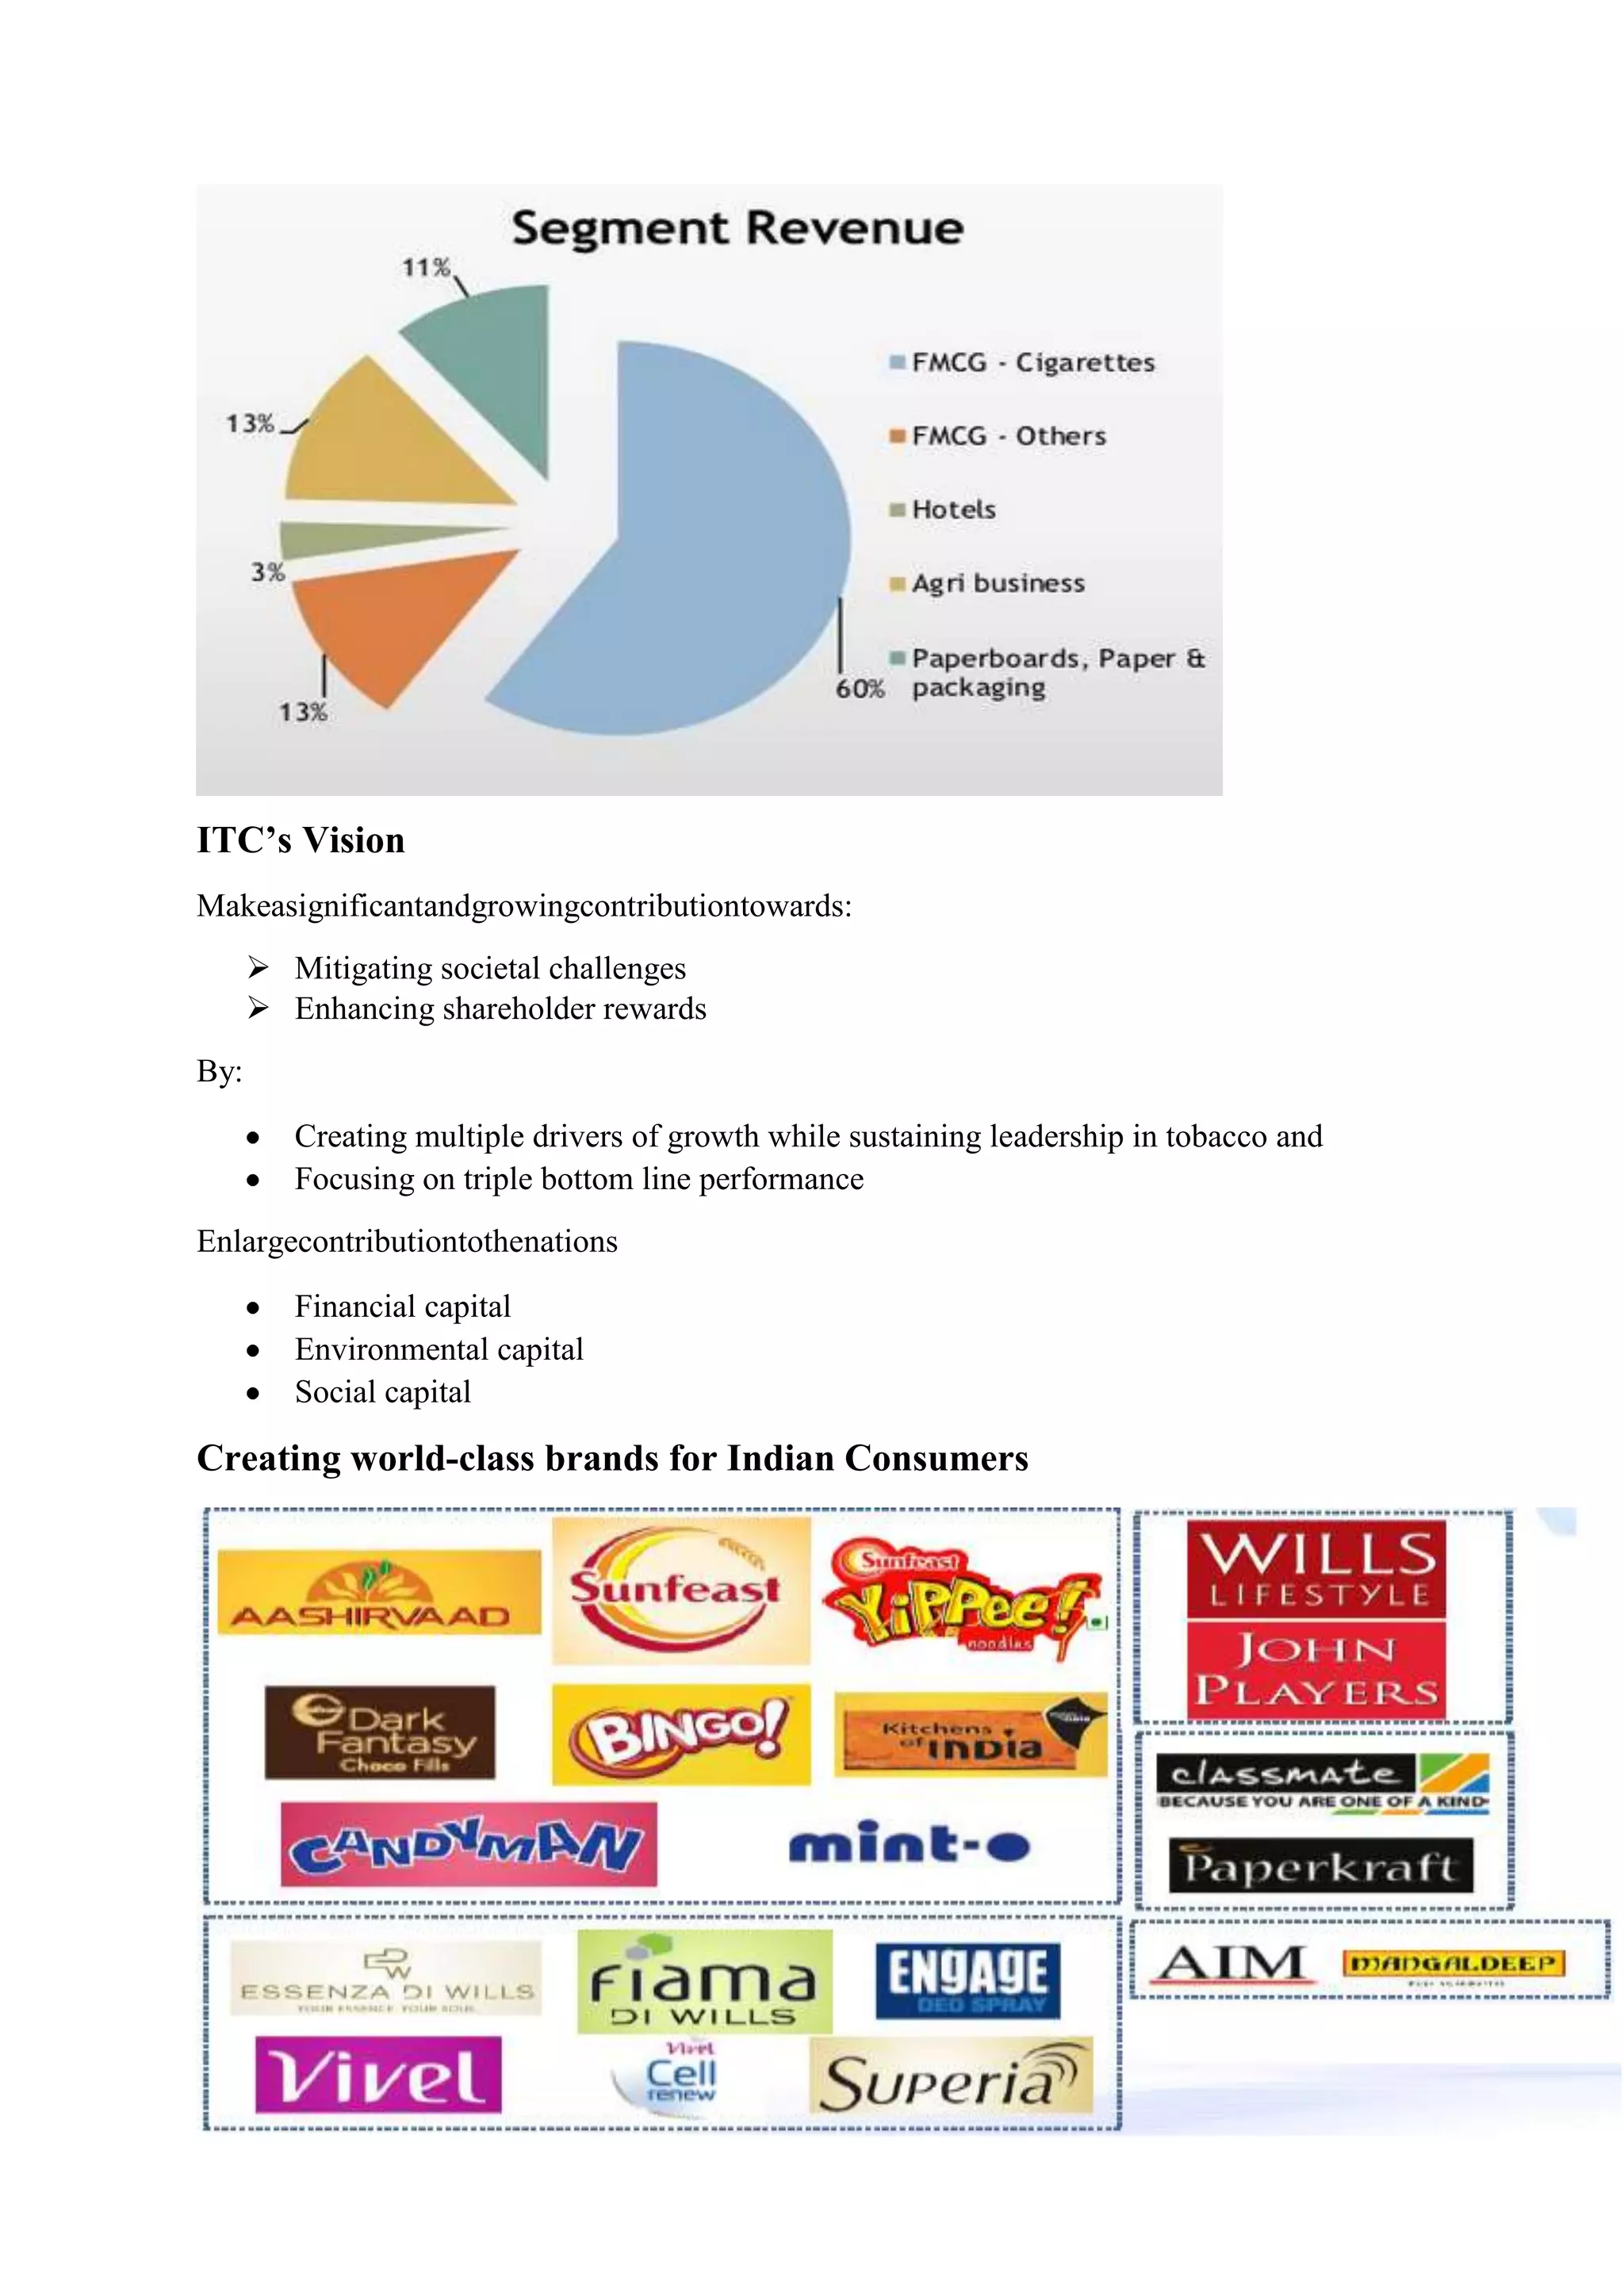
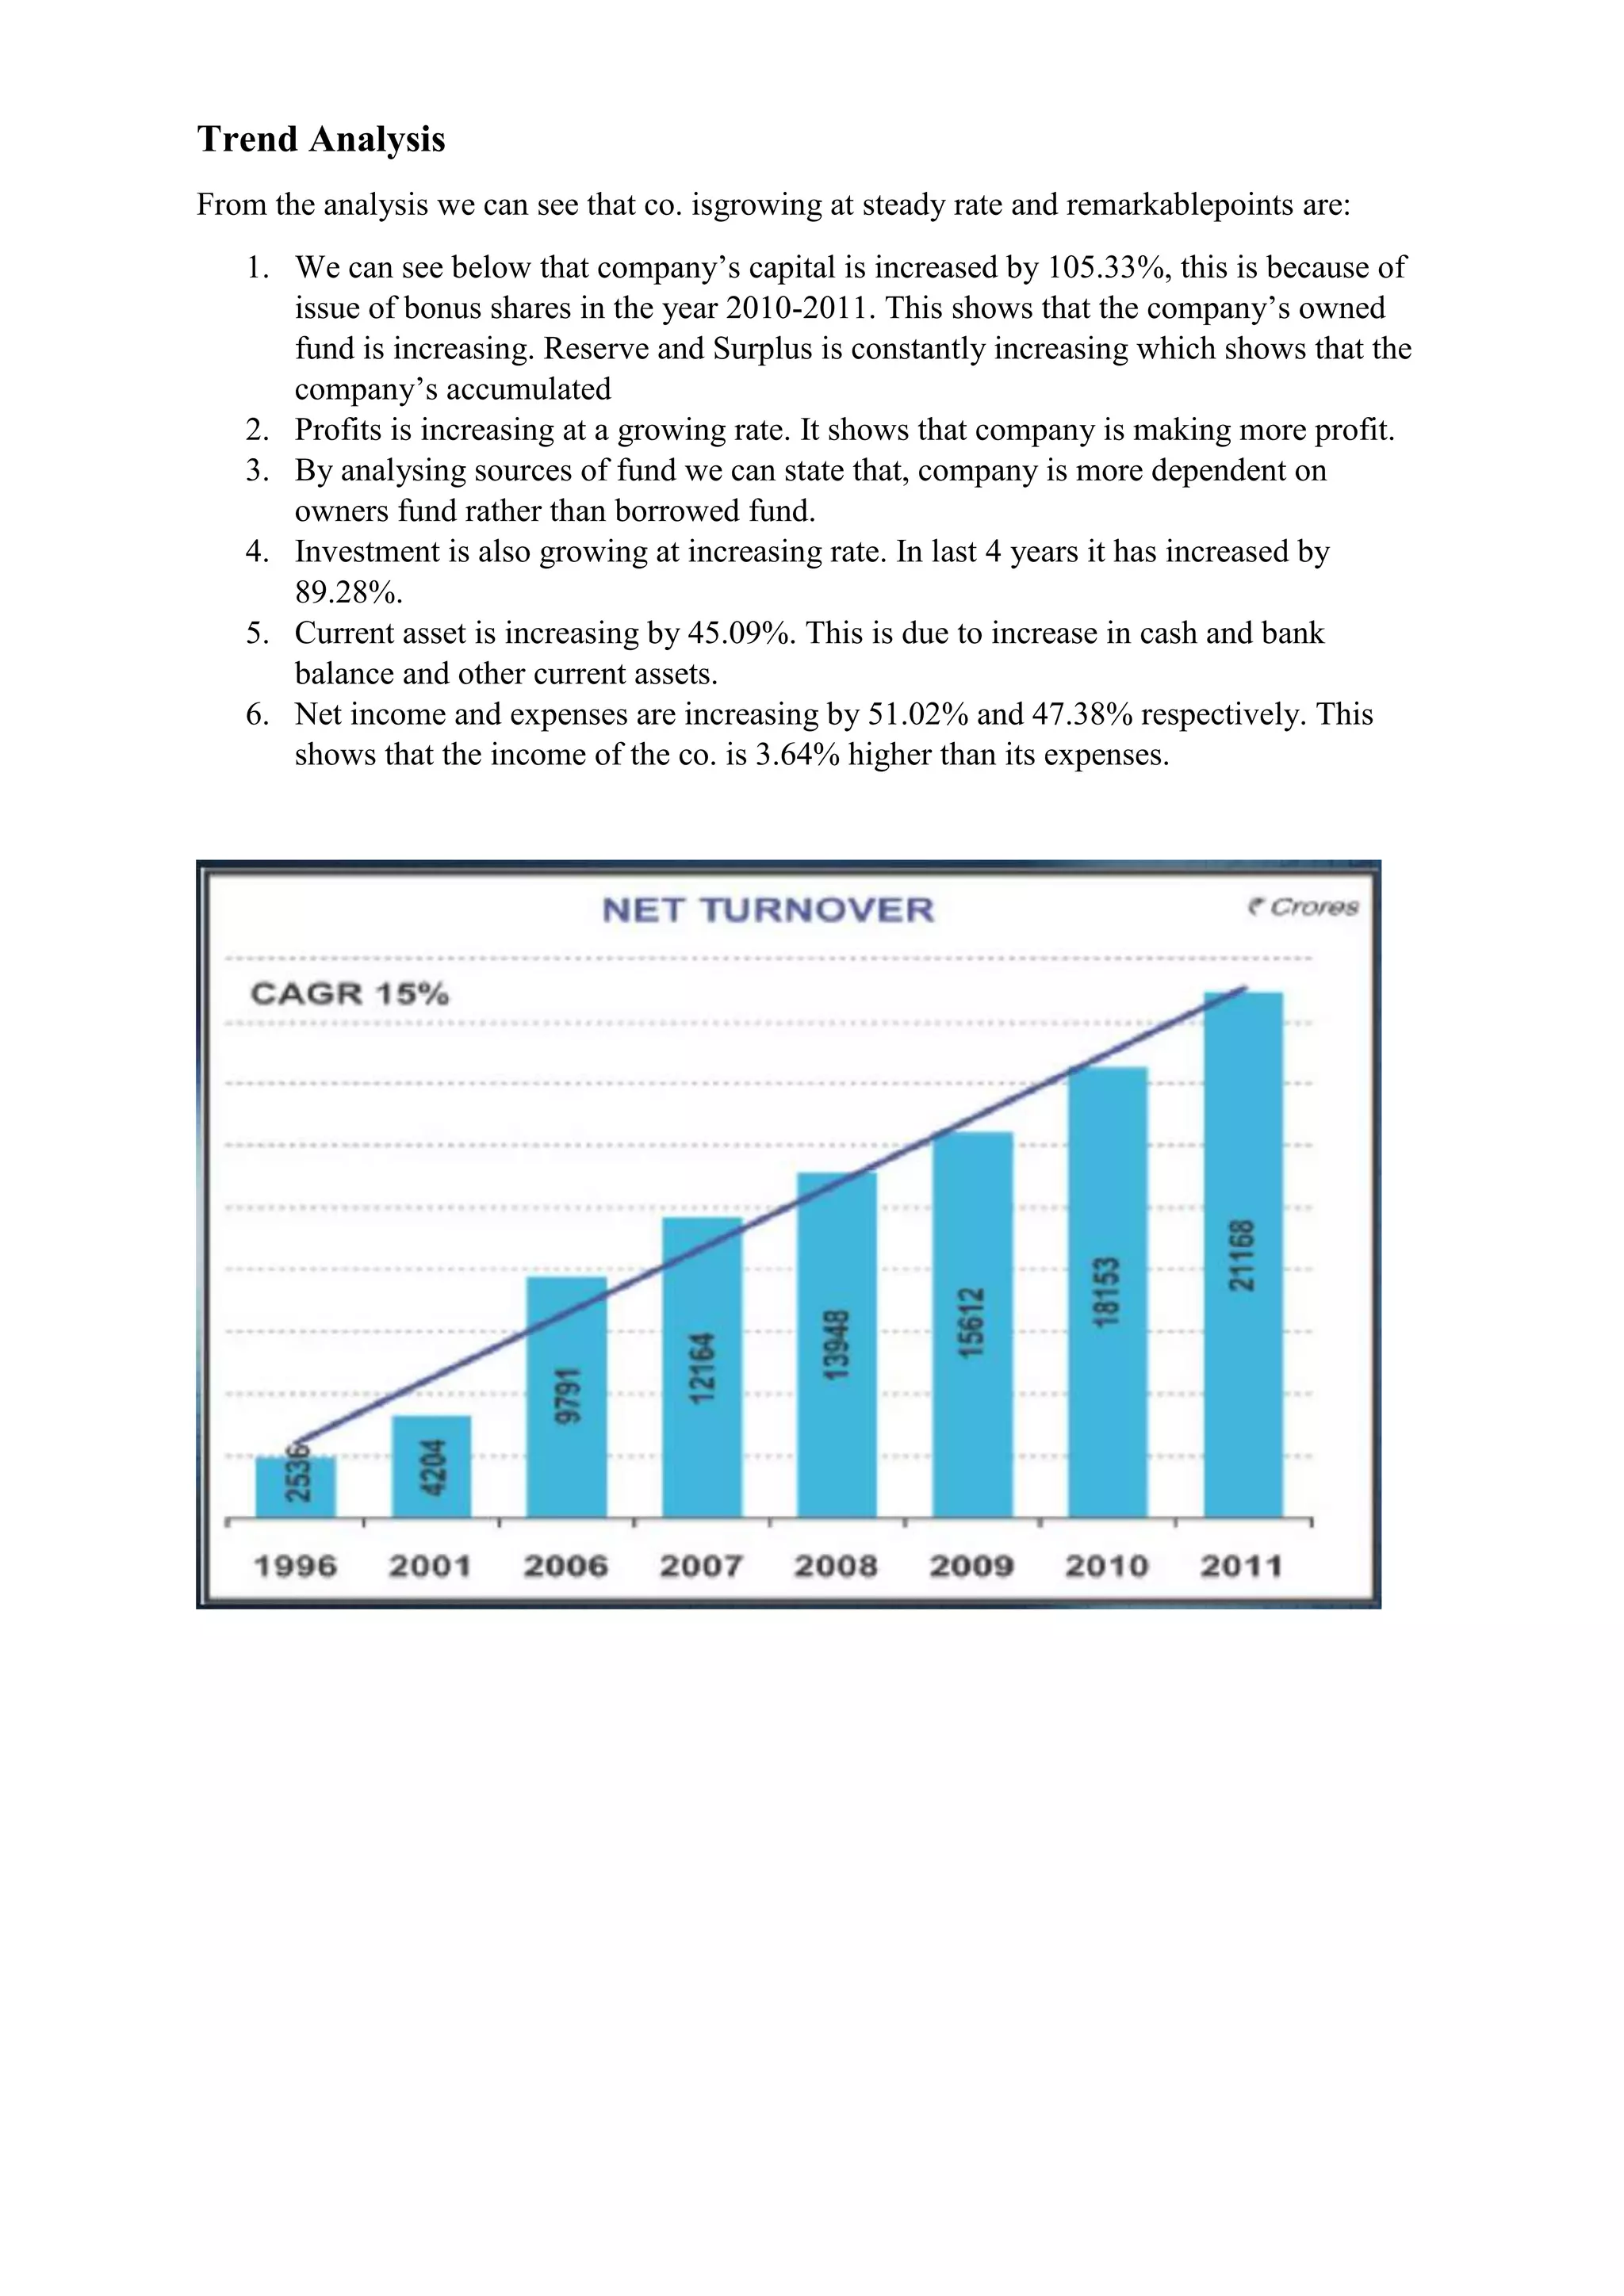
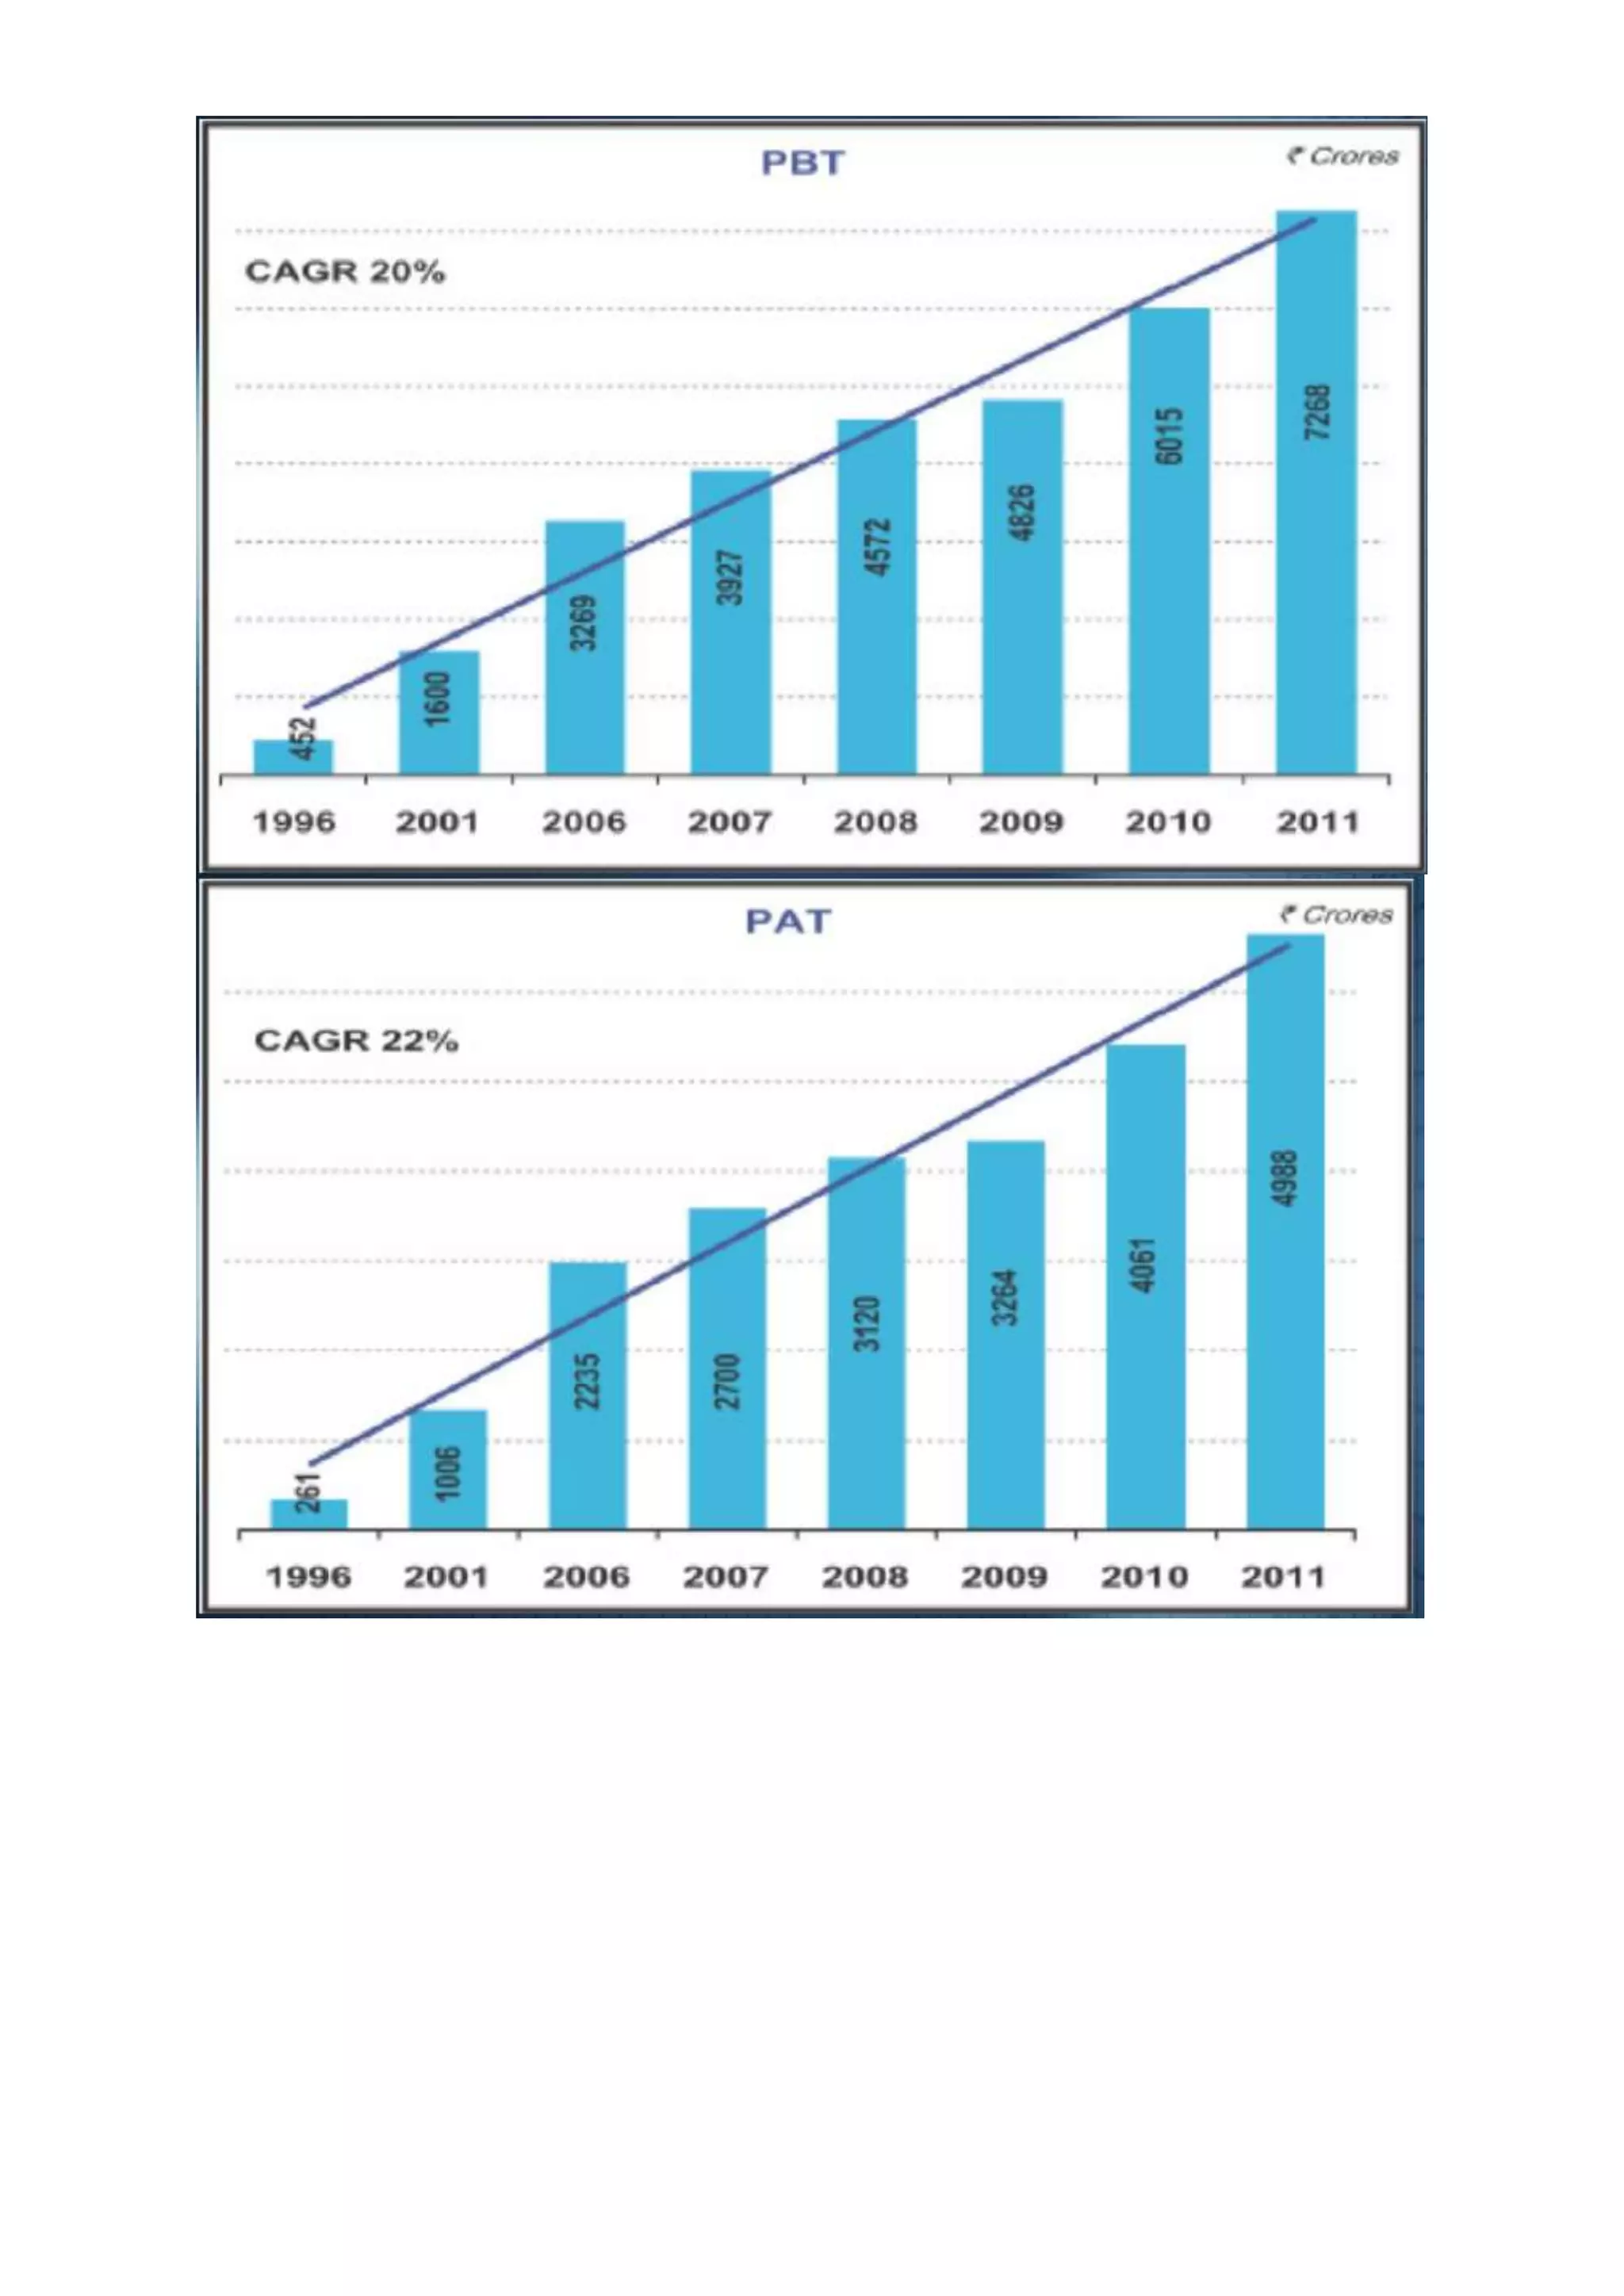
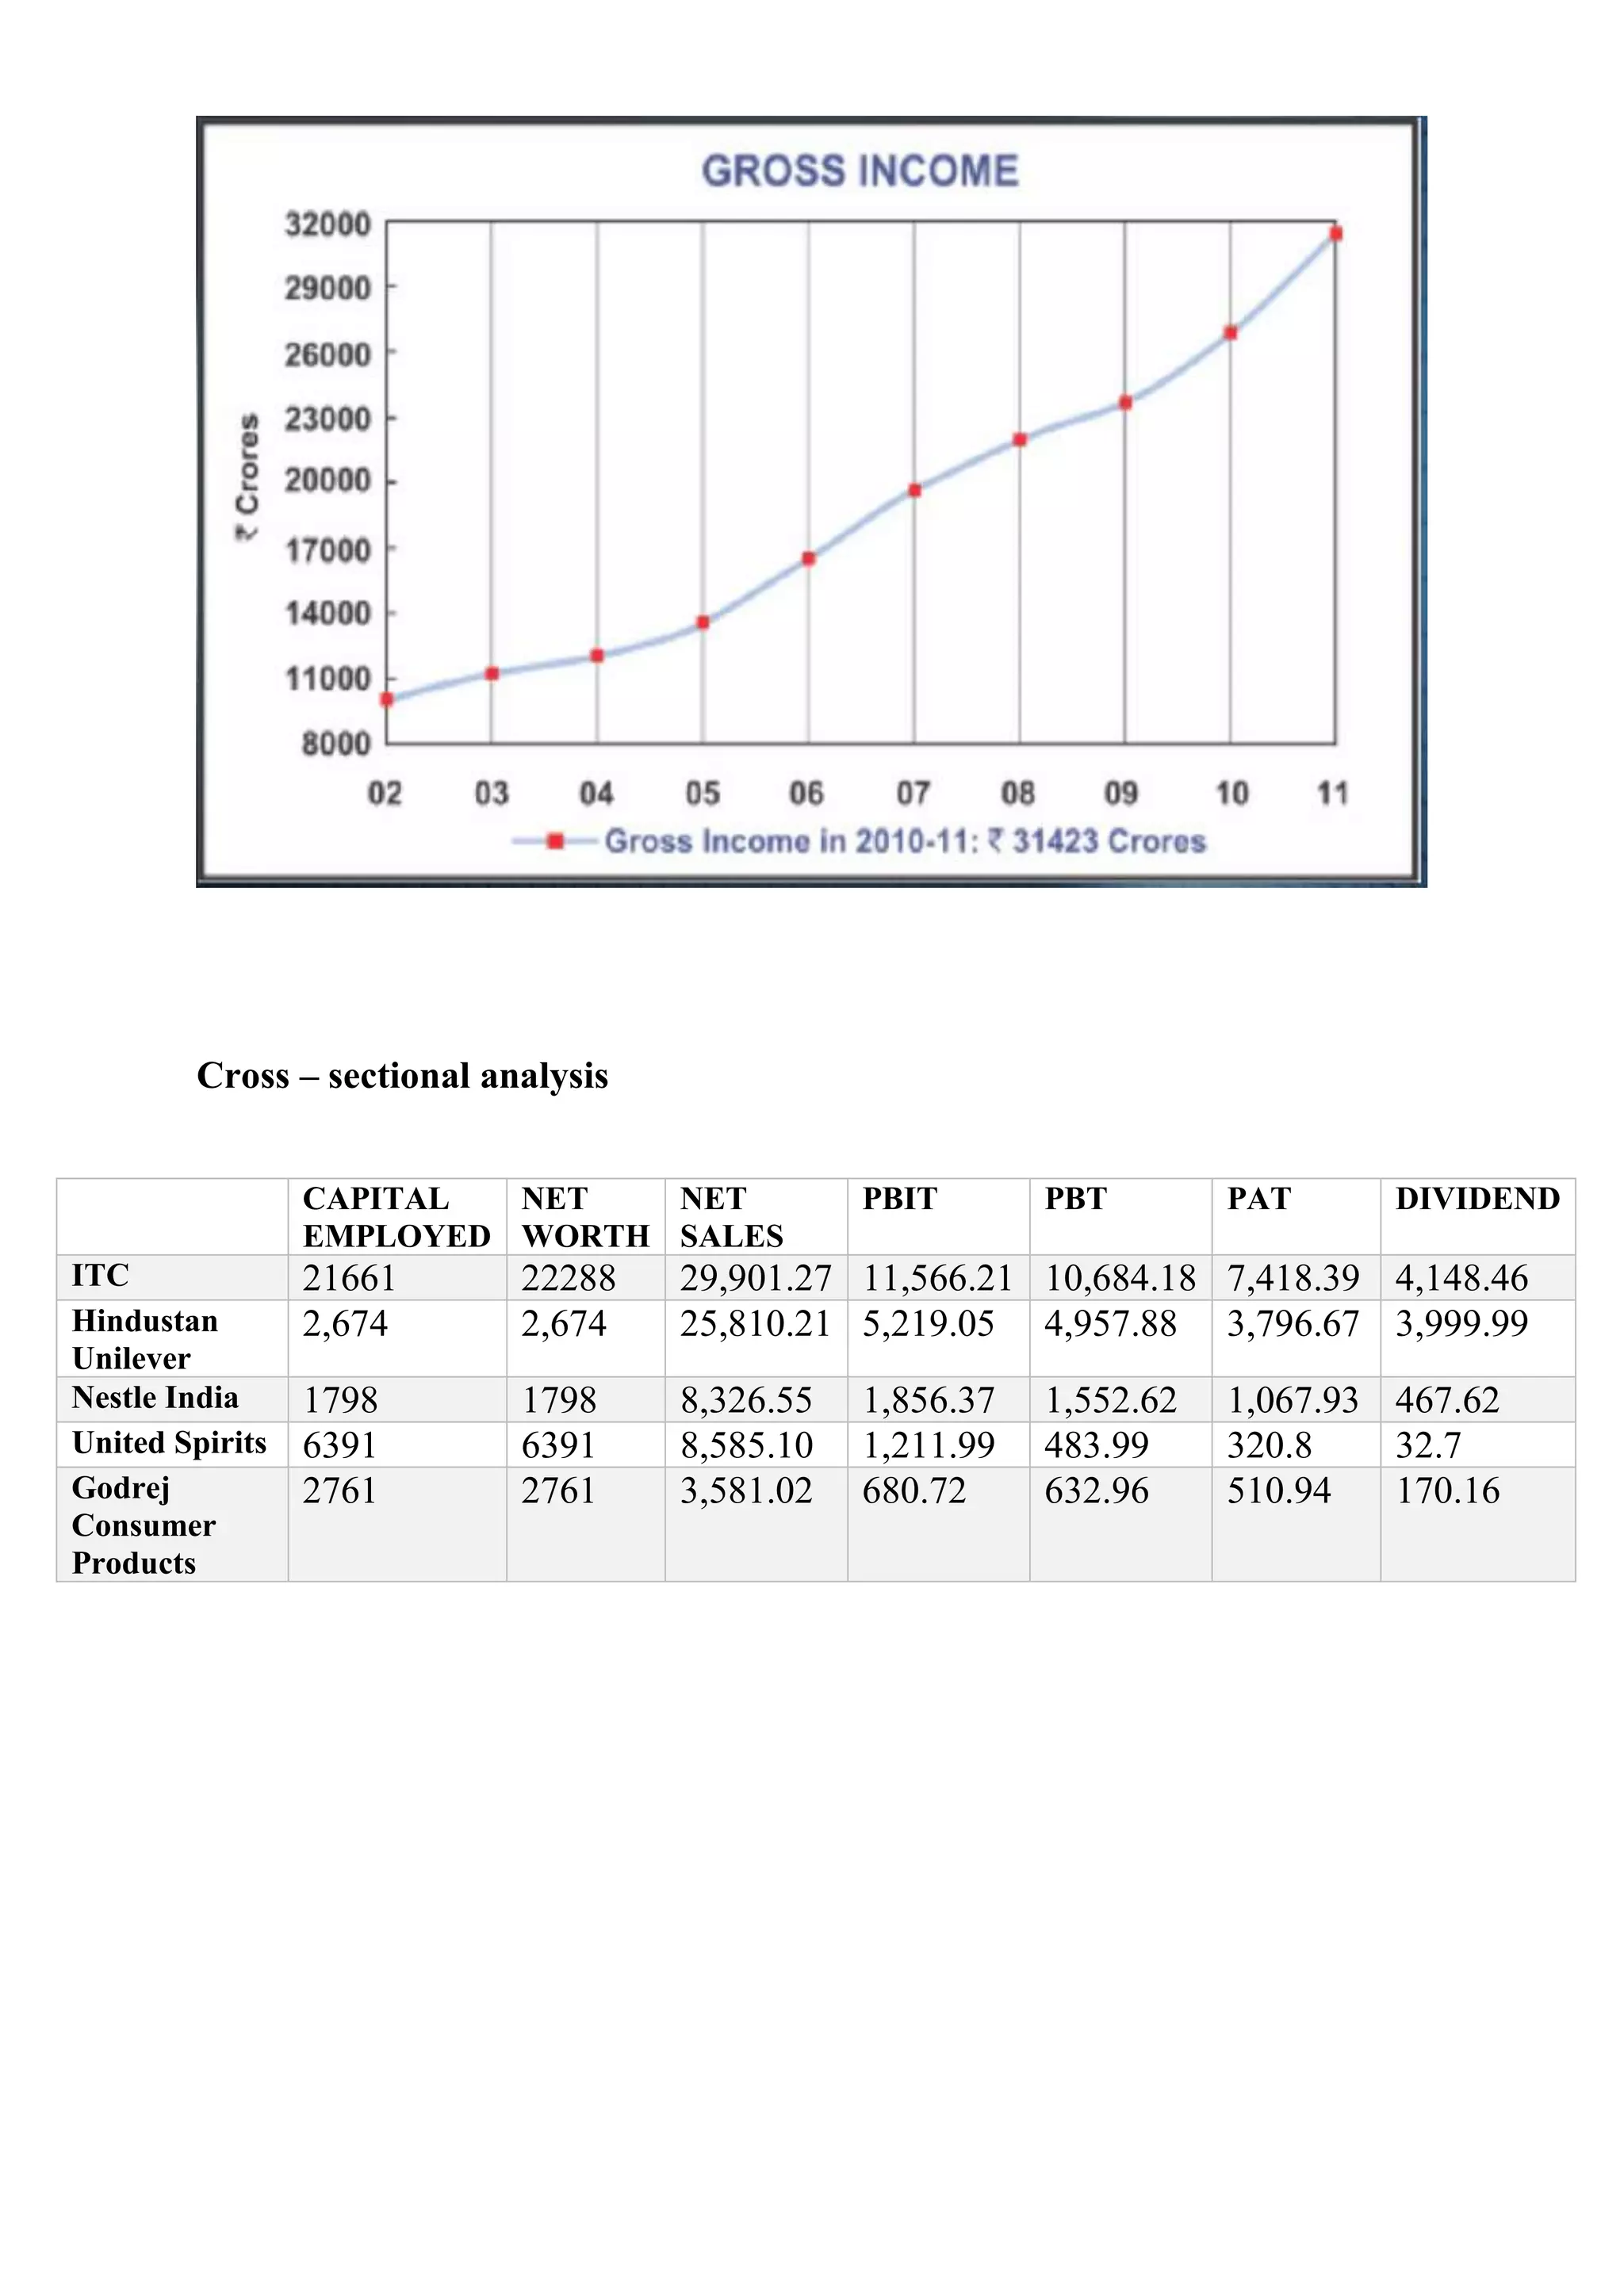

- ITC Limited is a large Indian conglomerate company headquartered in Kolkata, employing over 26,000 people across various businesses. - Between 1995-96 and 2012-13, ITC saw rapid growth and scale-up of its FMCG businesses, with net revenue increasing from Rs. 2,536 crores to Rs. 29,606 crores - a 17-year CAGR of 15.6%. - ITC aims to make a significant contribution to India's financial, environmental, and social capital by creating multiple drivers of growth while sustaining leadership in tobacco and focusing on triple bottom line performance.


![FA_Presentation[1]_ppt[1][1] new done.pptx](https://cdn.slidesharecdn.com/ss_thumbnails/fapresentation1ppt11newdone-241229185058-139d033d-thumbnail.jpg?width=640&height=640&fit=bounds)


