Tcs annual report_2013-2014 ratio analysis
•Download as DOC, PDF•
13 likes•6,574 views

Tcs annual report_2013-2014 analysis by Group 4 Syapass from ITM Business School, Kharghar

Recommended
Recommended
More Related Content
What's hot
What's hot (20)
Viewers also liked
Viewers also liked (20)
Similar to Tcs annual report_2013-2014 ratio analysis
Similar to Tcs annual report_2013-2014 ratio analysis (20)
Recently uploaded
Recently uploaded (20)
Tcs annual report_2013-2014 ratio analysis
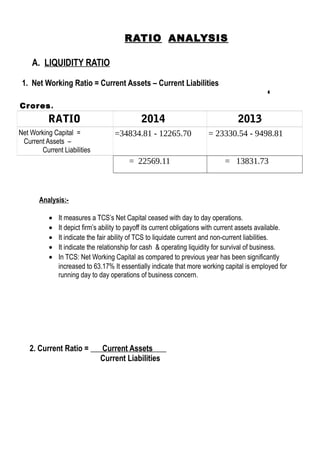
- 1. RATIO ANALYSIS A. LIQUIDITY RATIO 1. Net Working Ratio = Current Assets – Current Liabilities ‘ Crores. RATIO 2014 2013 Net Working Capital = Current Assets – Current Liabilities =34834.81 - 12265.70 = 23330.54 - 9498.81 = 22569.11 = 13831.73 Analysis:- • It measures a TCS’s Net Capital ceased with day to day operations. • It depict firm’s ability to payoff its current obligations with current assets available. • It indicate the fair ability of TCS to liquidate current and non-current liabilities. • It indicate the relationship for cash & operating liquidity for survival of business. • In TCS: Net Working Capital as compared to previous year has been significantly increased to 63.17% It essentially indicate that more working capital is employed for running day to day operations of business concern. 2. Current Ratio = Current Assets Current Liabilities
- 2. ‘ Crores. RATIO 2014 2013 Current Ratio = Current Assets Current Liabilities = 34834.81 12265.70 = 23330.54 9498.81 = 2.84 : 1 = 2.45 : 1 Analysis:- • The Viable Current Ratio is 2:1. • It is indicative of Solvency of Currents Assets in paying of its Short term Liabilites & Debts . • A Higher Current ratio enables a firms ability to pay off Current Obligations and thus provide adequate margin of safety to its creditors. • In TCS : There is More proportionate increase in Current asset (.39%) as compared to its Current obligations for a year 2014. This Indicate that a fair proportion of increase in current asset in 2014 as compared to previous year.The Ratio indicate that Company has Stressed on Investment in Current Asset in order to facilitate day to day Operations of business. 3. Quick Ratio / Acid Test Ratio = Quick Assets Quick Liabilities Quick Assets = Current Assests – Stock – Prepaid Expenses Quick Liabilities = Current Liabilities – Bank Overdraft
- 3. ‘ Crores. RATIO 2014 2013 Quick Assets = Current Assests – Stock – Prepaid Expenses = 34834.81-8.57-0 = 34826.24 = 23330.54-6.34-0 = 23324.2 Quick Liabilities = Current Liabilities – Bank Overdraft = 12265.70-0 = 12265.70 = 9498.81-80.02 = 9418.79 Quick Ratio = Quick Assets Quick Liabilities = 34826.24 12265.70 = 2.84 :1 = 23324.2 9418.79 = 2.48 : 1 Analysis:- • It evaluates Company’s Overall Short-term Solvency or Liquidity Position . • The Viable Acid Test Ratio is 1:1 Proportion. • It provide Information of Highly Convertible Liquid Assets(Excluding Stock & Marketable Securities) In Payoff Company’s Short term Obligations(Excluding Bank Overdraft.) • In TCS : Investment in Quick Ratio is Increased As Company is investing in high proportion as compared to previous year (i.e.36 % more) this indicate that Company is following conservative approach and pooling high proportions of funds in liquid assets to facilitate day to day operations ( providing safety to its Creditors ). B. ACTIVITY / TURNOVER / EFFICIENCY RATIO 1. Stock Turnover Ratio = Cost of Goods Sold Average Stock / Inventory Cost of Goods Sold = Sales – Gross Profit Average Stock = Opening Stock + Closing Stock 2 (PG-169)
- 4. ‘ Crores. RATIO 2014 2013 Cost of Goods Sold = Sales – Gross Profit = 64672.93 – 20453.17 = 44219.76 = 48426.14 – 13503.41 = 34922.73 Average Stock = Opening+Closing Stock 2 = 0.54+0.61 2 = 0.58 = 0.54+0.54 2 = 0.54 Stock Turnover Ratio = Cost of Goods Sold Average Stock / Inventory = 44219.76 0.58 = 76240.97 times = 34922.73 0.54 = 64671.72 times Analysis:- • It represents Relative size of inventory and amount of cash available to payoff its certain liabilities. • A less Inventory turnover ratio means a company has less cash tied up in Company’s Inventory in associating with Cost of Goods or services that are to be rendered & Viceversa. • In TCS : Stock (Inventory) of Company has been increased, and depicting significant cost structure is ensured in holding Inventory which ultimately reflects companies has build up inventory as compared to previous year’s & diluting companies performance. 2. Inventory Holding Period = No. Of Days / Months in a Year Stock Turnover Ratio
- 5. ‘ Crores. RATIO 2014 2013 Inventory Holding Period = No. Of Days / Months in a Year Stock Turnover Ratio = 365 76240.97 = 0.0048 days = 365 64671.72 = 0.0056 days Analysis:- • It is used to measure inventory management efficiency of business. • A higher value of inventory turnover indicate better performance & a lower value means inefficiencies in controlling inventory levels. • A lower inventory turnover ratio may be an indication of over-stocking which may pose risk of obsolescence and increased inventory holding costs. However, a very high value of this ratio may be accompanied by loss of sales due to inventory shortage. • In TCS : Management of Inventory levels are confined to maintaining a level of stock clearance and reducing substantial cost blocked in stock holdings in facilitating operations of business concern as turnover period has been reduced from 56 days Conversion cycle time to 48 days cycle period. 3. Debtors Turnover Ratio = Net Credit Sales Average Accounts Receivables ‘ Crores. RATIO 2014 2013 Debtors Turnover Ratio = Net Credit Sales Average Accounts Receivables = 64672.93 14471.89 = 4.47 times = 48426.14 11202.32 = 4.32 times
- 6. Analysis:- • Receivables turnover ratio measures company's efficiency in collecting its sales on credit and collection policies. This ratio takes in consideration ONLY the credit sales. • Accounts receivable represents the indirect interest free loans that the company is providing to its clients. • A high receivables turnover ratio implies that the company operates on a cash basis or that its extension of credit and collection of accounts receivable are efficient. • A low receivables turnover ratio implies that the company should re-assess its credit policies in order to ensure the timely collection of credit sales that is not earning interest for the firm. • In TCS : Management of company in terms of using credit policy need To be reviewed in providing credit period to its clients i.e. Recovery period has been increased about 46.9% as compared to last year . C. LONG TERM SOLVENCY / FINANCIAL STABILITY / CAPITAL STRUCTURE RATIOS 1. Debt / Equity Ratio = Debt Equity Debt = Long Term Debt / Borrowed Funds = Secured Loans and Unsecured loans Equity = Shareholders Fund / Owned Fund = Share Capital + Reserves & Surplus ‘ Crores. RATIO 2014 2013 Shareholders Fund = 195.87 + 43856.01 = 44051.88 = 295.72 + 32266.53 = 32562.25 Debt / Equity Ratio = Debt Equity = 89.69 44051.88 = 0.002 : 1 = 83.10 32562.25 = 0.0026 :1
- 7. Analysis:- • A ratio of 1 or 1 : 1 means that creditors and stockholders equally contribute to the assets of the business. • A less than 1 ratio indicates that the portion of assets provided by stockholders is greater than the portion of assets provided by creditors and a greater than 1 ratio indicates that the portion of assets provided by creditors is greater than the portion of assets provided by stockholders. • A ratio of 1 : 1 is normally considered satisfactory & ideal. Sometimes Debt equity ratio vary from industry to industry as each industy is subject to norms & regulation. • In TCS : Ratio indicates less contribution from its stockholders and significant contribution from equity towards generating assets & facilitating funds to ensure operations of business concern. & Less Contributions from Long terms funds & borrowings adhered for fetching revenues and providing business . 2. Proprietory / Net-Worth / Asset Backing Ratio = Proprietor's Fund Total Assets Proprietor's Fund = Shareholder's Fund / Net Worth = Share Capital + Reserves & Surplus ‘ Crores. RATIO 2014 2013 Shareholders Fund = 195.87 + 43856.01 = 44051.88 = 295.72 + 32266.53 = 32562.25 Proprietory / Net-Worth / Asset Backing Ratio = Proprietor's Fund Total Assets = 44051.88 57604.19 = 0.764 : 1 or 76.4% = 32562.25 42834.04 = 0.76 : 1 or 76 %
- 8. Analysis:- • It depict the contribution of stockholders’ in total capital of the company. • A high proprietary ratio, therefore, indicates a strong financial position of the company and greater security for creditors. A low ratio indicates that the company is already heavily depending on debts for its operations. • In TCS : Near About ¾ of Contibution to Asset Creation are ensured by Company’s Shareholders. This reflect that Company is not being taking full advantage of debt financing for its operations essentially but indicates a strong consolidated financial position of the company and provides greater security for creditors. 3. Capital Gearing Ratio = Capital Bearing Fixed Interest & Dividend Capital Not Bearing Fixed Interest & Dividend CBFID = Long Term Borrowing + Preference Share Capital CNBFID = Equity Share Capital + Reserves & Surplus ‘ Crores RATIO 2014 2013 CBFID = 89.69 + 0 = 89.69 = 83.10 + 100 = 183.10 CNBFID = 195.87 + 43856.01 = 44051.88 =195.72 + 32266.53 = 32462.25 Capital Gearing Ratio = CBFID CNBFID = 89.69 44051.88 =0.0020 :1 or 0.20% = 183.10 32462.25 =0.0056 :1 or 0.56% Analysis:- • It show case the relationship of long term debt to total capital which is considered the
- 9. most important by many investors and financial analysts. • Capital gearing ratio is a useful tool to analyze the capital structure of a company and is computed by dividing the common stockholders’ equity by fixed interest or dividend bearing funds. • In TCS it is Highly geared in both the years which means less common stockholders’ equity. 4. Interest Coverage Ratio = Earning Before Interest & Tax Interest ‘ Crores RATIO 2014 2013 Interest Coverage Ratio = Earning Before Interest & Tax Interest = 23567.88 23.41 = 1006.74 times = 15733.80 30.62 = 513.84 times Analysis:- • It determines the debt servicing capacity of a business enterprise keeping in view fixed interest on long-term debt. • Higher the ratio better it is. • TCS has an increase in ratio by 492.9 times since last year which shows the degree of protection creditors have from default on the payment of interest by the co. D. PROFITABILITY RATIO (i) With respect to SALES 1. Gross Profit Ratio = Gross Profit x 100 Net Sales
- 10. ‘ Crores RATIO 2014 2013 Gross Profit Ratio = Gross Profit x 100 Net Sales = 20453.17 x 100 64672.93 = 31.63 % = 13503.41 x 100 48426.14 = 27.88 % Analysis:- • This ratio helps in judging the relationship between gross profit and net sales. • It is a reliable guide to the adequacy of selling prices and effciency of trading activities. • Higher the ratio better it shows the performance of trading activities of the co. • TCS' ratio has increased by 3.75 % since last year, which indicates better functioning of the co. 2. Net Operating Ratio = Net Operating Profit x 100 Net Sales ‘ Crores RATIO 2014 2013 Net Operating Ratio = Net Operating Profit x 100 Net Sales = 20453.17 x100 64672.93 = 31.62 % = 13503.41 x 100 48426.14 = 27.88 %
- 11. Analysis :- • This ratio indicates the profitability of current operations. This ratio does not take into account the company's capital and tax structure. It shows how much cash is thrown off after most of the expenses are met. • A high operating profit ratio means that the company has good cost control and/or that sales are increasing faster than costs, which is the optimal situation for the company. • TCS has increased its ratio by 3.74 % as compared to last year. 3. Net Profit Ratio = Net Profit Before Tax or Net Profit After Tax x 100 Net Sales ‘ Crores RATIO 2014 2013 Net Profit Ratio = Net Profit Before Tax x 100 Net Sales = 23544.47 x 100 64672.93 = 36.41 % = 15703.18 x 100 48426.14 = 32.43 % Net Profit Ratio = Net Profit After Tax x 100 Net Sales = 18474.92 x 100 64672.93 = 28.57 % = 12786.34 x 100 48426.14 = 26.40 % Analysis:- • It indicates overall efficiency of the co. By establishing the relationship between net profit and sales i.e. it shows the percentage of net profit earned on net sales. • Higher the ratio better the business is. • TCS has an increase of 2.17 % of ratio as compared to last year, it shows improvement in operational efficiency of the business.
- 12. 4. Operating Ratio = Operating Cost x 100 Net Sales Operating Cost = Cost of Goods Sold + Operating Expenses Cost of Goods Sold = Sales – Gross Profit ‘ Crores RATIO 2014 2013 Operating Ratio = Operating Cost x 100 Net Sales = 44219.76 x 100 64672.93 = 63.37 % = 34922.73 x 100 48426.14 = 72.12 % Analysis:- • This ratio is calculated to judge the operational effeciency of the business. It shows the percentage of sales that is absorbed by the cost of sales and operating expenses. • In this lower the ratio better it is, because it would lead higher margin to meet interest , dividend. • TCS is able to reduce its operating ratio by 8.75 % as compared to last year which is a positive sign for the co. And it will have higher margin to meet interest , dividend. 5. Expense Ratio = Cost of Goods Sold or Administrative or Selling Expenses x 100 Sales ‘ Crores RATIO 2014 2013 Expense Ratio = Cost of Goods Sold x 100 Sales = 44219.76 x 100 64672.93 = 68.37 % = 34922.73 x 100 48426.14 = 72.12 %
- 13. Analysis:- • This ratio indicates how much is the cost incurred by the co. in expenses like cost of goods sold, administrative and selling expenses. • Lower the ratio the better is expense ratio as it indicates reduction in expenses. • The ratio of TCS has reduced by 3.75 % as compared to last year which is a good sign. (ii) With Respect to Investment 1. Return on Capital Employed = Earning Before Interest & Tax x 100 Capital Employed Capital Employed = Shareholders fund + Long Term Loans OR Capital Employed = Fixed Assets + Working Capital Working Capital = Current Assets – Current Liabilities ‘ Crores RATIO 2014 2013 Capital Employed = Shareholders fund + Long Term Loans = 44051.88 + 89.69 = 44138.57 = 32562.25 + 83.10 = 32645.35 Return on Capital Employed = Earning Before Interest & Tax x 100 Capital Employed = 23567.88 x 100 44138.57 = 53.40 % = 15733.88 x 100 32645.35 = 48.20 % Analysis:-
- 14. • This ratio evaluates the earning capacity of company and determines whether or not the company is making optimum utilization of its assets. • Higher the ratio signifies better the return on investment of the company. • TCS' ROI has increased by 5.2 % as compared to last year, which indicates overall performance of the co. Is going good and its borrowing policy is also wise. 2. Return On Proprietor's Fund = Net Profit After Tax x 100 Proprietor's Fund Proprietor's Fund = Shareholders Fund / Net Worth = Share Capital + Reserves & Surplus ‘ Crores RATIO 2014 2013 Net Profit After Tax x 100 Proprietor's Fund = 18474.92 x100 44051.88 = 41.94 % = 12786.34 x 100 32562.25 = 39.27 % Analysis:- • This Ratio indicates the percentage of return that the company is able to earn on shareholder's fund. It serves as a guide to the investors for making investment decision. • Higher the ratio better is the return on proprietor's fund. • This simplifies that TCS is earning good return on proprietor's fund and has good profitability as well as compared to last year because the co. Has increased its ratio by 2.97 % which is a good sign. • This gives better understanding for decision making and a clear picture to investors and creditors whether to invest in a co. Or not. 3. Return on Equity Share Capital
- 15. = Net Profit After Tax – Preference Dividend x 100 Equity Shareholder's fund ‘ Crores RATIO 2014 2013 Return on Equity Share Capital = Net Profit After Tax – Preference Dividend x 100 Equity Shareholder's fund = 18474.92 - 19 x 100 44051.88 = 41.89 % = 12786.34 – 22 x 100 32562.25 = 39.20 % Analysis:- • This ratio indicates the return which the management is realising from shareholder's equity and shows how effectively it is been utilised. • Higher the ratio the better is Return on equity. • This year TCS' ratio has increased by 2.69 % which is a good sign for the company which indicates co. Has increased its sahre capital. E. VALUATION OF RATIO 1. Earning Per Share = Net Profit After Tax – Preference Dividend No. Of Equity Shares ‘ Crores RATIO 2014 2013 Earning Per Share = Net Profit After Tax – Preference Dividend No. Of Equity Shares = 18474.92 - 19 195,87,27,979 = 0.000009422 per share = 12786.34 – 22 195,72,20,996 = 0.000006521 per share
- 16. Analysis:- • This ratio indicates per share earning of a Company in a particular year. It also helps in evaluating the prevailing market share in the light of profit earning capacity. • In this Higher the ratio the better is the EPS of company. • TCS has increased its EPS by 0.03 % which is a good sign for the company. 2. Dividend Per Share = Equity Dividend Paid No. Of Equity Shares ‘ Crores RATIO 2014 2013 Dividend Per Share = Equity Dividend Paid No. Of Equity Shares = 3608.63 195,87,27,979 = 0.000001842 per share = 3608.63 195,72,20,996 = 0.000001843 per share Analysis:- • Objective of computing this ratio is to measure the dividend distributed per equity share. • In this Higher the ratio the better is the DPS. • In this Ratio we can analyse, TCS has not able to increase its Equity Dividend but not even reduced it as almost same no. Of people invested in company , so TCS is in stable position. 3. Dividend Payout Ratio = Dividend Per Share x 100 Earning Per Share ‘ Crores RATIO 2014 2013 Dividend Payout Ratio = Dividend Per Share x 100 Earning Per Share = 0.000001842 x 100 0.000009422 = 19.55 % = 0.000001843 x 100 0.000006521 = 28.26 % Analysis :- • This ratio indicates the percentage of earnings that the company has distributed in the
- 17. form of dividends. • As compared to last year TCS' percentage of Dividend Payout ratio has Decreased by 8.71 % . • A low ratio may indicate the company is using much of its earnings to reinvest in the company in order to grow further.