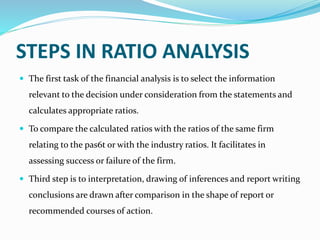
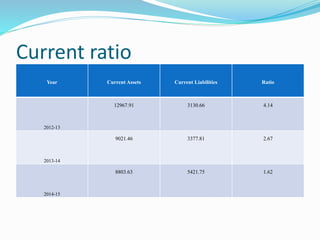
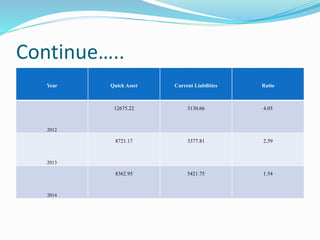
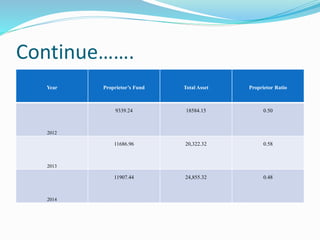
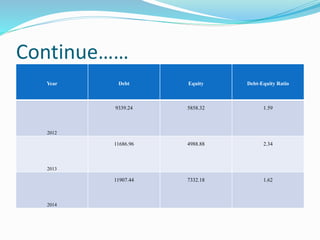
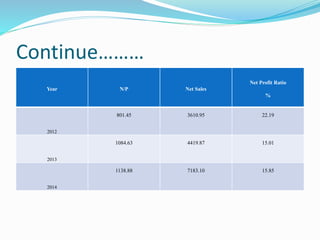
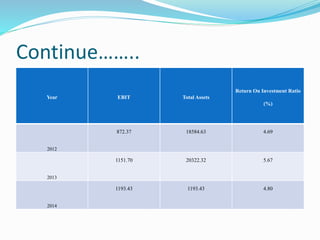
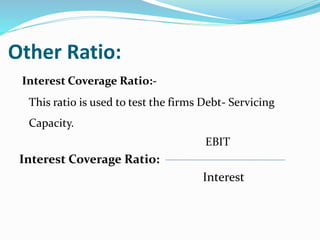
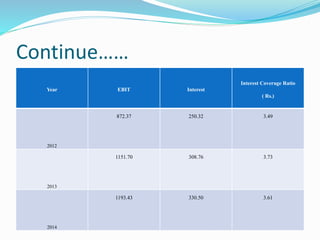
This document analyzes financial ratios for Reliance Infrastructure Limited over three fiscal years. It calculates and interprets ratios related to liquidity, leverage, activity and profitability. Key findings include a declining current ratio, increasing operating expenses, fluctuating proprietary ratio, and adequate interest coverage. Overall, the analysis concludes Reliance Infrastructure's financial condition is good, though it could diversify funds across sectors for stability in changing markets.
Introduction to ratio analysis. This slide show is an analysis of accounting ratios to introduce students and those interested in taking accounting as their future career into ratio analysis. It's been simplified and made concise. The writer is a lecturer in engineering and a financial engineer. You can always follow the writer on LinkedIn, Twitter of Facebook. You comments are also welcome for future work.
This particular project is based on ratio analysis of Coca-Cola International. I have analyzed two years financial performance of Coke i.e. from 2011 to 2012. I hope my this effort will help other interested students.
This presentatian is about the company Apple. In this presentation you can find the results of the revenue of the 3rd and 4th quarter of 2010 and 2011.
FINANCIAL STATEMENT ANALYSIS OF DELHI TRANSCO LIMITED LakshayKumar43
1. To examine and analyze the Financial Statements of Delhi Transco Ltd.
2. To investigate the profitability of the company with the help of different Ratios.
3. To examine the financial position of the company with the help of solvency ratios.
Financial Management is the specific area of finance dealing with the financial decision corporations make, and the tools and analysis used to make the decisions. The discipline as a whole may be divided between long-term and short-term decisions and techniques. Both share the same goal of enhancing firm value by ensuring that return on capital exceeds the cost of capital, without taking excessive financial risks.
1. To examine and analyze the Financial Statements of Delhi Transco Ltd.
2. To investigate the profitability of the company with the help of different Ratios.
3. To examine the financial position of the company with the help of solvency ratios
A financial ratio (or accounting ratio) is a relative magnitude of two selected numerical values taken from an enterprise's financial statements. Often used in accounting, there are many standard ratios used to try to evaluate the overall financial condition of a corporation or other organization. Financial ratios may be used by managers within a firm, by current and potential shareholders (owners) of a firm, and by a firm's creditors. Financial analysts use financial ratios to compare the strengths and weaknesses in various companies.[1] If shares in a company are traded in a financial market, the market price of the shares is used in certain financial ratios.
Ratios can be expressed as a decimal value, such as 0.10, or given as an equivalent percent value, such as 10%. Some ratios are usually quoted as percentages, especially ratios that are usually or always less than 1, such as earnings yield, while others are usually quoted as decimal numbers, especially ratios that are usually more than 1, such as P/E ratio; these latter are also called multiples. Given any ratio, one can take its reciprocal; if the ratio was above 1, the reciprocal will be below 1, and conversely. The reciprocal expresses the same information, but may be more understandable: for instance, the earnings yield can be compared with bond yields, while the P/E ratio cannot be: for example, a P/E ratio of 20 corresponds to an earnings yield of 5%.
Values used in calculating financial ratios are taken from the balance sheet, income statement, statement of cash flows or (sometimes) the statement of retained earnings. These comprise the firm's "accounting statements" or financial statements. The statements' data is based on the accounting method and accounting standards used by the organization.
Ratios
Profitability ratios
Liquidity ratios
Activity ratios (Efficiency Ratios)
Debt ratios (leveraging ratios)
Market ratios
Capital budgeting ratios
Financial ratios quantify many aspects of a business and are an integral part of the financial statement analysis. Financial ratios are categorized according to the financial aspect of the business which the ratio measures. Liquidity ratios measure the availability of cash to pay debt.[2] Activity ratios measure how quickly a firm converts non-cash assets to cash assets.[3] Debt ratios measure the firm's ability to repay long-term debt.[4] Profitability ratios measure the firm's use of its assets and control of its expenses to generate an acceptable rate of return.[5] Market ratios measure investor response to owning a company's stock and also the cost of issuing stock.[6] These are concerned with the return on investment for shareholders, and with the relationship between return and the value of an investment in company’s shares.
Financial ratios allow for comparisons
between companies
between industries
between different time periods for one company
between a single company and its industry average
Taurus Zodiac Sign_ Personality Traits and Sign Dates.pptxmy Pandit
Explore the world of the Taurus zodiac sign. Learn about their stability, determination, and appreciation for beauty. Discover how Taureans' grounded nature and hardworking mindset define their unique personality.
Explore our most comprehensive guide on lookback analysis at SafePaaS, covering access governance and how it can transform modern ERP audits. Browse now!
3.0 Project 2_ Developing My Brand Identity Kit.pptxtanyjahb
A personal brand exploration presentation summarizes an individual's unique qualities and goals, covering strengths, values, passions, and target audience. It helps individuals understand what makes them stand out, their desired image, and how they aim to achieve it.
The world of search engine optimization (SEO) is buzzing with discussions after Google confirmed that around 2,500 leaked internal documents related to its Search feature are indeed authentic. The revelation has sparked significant concerns within the SEO community. The leaked documents were initially reported by SEO experts Rand Fishkin and Mike King, igniting widespread analysis and discourse. For More Info:- https://news.arihantwebtech.com/search-disrupted-googles-leaked-documents-rock-the-seo-world/
Skye Residences | Extended Stay Residences Near Toronto Airportmarketingjdass
Experience unparalleled EXTENDED STAY and comfort at Skye Residences located just minutes from Toronto Airport. Discover sophisticated accommodations tailored for discerning travelers.
Website Link :
https://skyeresidences.com/
https://skyeresidences.com/about-us/
https://skyeresidences.com/gallery/
https://skyeresidences.com/rooms/
https://skyeresidences.com/near-by-attractions/
https://skyeresidences.com/commute/
https://skyeresidences.com/contact/
https://skyeresidences.com/queen-suite-with-sofa-bed/
https://skyeresidences.com/queen-suite-with-sofa-bed-and-balcony/
https://skyeresidences.com/queen-suite-with-sofa-bed-accessible/
https://skyeresidences.com/2-bedroom-deluxe-queen-suite-with-sofa-bed/
https://skyeresidences.com/2-bedroom-deluxe-king-queen-suite-with-sofa-bed/
https://skyeresidences.com/2-bedroom-deluxe-queen-suite-with-sofa-bed-accessible/
#Skye Residences Etobicoke, #Skye Residences Near Toronto Airport, #Skye Residences Toronto, #Skye Hotel Toronto, #Skye Hotel Near Toronto Airport, #Hotel Near Toronto Airport, #Near Toronto Airport Accommodation, #Suites Near Toronto Airport, #Etobicoke Suites Near Airport, #Hotel Near Toronto Pearson International Airport, #Toronto Airport Suite Rentals, #Pearson Airport Hotel Suites
India Orthopedic Devices Market: Unlocking Growth Secrets, Trends and Develop...Kumar Satyam
According to TechSci Research report, “India Orthopedic Devices Market -Industry Size, Share, Trends, Competition Forecast & Opportunities, 2030”, the India Orthopedic Devices Market stood at USD 1,280.54 Million in 2024 and is anticipated to grow with a CAGR of 7.84% in the forecast period, 2026-2030F. The India Orthopedic Devices Market is being driven by several factors. The most prominent ones include an increase in the elderly population, who are more prone to orthopedic conditions such as osteoporosis and arthritis. Moreover, the rise in sports injuries and road accidents are also contributing to the demand for orthopedic devices. Advances in technology and the introduction of innovative implants and prosthetics have further propelled the market growth. Additionally, government initiatives aimed at improving healthcare infrastructure and the increasing prevalence of lifestyle diseases have led to an upward trend in orthopedic surgeries, thereby fueling the market demand for these devices.
Enterprise Excellence is Inclusive Excellence.pdfKaiNexus
Enterprise excellence and inclusive excellence are closely linked, and real-world challenges have shown that both are essential to the success of any organization. To achieve enterprise excellence, organizations must focus on improving their operations and processes while creating an inclusive environment that engages everyone. In this interactive session, the facilitator will highlight commonly established business practices and how they limit our ability to engage everyone every day. More importantly, though, participants will likely gain increased awareness of what we can do differently to maximize enterprise excellence through deliberate inclusion.
What is Enterprise Excellence?
Enterprise Excellence is a holistic approach that's aimed at achieving world-class performance across all aspects of the organization.
What might I learn?
A way to engage all in creating Inclusive Excellence. Lessons from the US military and their parallels to the story of Harry Potter. How belt systems and CI teams can destroy inclusive practices. How leadership language invites people to the party. There are three things leaders can do to engage everyone every day: maximizing psychological safety to create environments where folks learn, contribute, and challenge the status quo.
Who might benefit? Anyone and everyone leading folks from the shop floor to top floor.
Dr. William Harvey is a seasoned Operations Leader with extensive experience in chemical processing, manufacturing, and operations management. At Michelman, he currently oversees multiple sites, leading teams in strategic planning and coaching/practicing continuous improvement. William is set to start his eighth year of teaching at the University of Cincinnati where he teaches marketing, finance, and management. William holds various certifications in change management, quality, leadership, operational excellence, team building, and DiSC, among others.
What are the main advantages of using HR recruiter services.pdfHumanResourceDimensi1
HR recruiter services offer top talents to companies according to their specific needs. They handle all recruitment tasks from job posting to onboarding and help companies concentrate on their business growth. With their expertise and years of experience, they streamline the hiring process and save time and resources for the company.
Discover the innovative and creative projects that highlight my journey throu...dylandmeas
Discover the innovative and creative projects that highlight my journey through Full Sail University. Below, you’ll find a collection of my work showcasing my skills and expertise in digital marketing, event planning, and media production.
Improving profitability for small businessBen Wann
In this comprehensive presentation, we will explore strategies and practical tips for enhancing profitability in small businesses. Tailored to meet the unique challenges faced by small enterprises, this session covers various aspects that directly impact the bottom line. Attendees will learn how to optimize operational efficiency, manage expenses, and increase revenue through innovative marketing and customer engagement techniques.
Affordable Stationery Printing Services in Jaipur | Navpack n PrintNavpack & Print
Looking for professional printing services in Jaipur? Navpack n Print offers high-quality and affordable stationery printing for all your business needs. Stand out with custom stationery designs and fast turnaround times. Contact us today for a quote!
Putting the SPARK into Virtual Training.pptxCynthia Clay
This 60-minute webinar, sponsored by Adobe, was delivered for the Training Mag Network. It explored the five elements of SPARK: Storytelling, Purpose, Action, Relationships, and Kudos. Knowing how to tell a well-structured story is key to building long-term memory. Stating a clear purpose that doesn't take away from the discovery learning process is critical. Ensuring that people move from theory to practical application is imperative. Creating strong social learning is the key to commitment and engagement. Validating and affirming participants' comments is the way to create a positive learning environment.
3. Contents
Introduction
RATIO ANALYSIS
STEPS IN RATIO ANALYSIS
NATURE OF RATIO ANALYSIS
FUNCTIONAL CLASSIFICATION
DATA ANALYSIS
CURRENT RATIO
QUICK RATIO
PROPRIETOR RATIO
Debt Equity Ratio
Gross Profit Ratio
Net Profit Ratio
Return On Net Worth
Return On Investment
Interest Coverage Ratio
Finding and conclusion
4. Introduction
Reliance Infrastructure Limited (formerly Reliance Energy
Limited) is a part of the Reliance Anil Dhirubhai Ambani Group,
India’s second largest business house.
Reliance Infrastructure companies distribute more than 25
billion units of electricity to over 25 million consumers across an
area that spans over 1,24,300 sq kms and includes India’s two
premier cities, Mumbai and Delhi. The Company generates over
940 MW of electricity through its power stations located in
Maharashtra, Andhra Pradesh, Kerala, Karnataka and Goa.
5. RATIO ANALYSIS
FINANCIAL ANALYSIS
Financial analysis is the process of identifying the
financial strengths and weaknesses of the firm and
establishing relationship between the items of the balance
sheet and profit & loss account. Financial ratio analysis is
the calculation and comparison of ratios, which are derived
from the information in a company’s financial statements.
6. RATIO ANALYSIS
The term “Ratio” refers to the numerical and
quantitative relationship between two items or
variables. This relationship can be exposed as
Percentages
Fractions
Proportion of numbers
7. STEPS IN RATIO ANALYSIS
The first task of the financial analysis is to select the information
relevant to the decision under consideration from the statements and
calculates appropriate ratios.
To compare the calculated ratios with the ratios of the same firm
relating to the pas6t or with the industry ratios. It facilitates in
assessing success or failure of the firm.
Third step is to interpretation, drawing of inferences and report writing
conclusions are drawn after comparison in the shape of report or
recommended courses of action.
8. NATURE OF RATIO ANALYSIS
Ratio analysis is a technique of analysis and interpretation
of financial statements. It is the process of establishing and
interpreting various ratios for helping in making certain
decisions. It is only a means of understanding of financial
strengths and weaknesses of a firm.
9. IN THE VIEW OF FUNCTIONAL CLASSIFICATION THE
RATIOS ARE
Liquidity ratio
Leverage ratio
Activity ratio
Profitability ratio
10. DATA ANALYSIS
CURRENT RATIO:
Current Ratio measures firm’s Short –Term solvency. It
indicates the availability of current assets in rupees for
every one rupee of current liability.
Current Assets
Current Ratio =
Current Liabilities
11. Current ratio
Year Current Assets Current Liabilities Ratio
2012-13
12967.91 3130.66 4.14
2013-14
9021.46 3377.81 2.67
2014-15
8803.63 5421.75 1.62
12. Continue…….
ANALYSIS AND INTERPRETATION:
From the above table, it shows the decline trend during F.Y. 2012 to F.Y.2014.
It was high in F.Y.2012 at 4.14 times which further reduced to 1.62 times in F.Y.
2014 which is lower than standard i.e. 2:1.
In F.Y. 2012 the ratio was high due to the high Cash & Bank balance
which further reduced to 2.67 times in F.Y. 2013. In F.Y.2014 the ratio was very
low because of increase in Current Liability.
The continuous decrease in Current Ratio is not good for company’s
financial health. So company has to take necessary action to improve current
ratio.
13. QUICK RATIO:
Quick ratio is a test of liquidity than the current ratio.
The term liquidity refers to the ability of a firm to pay
its short-term obligations as & when they become due.
Quick Assets
Quick Ratio=
Quick Liabilities
14. Continue…..
Year Quick Asset Current Liabilities Ratio
2012
12675.22 3130.66 4.05
2013
8721.17 3377.81 2.59
2014
8362.95 5421.75 1.54
15. Continue…..
ANALYSIS AND INTERPRETATION:
The table shows continuous decline trend from F.Y.2012 to F.Y. 2013. The ratio is
above the standard i.e. 1:1. In F.Y. 2012 the ratio was high at 4.5 times due to
tremendous increase in Cash & Bank Balance which was25 times greater than
F.Y.2008, also in F.Y. 2012. Further it reduced to 1.54 times but we cannot say
that the liquid position of the company is good because in F.Y. 2014 company’s
Cash & bank balance and Debtors has increased.
Thus, the company can suffer the shortage of fund due to slow paying, doubtful
& long duration outstanding debtors.
16. PROPRIETOR RATIO:
It measures the relationship between funds invested in
business by the owners with the total fund invested in
business.
Proprietor’s Fund
Proprietor Ratio:
Total Asset
17. Continue…….
Year Proprietor’s Fund Total Asset Proprietor Ratio
2012
9339.24 18584.15 0.50
2013
11686.96 20,322.32 0.58
2014
11907.44 24,855.32 0.48
18. Continue…….
ANALYSIS AND INTERPRETATION:
The table shows fluctuation trend during the year. It
was high in F.Y. 2013which indicates that company is
less dependent on outside funds for working &
company is quite solvent. In F.Y. 2014 it dipped by 21 %
as compared to F.Y. 2008.
19. Debt-Equity Ratio:
Higher the ratio less secured is the creditors, lower
the ratio creditors enjoy higher degree of safety
Debt
Debt Equity Ratio:
Equity
20. Continue……
Year Debt Equity Debt-Equity Ratio
2012
9339.24 5858.32 1.59
2013
11686.96 4988.88 2.34
2014
11907.44 7332.18 1.62
21. continue
ANALYSIS AND INTERPRETATION:
At early stage i.e. in F.Y. 2012 it was low at 1.59 times which further
increased to 2.34 times in F.Y. 2013 and later on it further decreased
to 1.62 times.
The low ratio indicates that lenders contribution is lower
than owner’s contribution. But in FY 2013 the lenders contribution
is higher than owner’s contribution which indicates that Creditors
are less secured than shareholders of the company.
22. Gross Profit Ratio
It shows the operating efficiency of the business. It measures
the efficiency of production as well as pricing.
Gross Profit
Gross Profit Ratio = X100
Sales
23. Continue……
Year G/P Net Sales
Gross Profit Ratio
%
2012
872.37 3610.95 24.16
2013
1151.70 4419.87 26.06
2014
1193.43 7183.10 16.61
24. Net Profit Ratio:
It shows the overall efficiency of the business. Higher the
ratio indicates higher efficiency of business and better
utilization of total resources
Net profit after tax
Net Profit Ratio: X 100
Sales
25. Continue………
Year N/P Net Sales
Net Profit Ratio
%
2012
801.45 3610.95 22.19
2013
1084.63 4419.87 15.01
2014
1138.88 7183.10 15.85
27. Continue……..
ANALYS IS AND INTERPRETATION
In FY 2012 & FY 2014 the G/P Ratio & Net Profit Ratio were
increased simultaneously. There was slightly difference
between them. But in FY 2013 the G/P increases at a faster
rate as compared to Net profit. This indicates that
operating expenses relative to sales have been increasing.
The increasing expenses should be identified & controlled.
28. Return On Investment:
It measures the overall performance of the company that is
utilization of total resources and funds available with the
company.
EBT But AT
Return On Investment: X100
Total Assets/ Liability
29. Continue……..
Year EBIT Total Assets
Return On Investment Ratio
(%)
2012
872.37 18584.63 4.69
2013
1151.70 20322.32 5.67
2014
1193.43 1193.43 4.80
30. Return On Net Worth
It measures the productivity of shareholders funds.
Higher the ratio indicates better utilization of
shareholders funds or higher productivity of owner’s
funds
Net Profit After Tax
Return On Net Worth: X100
Equity Shareholder Fund
31. Continue……
Year PAT Net Worth
Return On Net Worth
Ratio (%)
2012
801.45 9339.24 8.58
2013
1084.63 11686.96 9.28
2014
1138.88 11907.44 9.56
32. Other Ratio:
Interest Coverage Ratio:-
This ratio is used to test the firms Debt- Servicing
Capacity.
EBIT
Interest Coverage Ratio:
Interest
34. Continue…….
ANALYSIS AND INTERPRETATION:
The Interest Coverage Ratio shows the number of times the interest charges
are covered by funds that are ordinary available for their payment.
The above chart shows relative constant fluctuation because it was Rs.3.49 in
FY 2012 which further increased to Rs.3.73 in FY 2013 & 3.61 in FY 2014.
Too high ratio indicates the firm is very conservative in using debt & that is
not using credit to best advantage of shareholder. In R-INFRA the ratio is high
in FY 2013 i.e. Rs. 3.73 crores.
35. FINDINGS
There is continuous decrease in Current Ratio. Thus, it is
necessary to take corrective actions.
The company can suffer the shortage of fund due to slow
paying, doubtful & long duration outstanding debtors.
The lenders contribution is higher than owner’s
contribution which indicates that Creditors are less
secured than shareholders of the company.
The operating expenses relative to sales have been
increasing.
36. Continue………
Proprietary ratio of the company fluctuates during the
period of study. It shows the change in the value of
reserves and surplus in the form of shareholders’ fund.
R-INRA is far better in covering its fixed cost with the
interest coverage ratio.
The overall financial condition of R-INFRA is good.
37. CONCLUSION
The R-INFRA’s overall position is at a good position. Particularly the
current year’s position is well due to raise in the profit level from the
last year position. It is better for the organization to diversify the funds
to different sectors in the present market scenario.