Downloaded 251 times
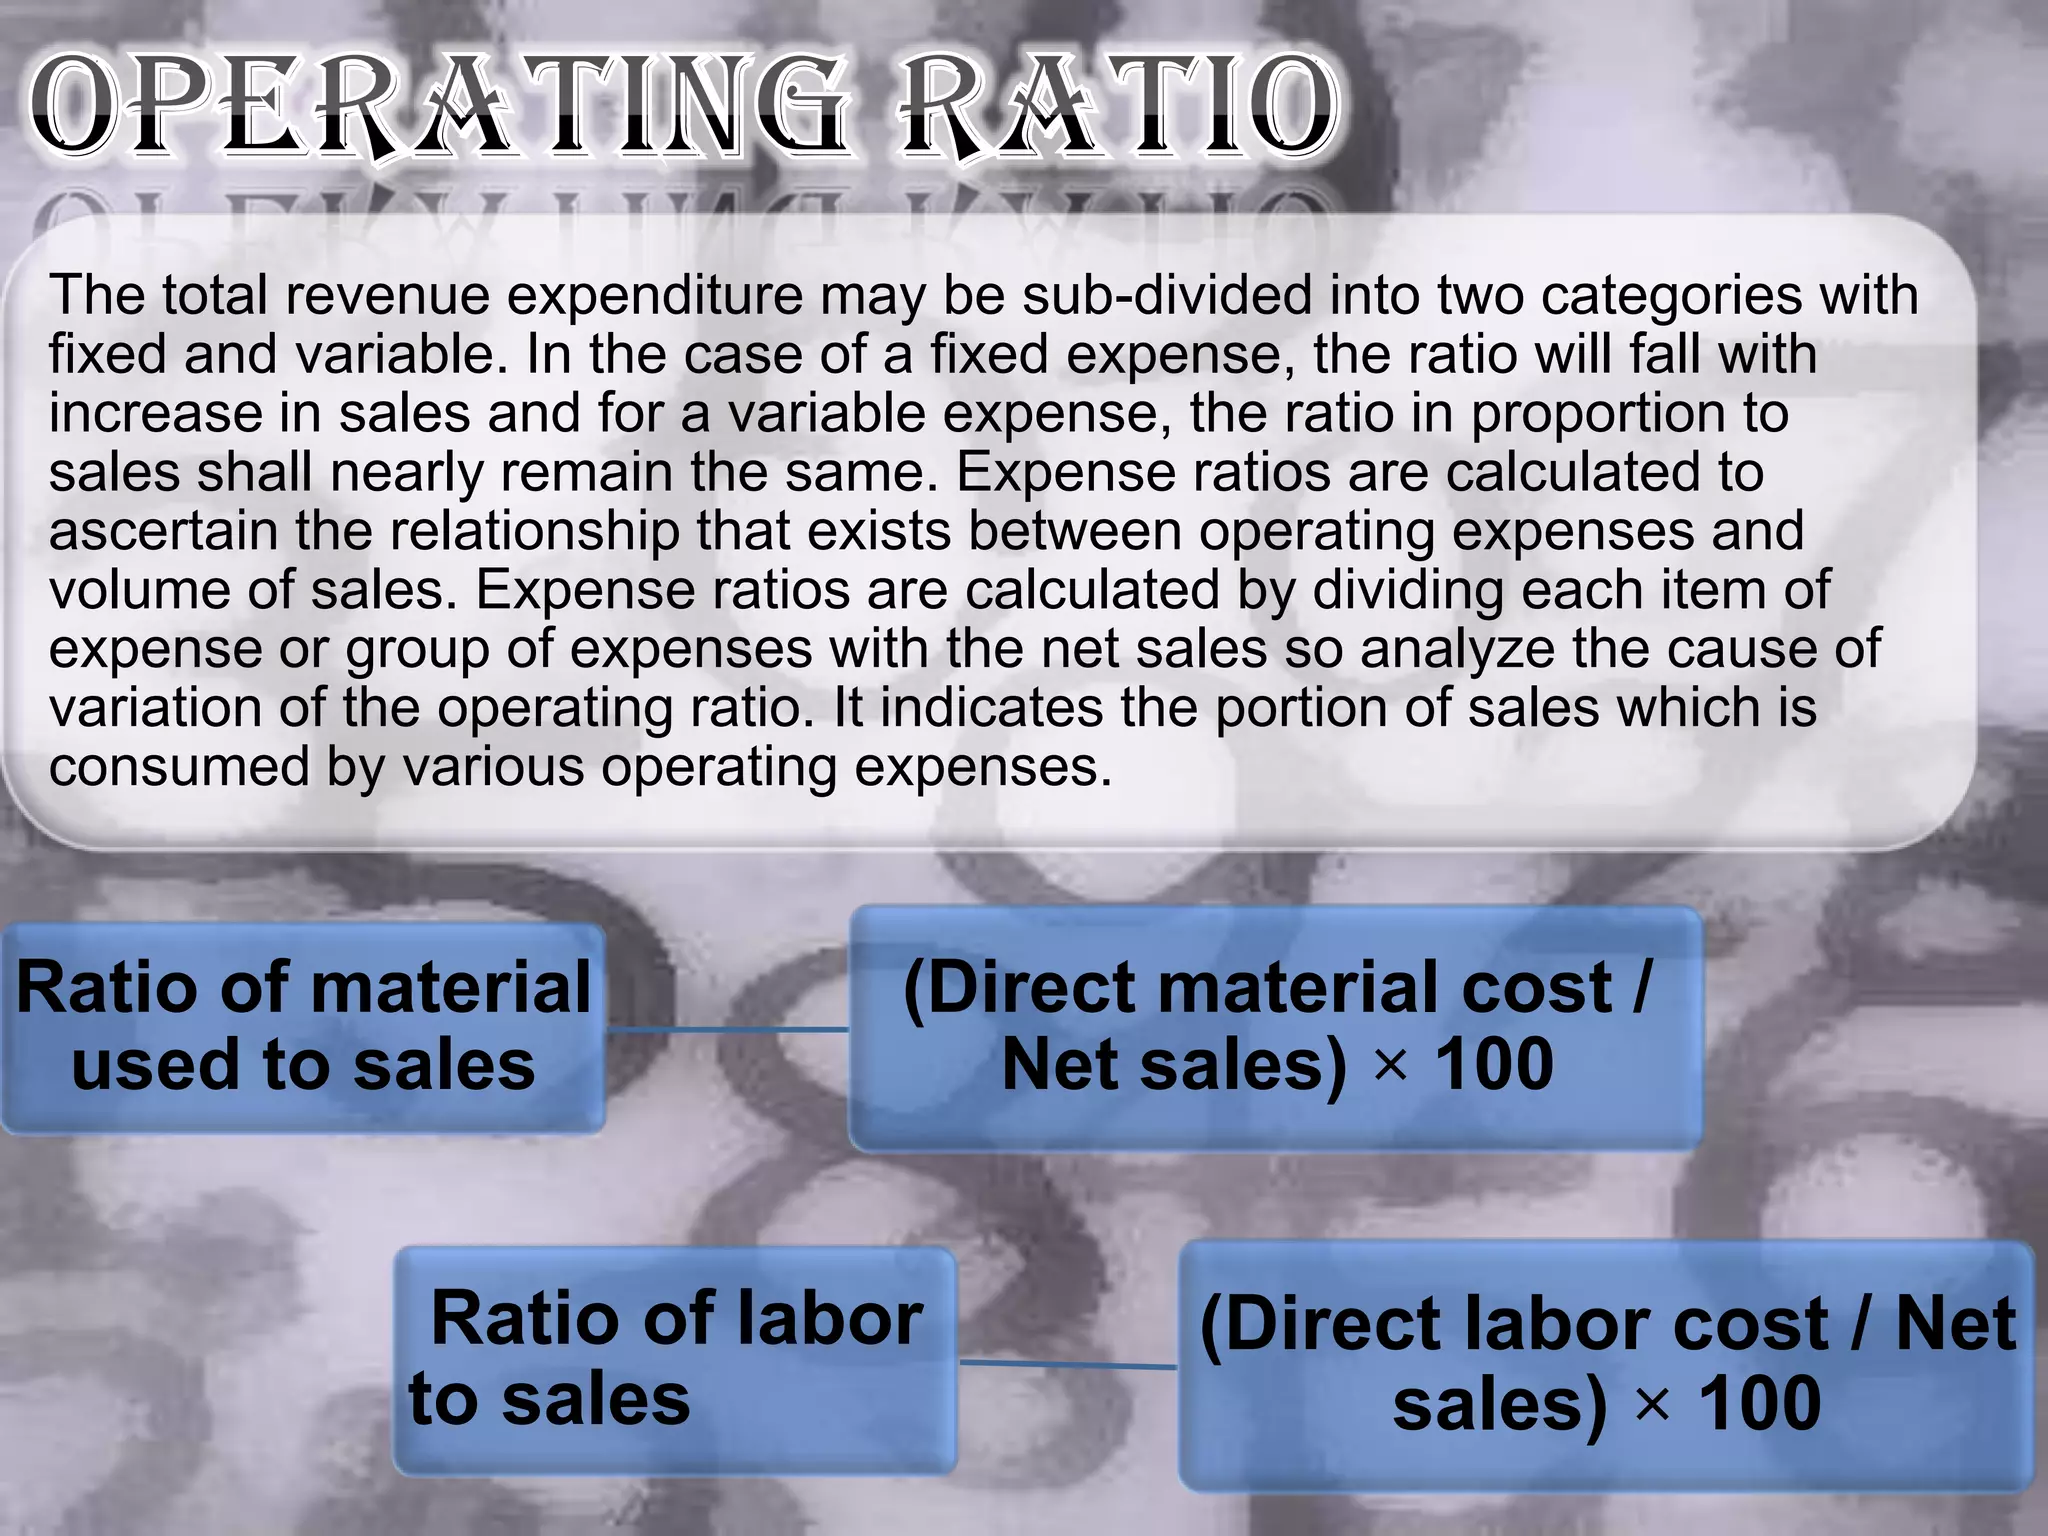
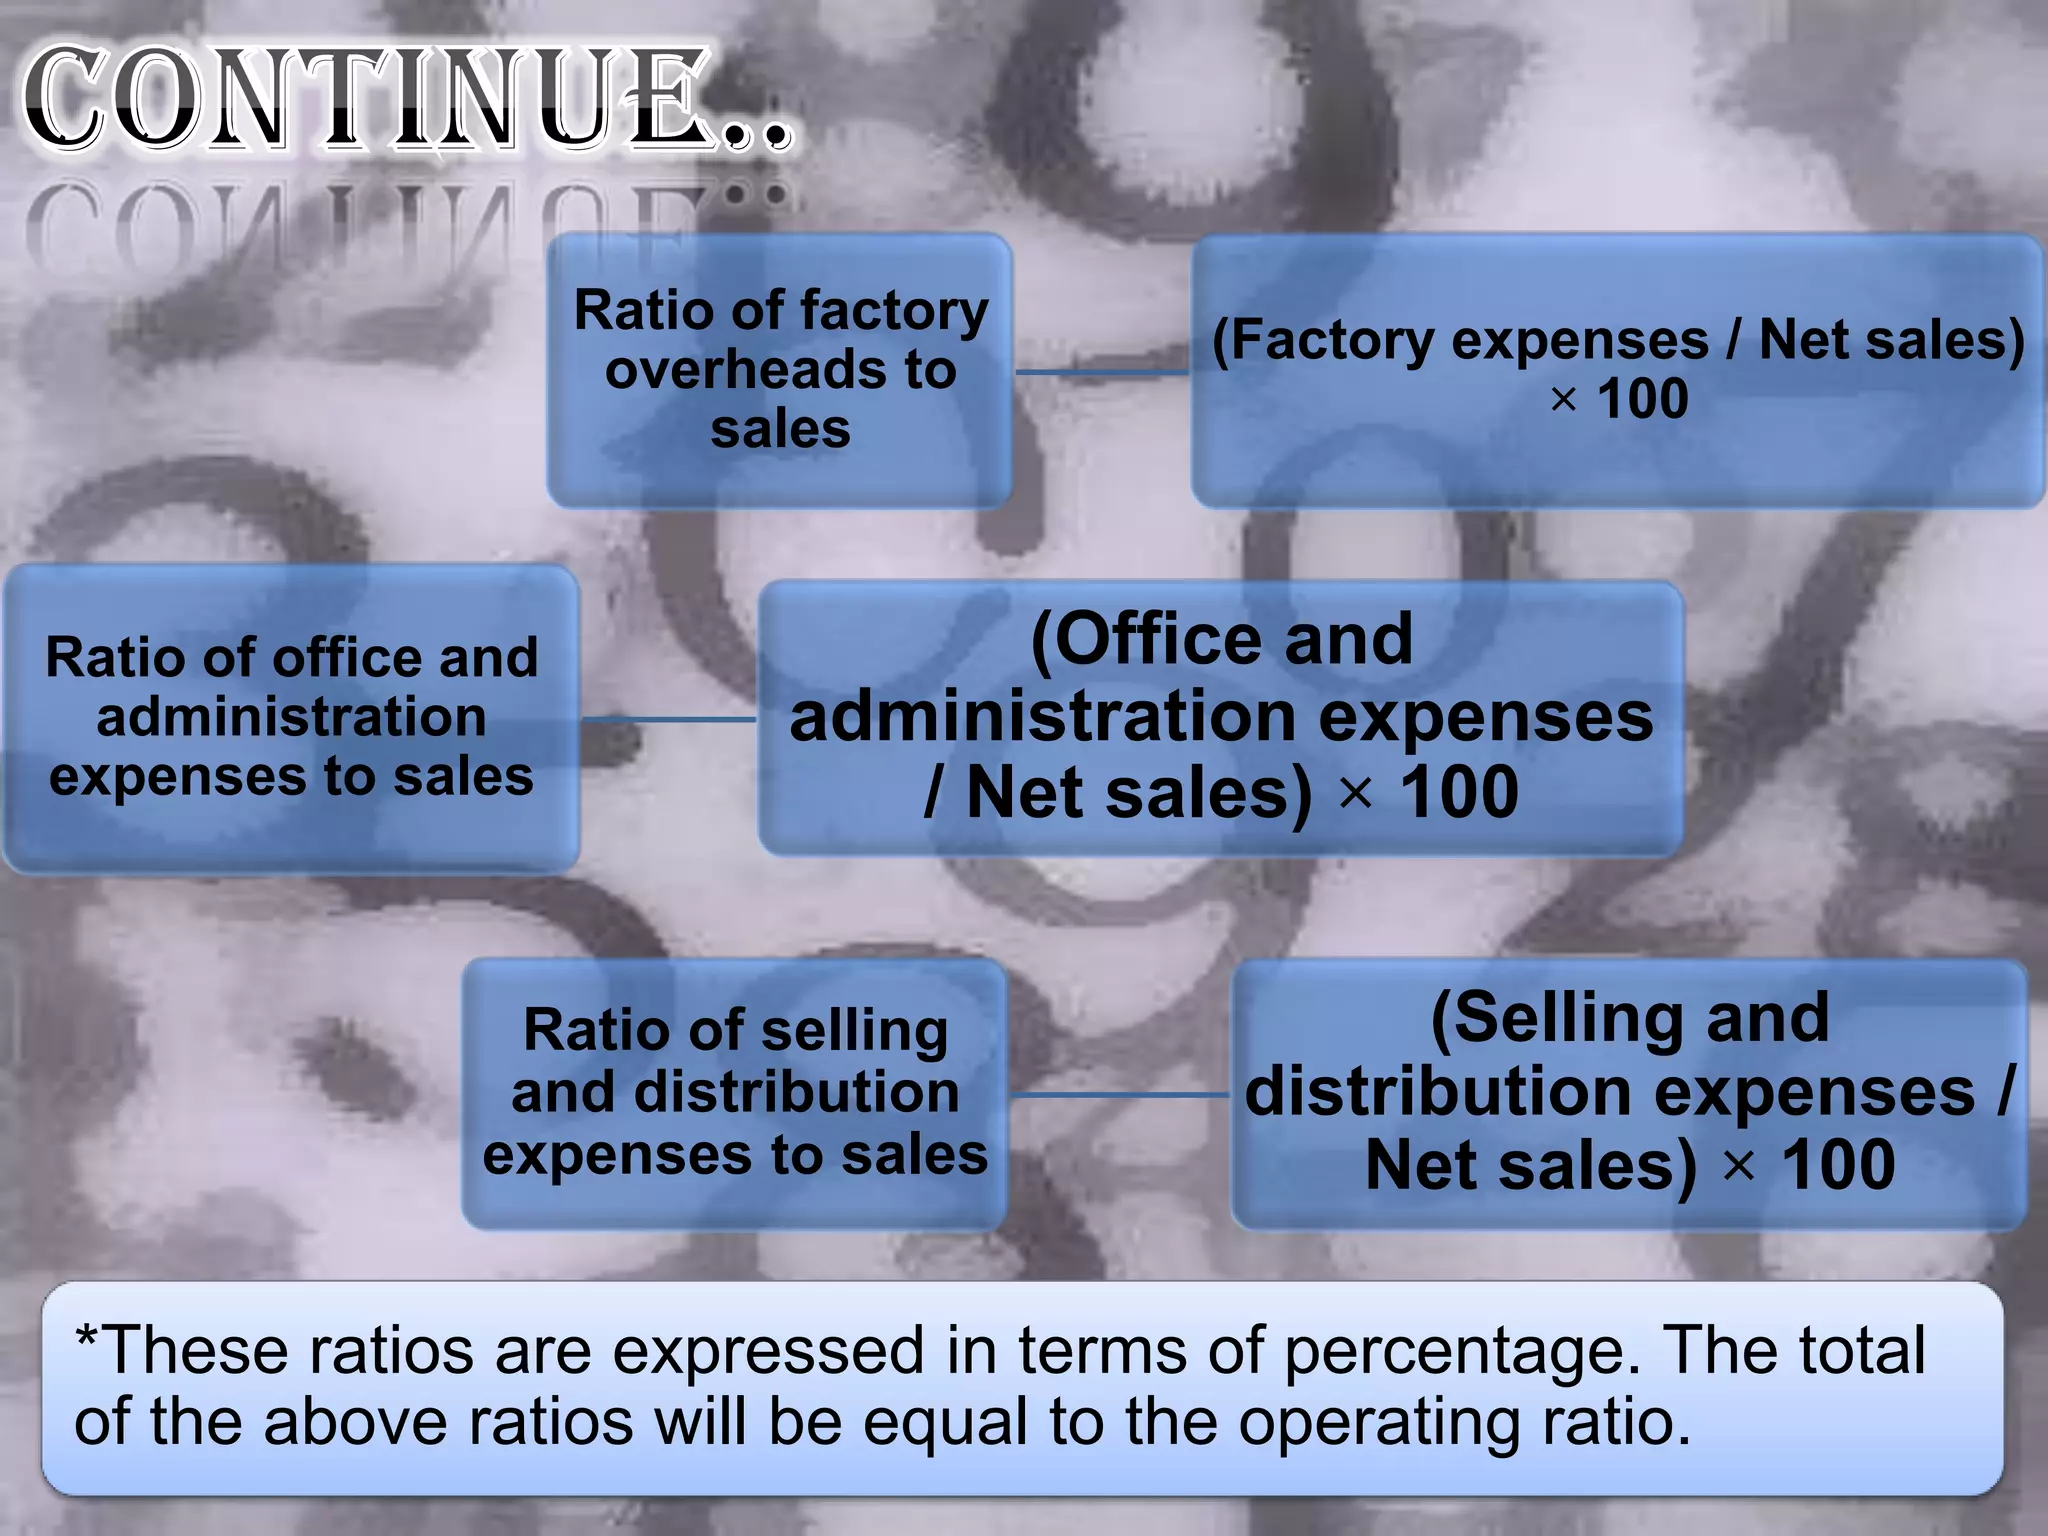
![The operating ratio is determined by
comparing the cost of the goods sold
and other operating expenses with net
sales.
Operating Ratio = [(Cost of goods
Formula for sold + Operating expenses /
Operating Ratio Net sates)] × 100 OR Net sales -
Gross profit
*Here cost of goods sold = Operating stock + Net purchases + Manufacturing
expenses - Closing stock
*Operating expenses = Office and administrative expenses + Selling and
distribution expenses](https://image.slidesharecdn.com/ratioanalysis-120305054250-phpapp01/75/Ratio-analysis-11-2048.jpg)
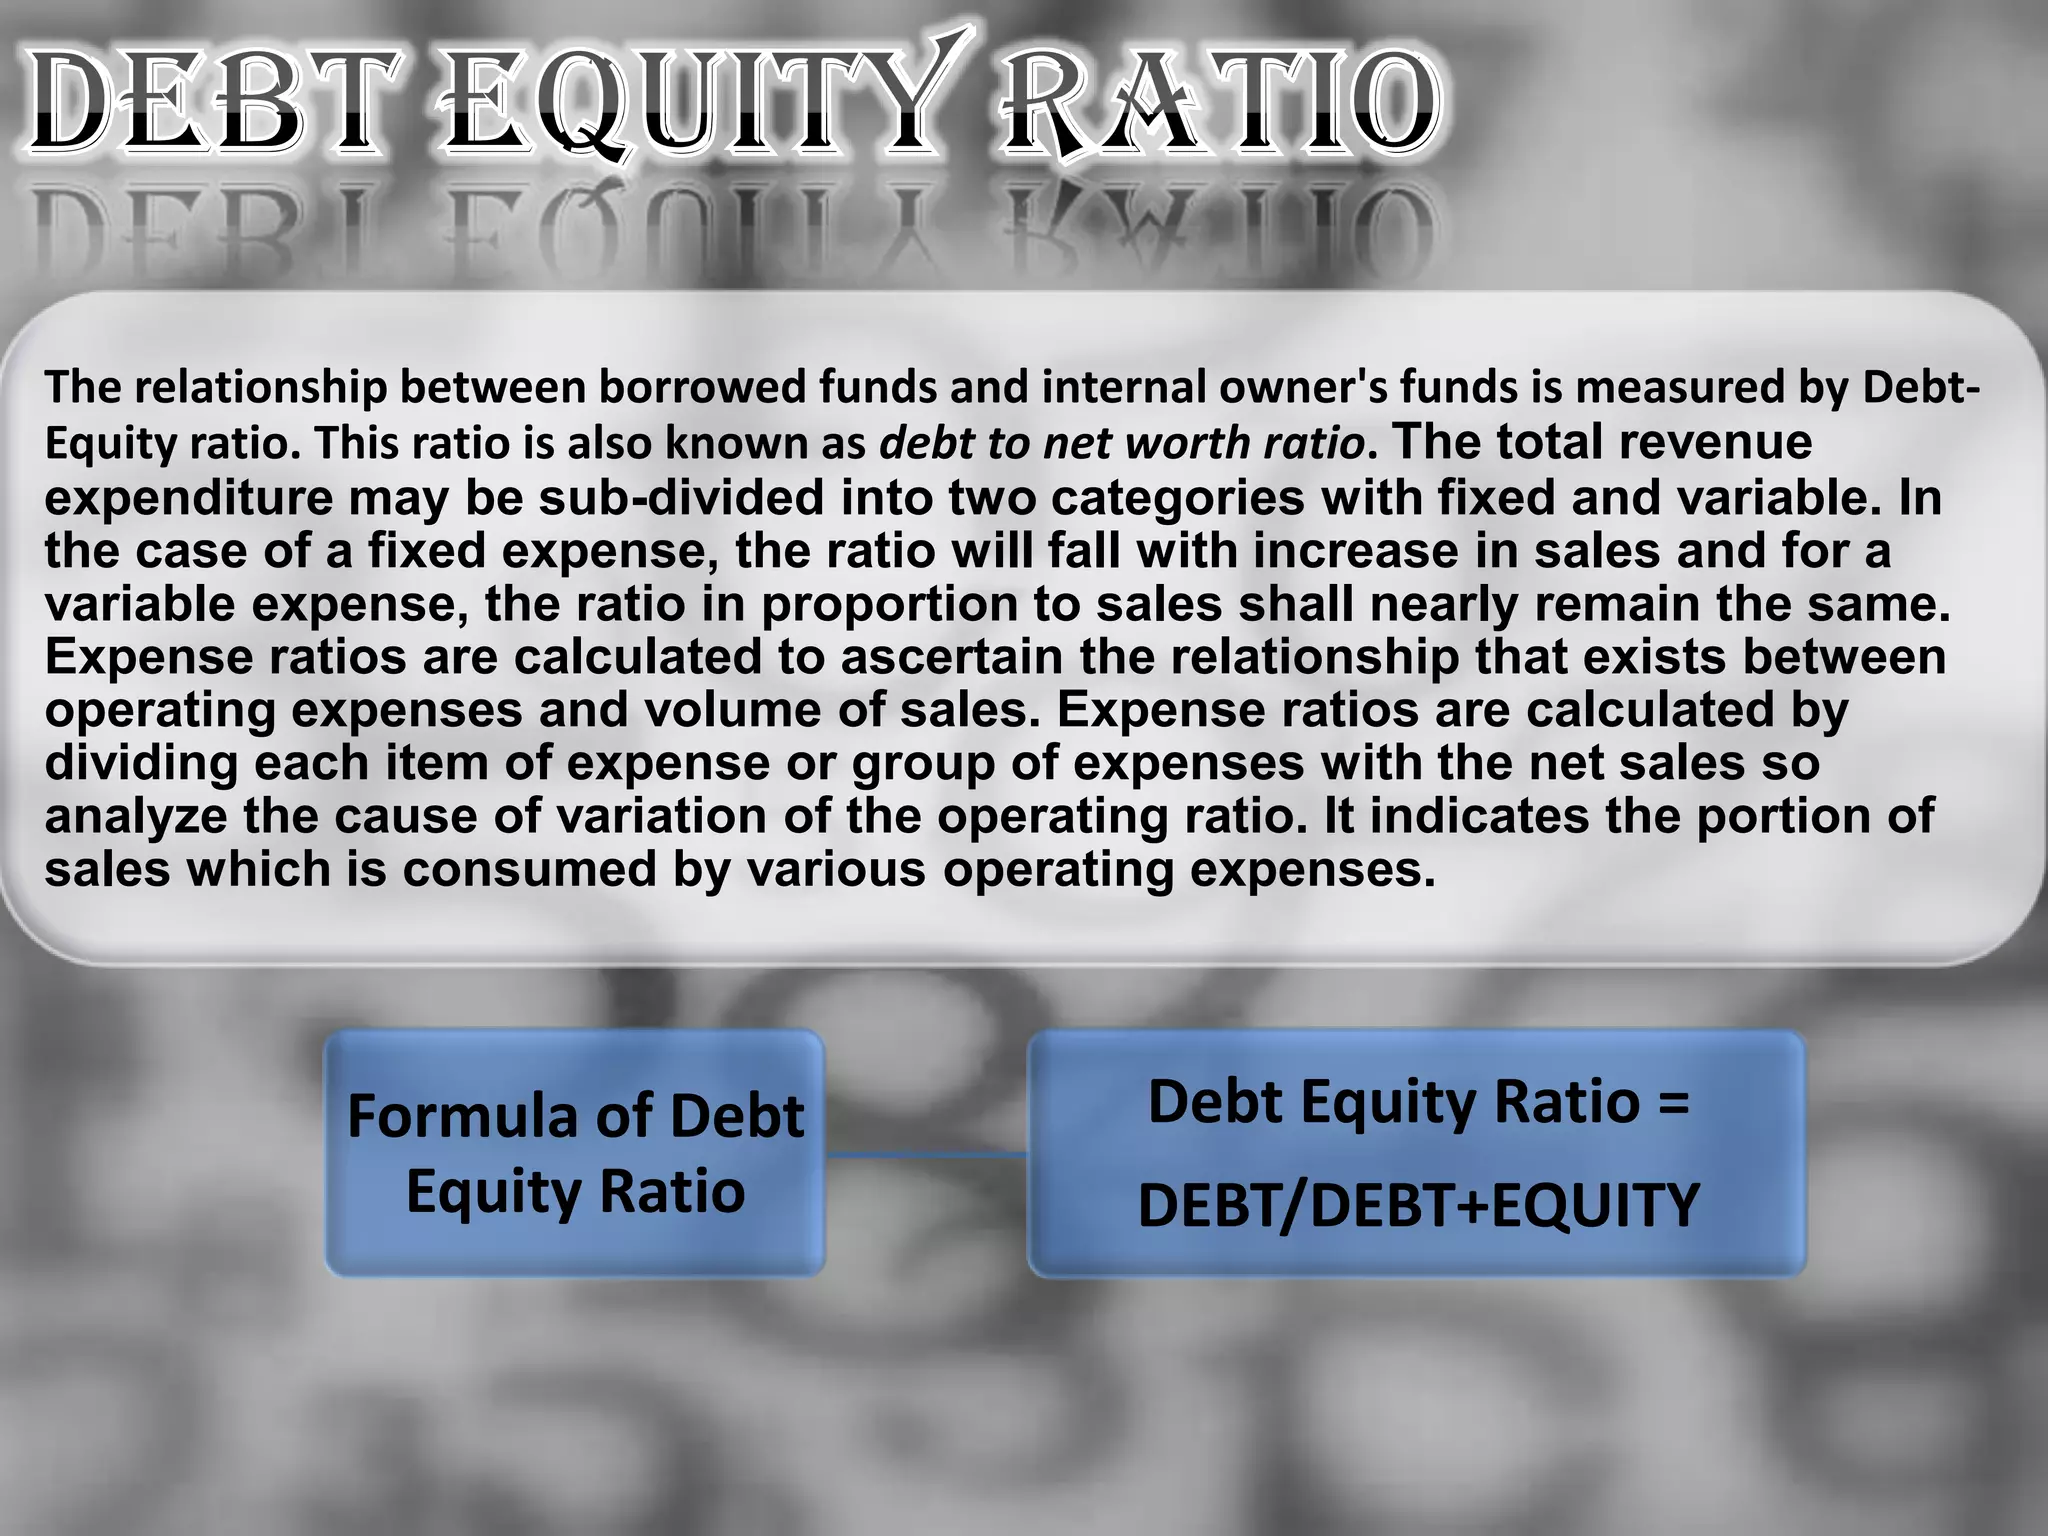
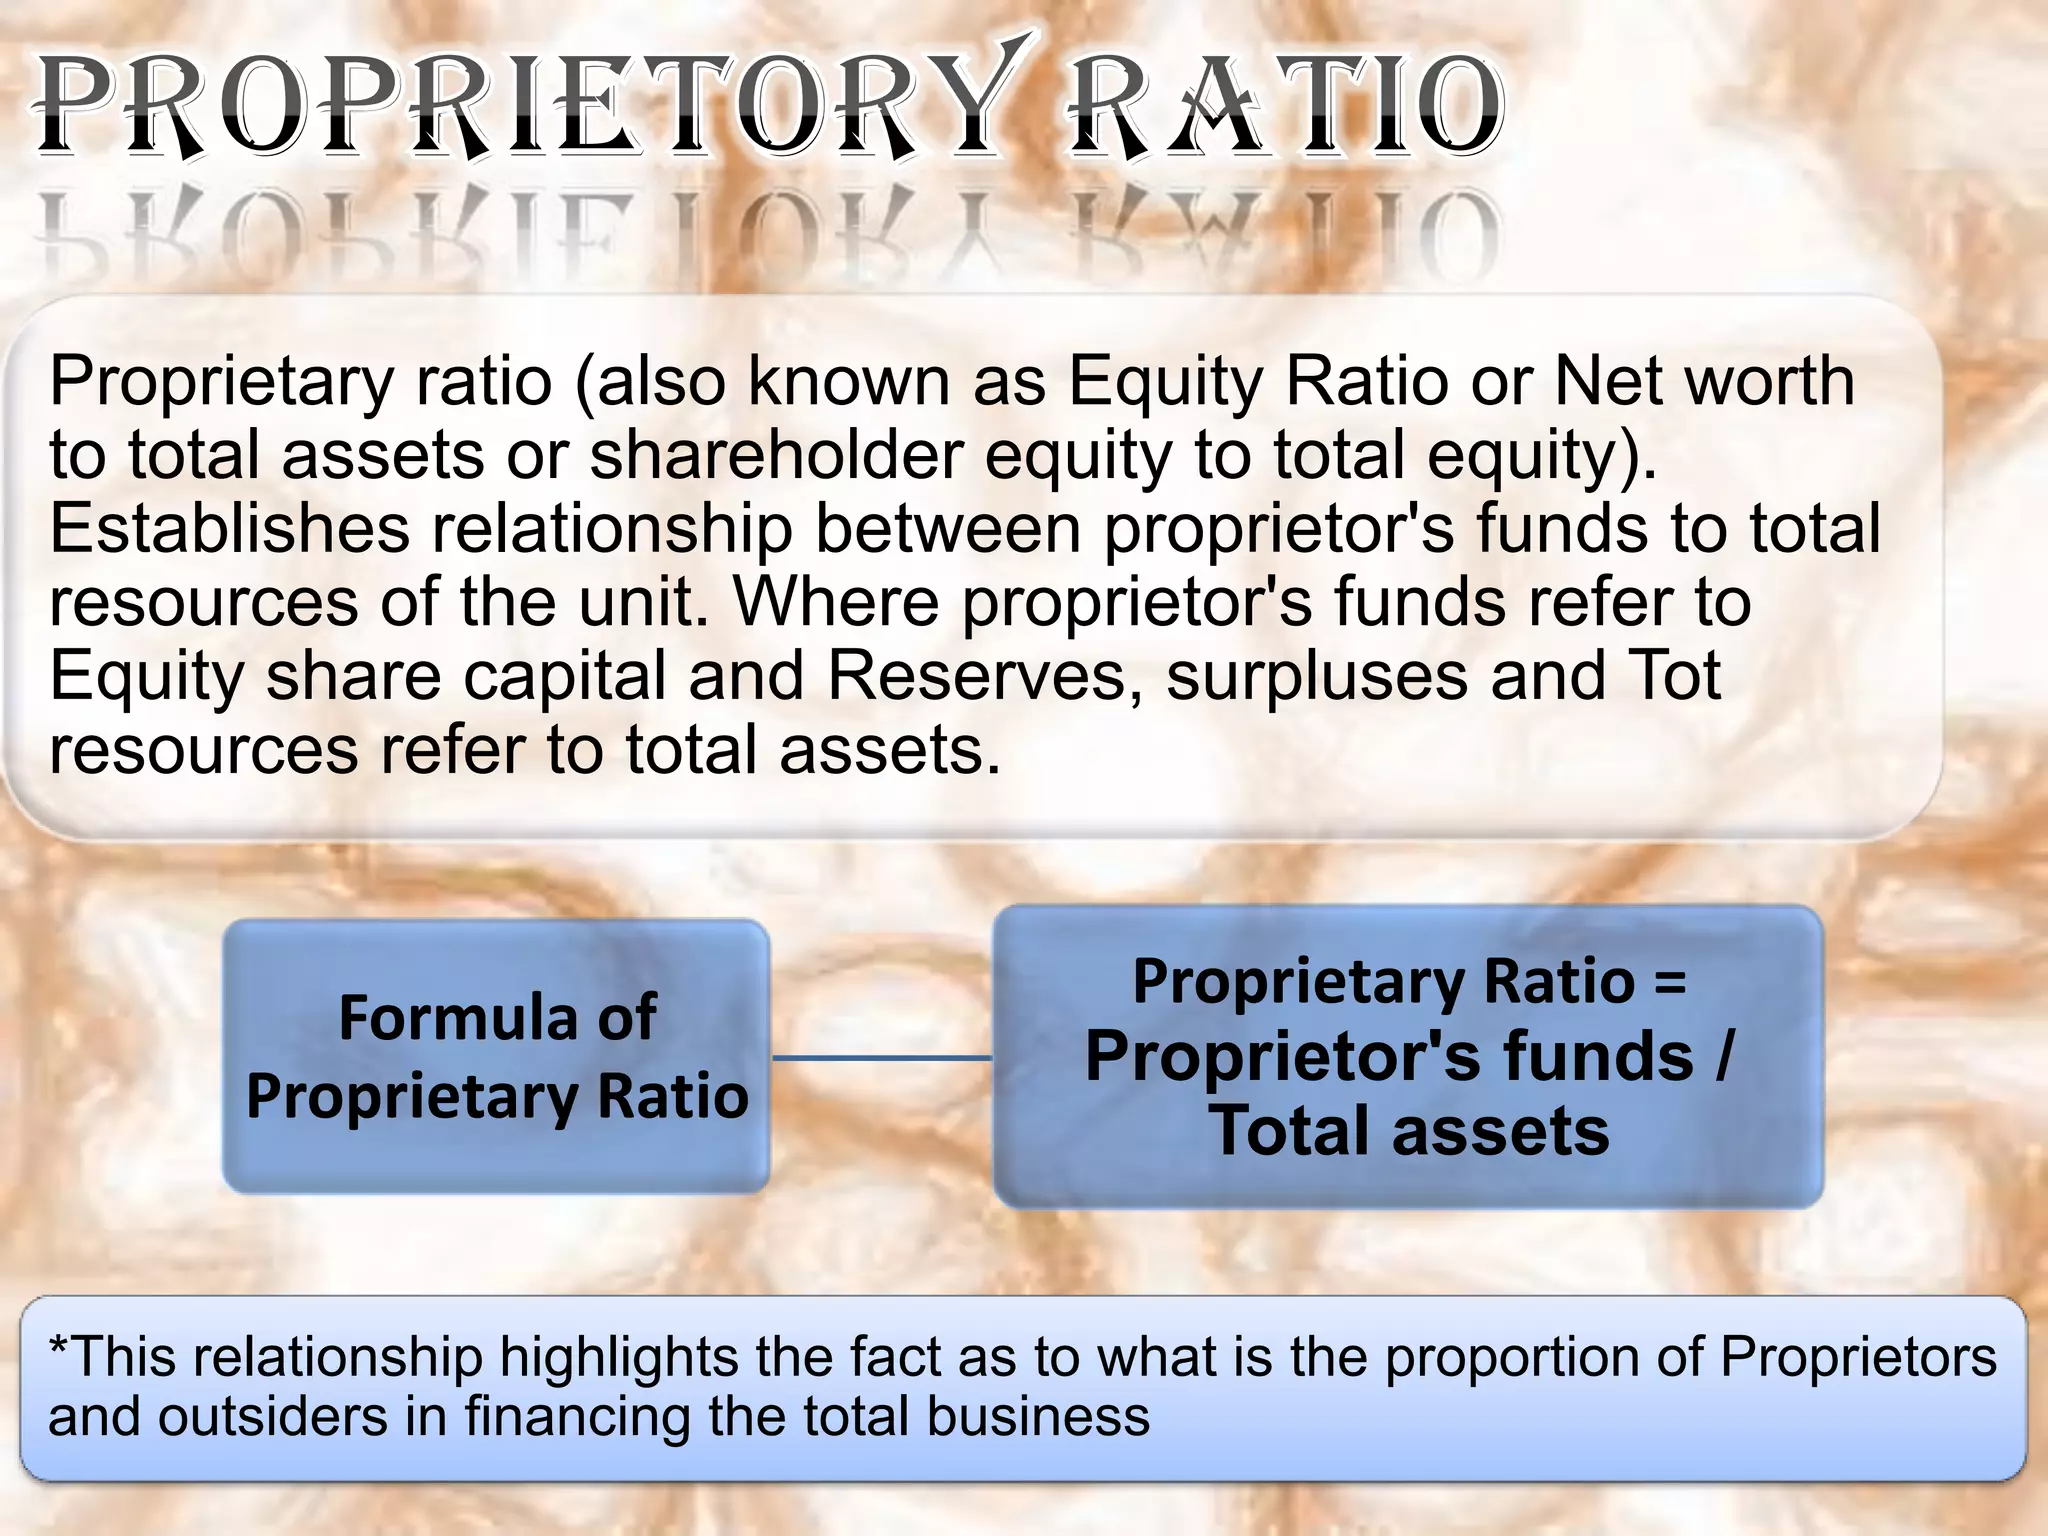
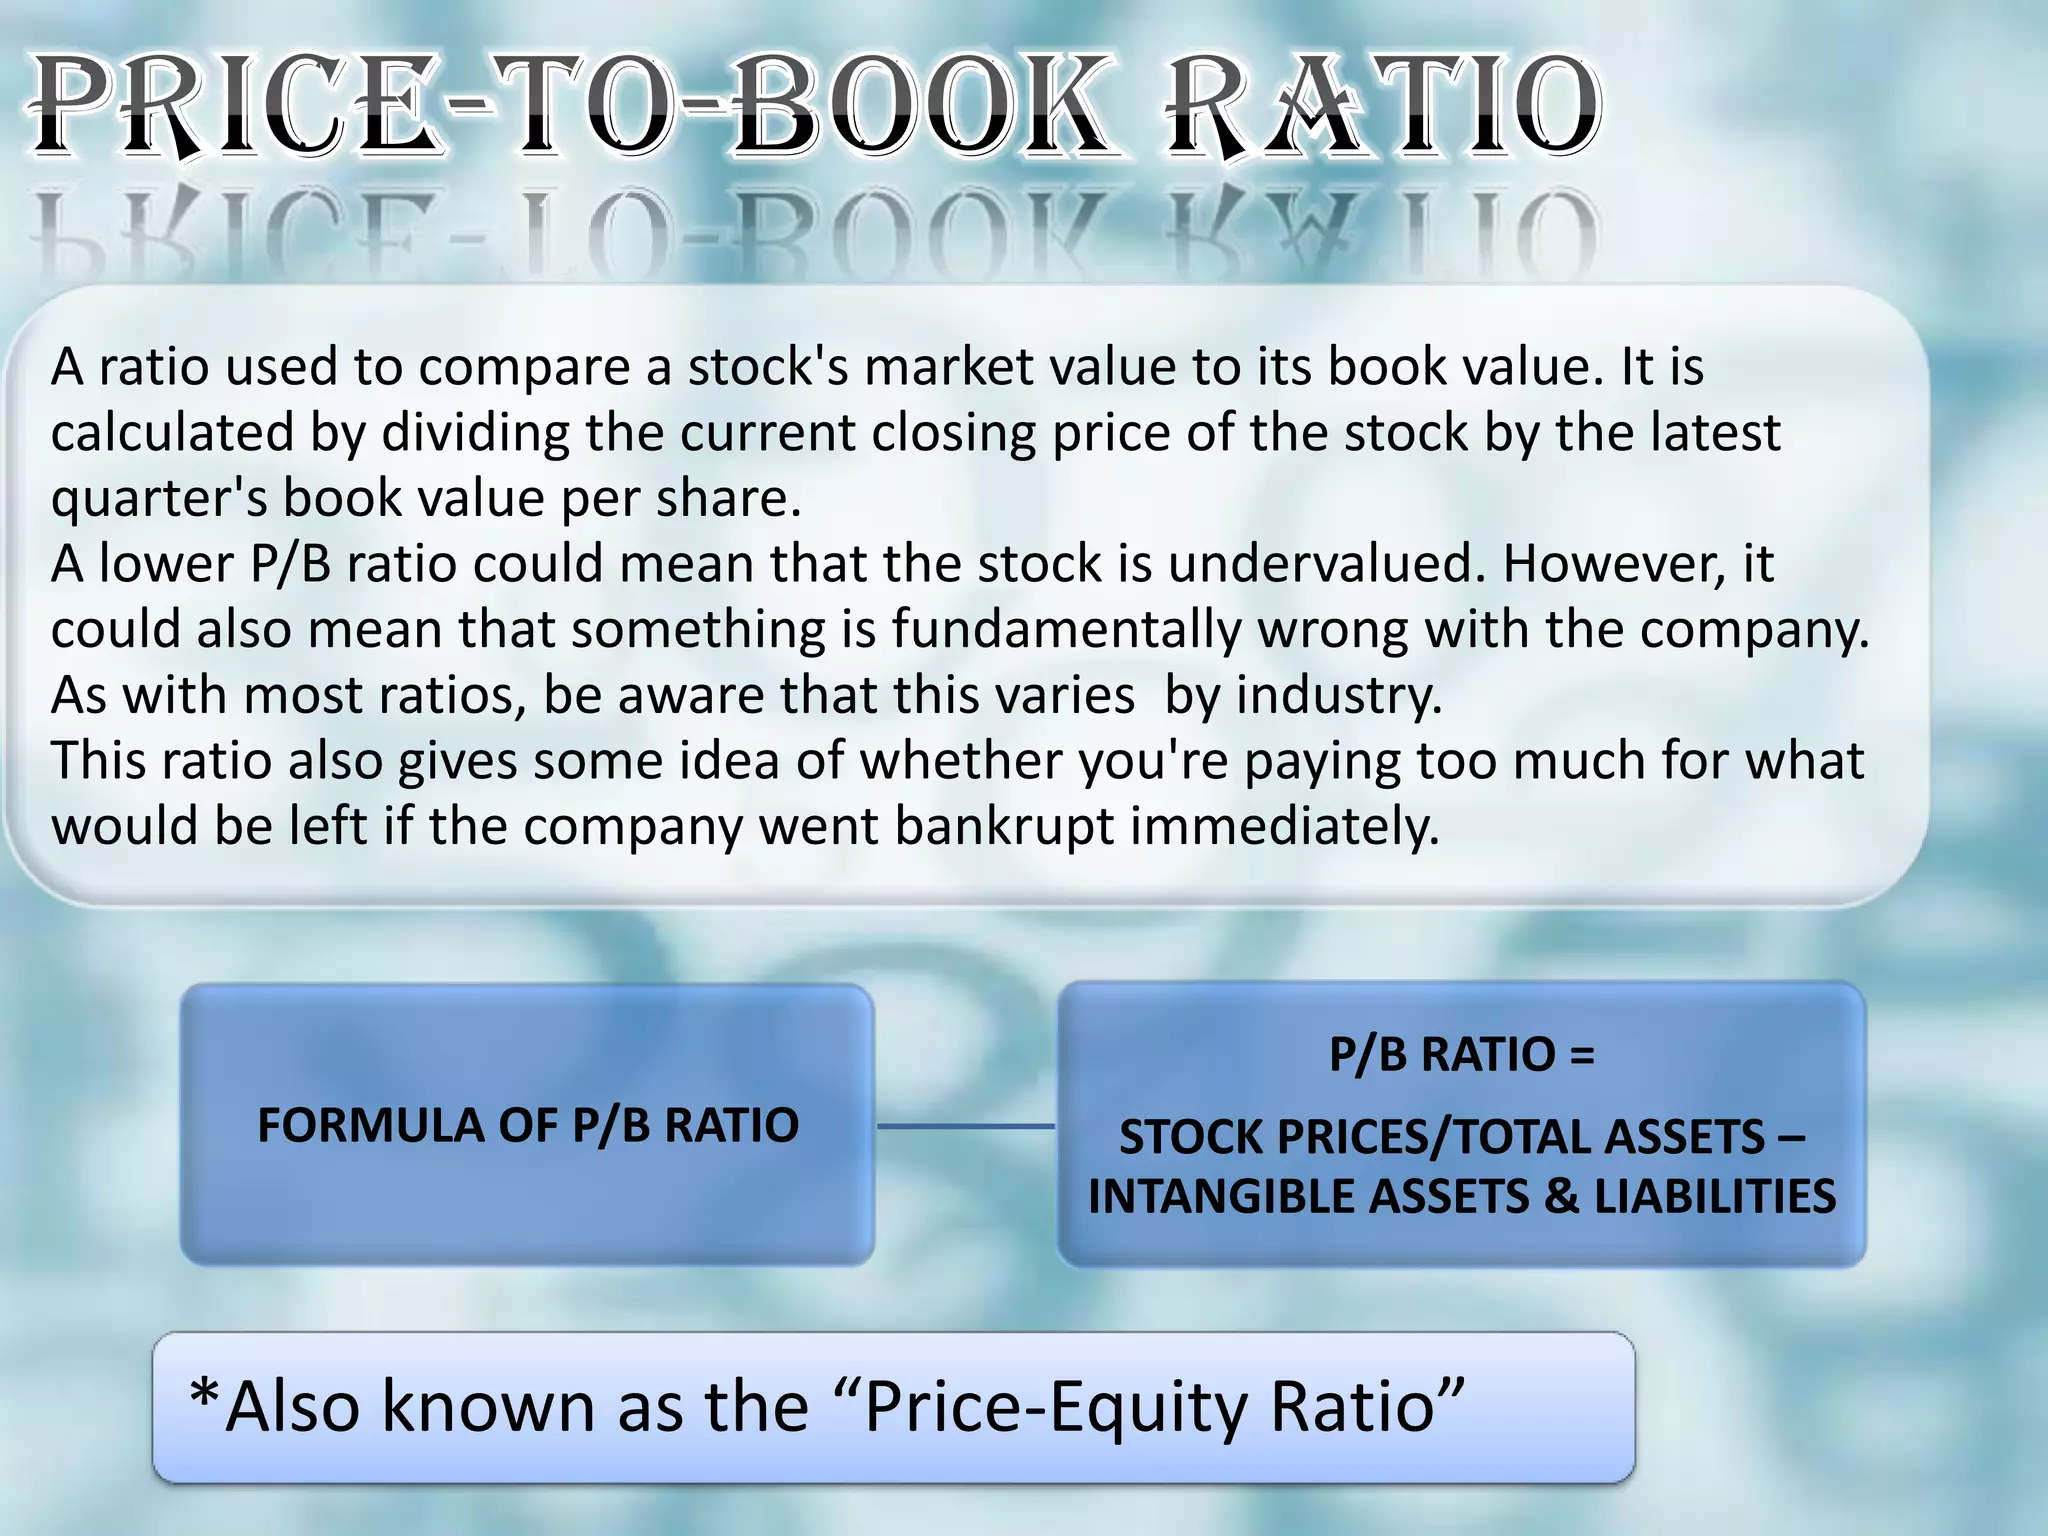


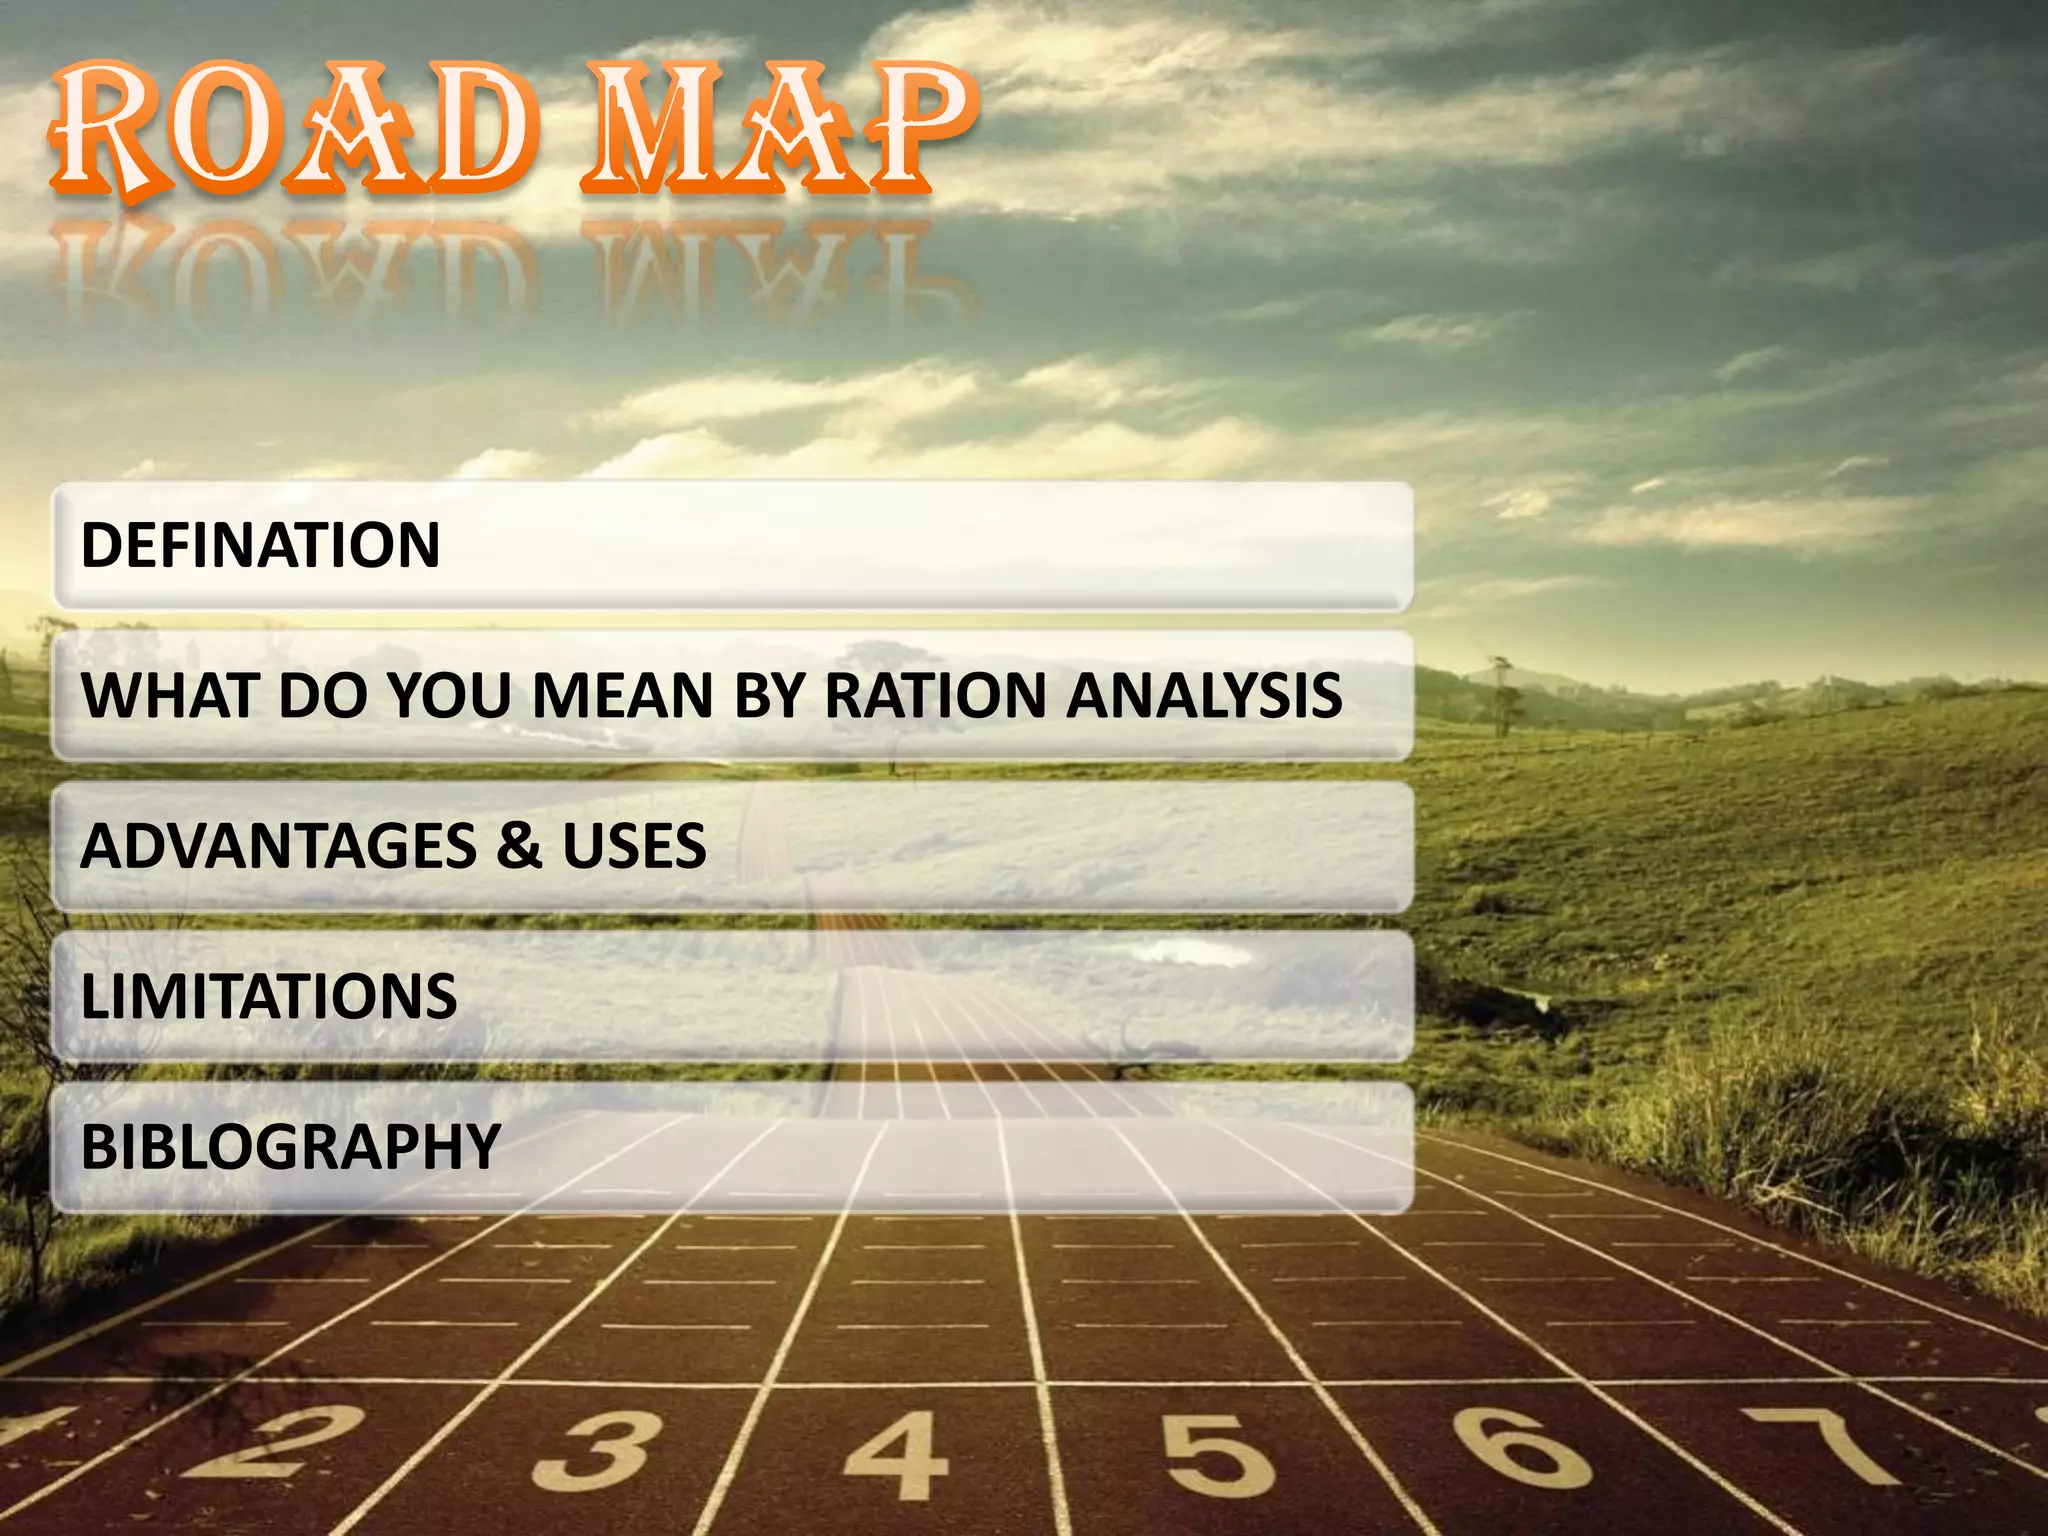
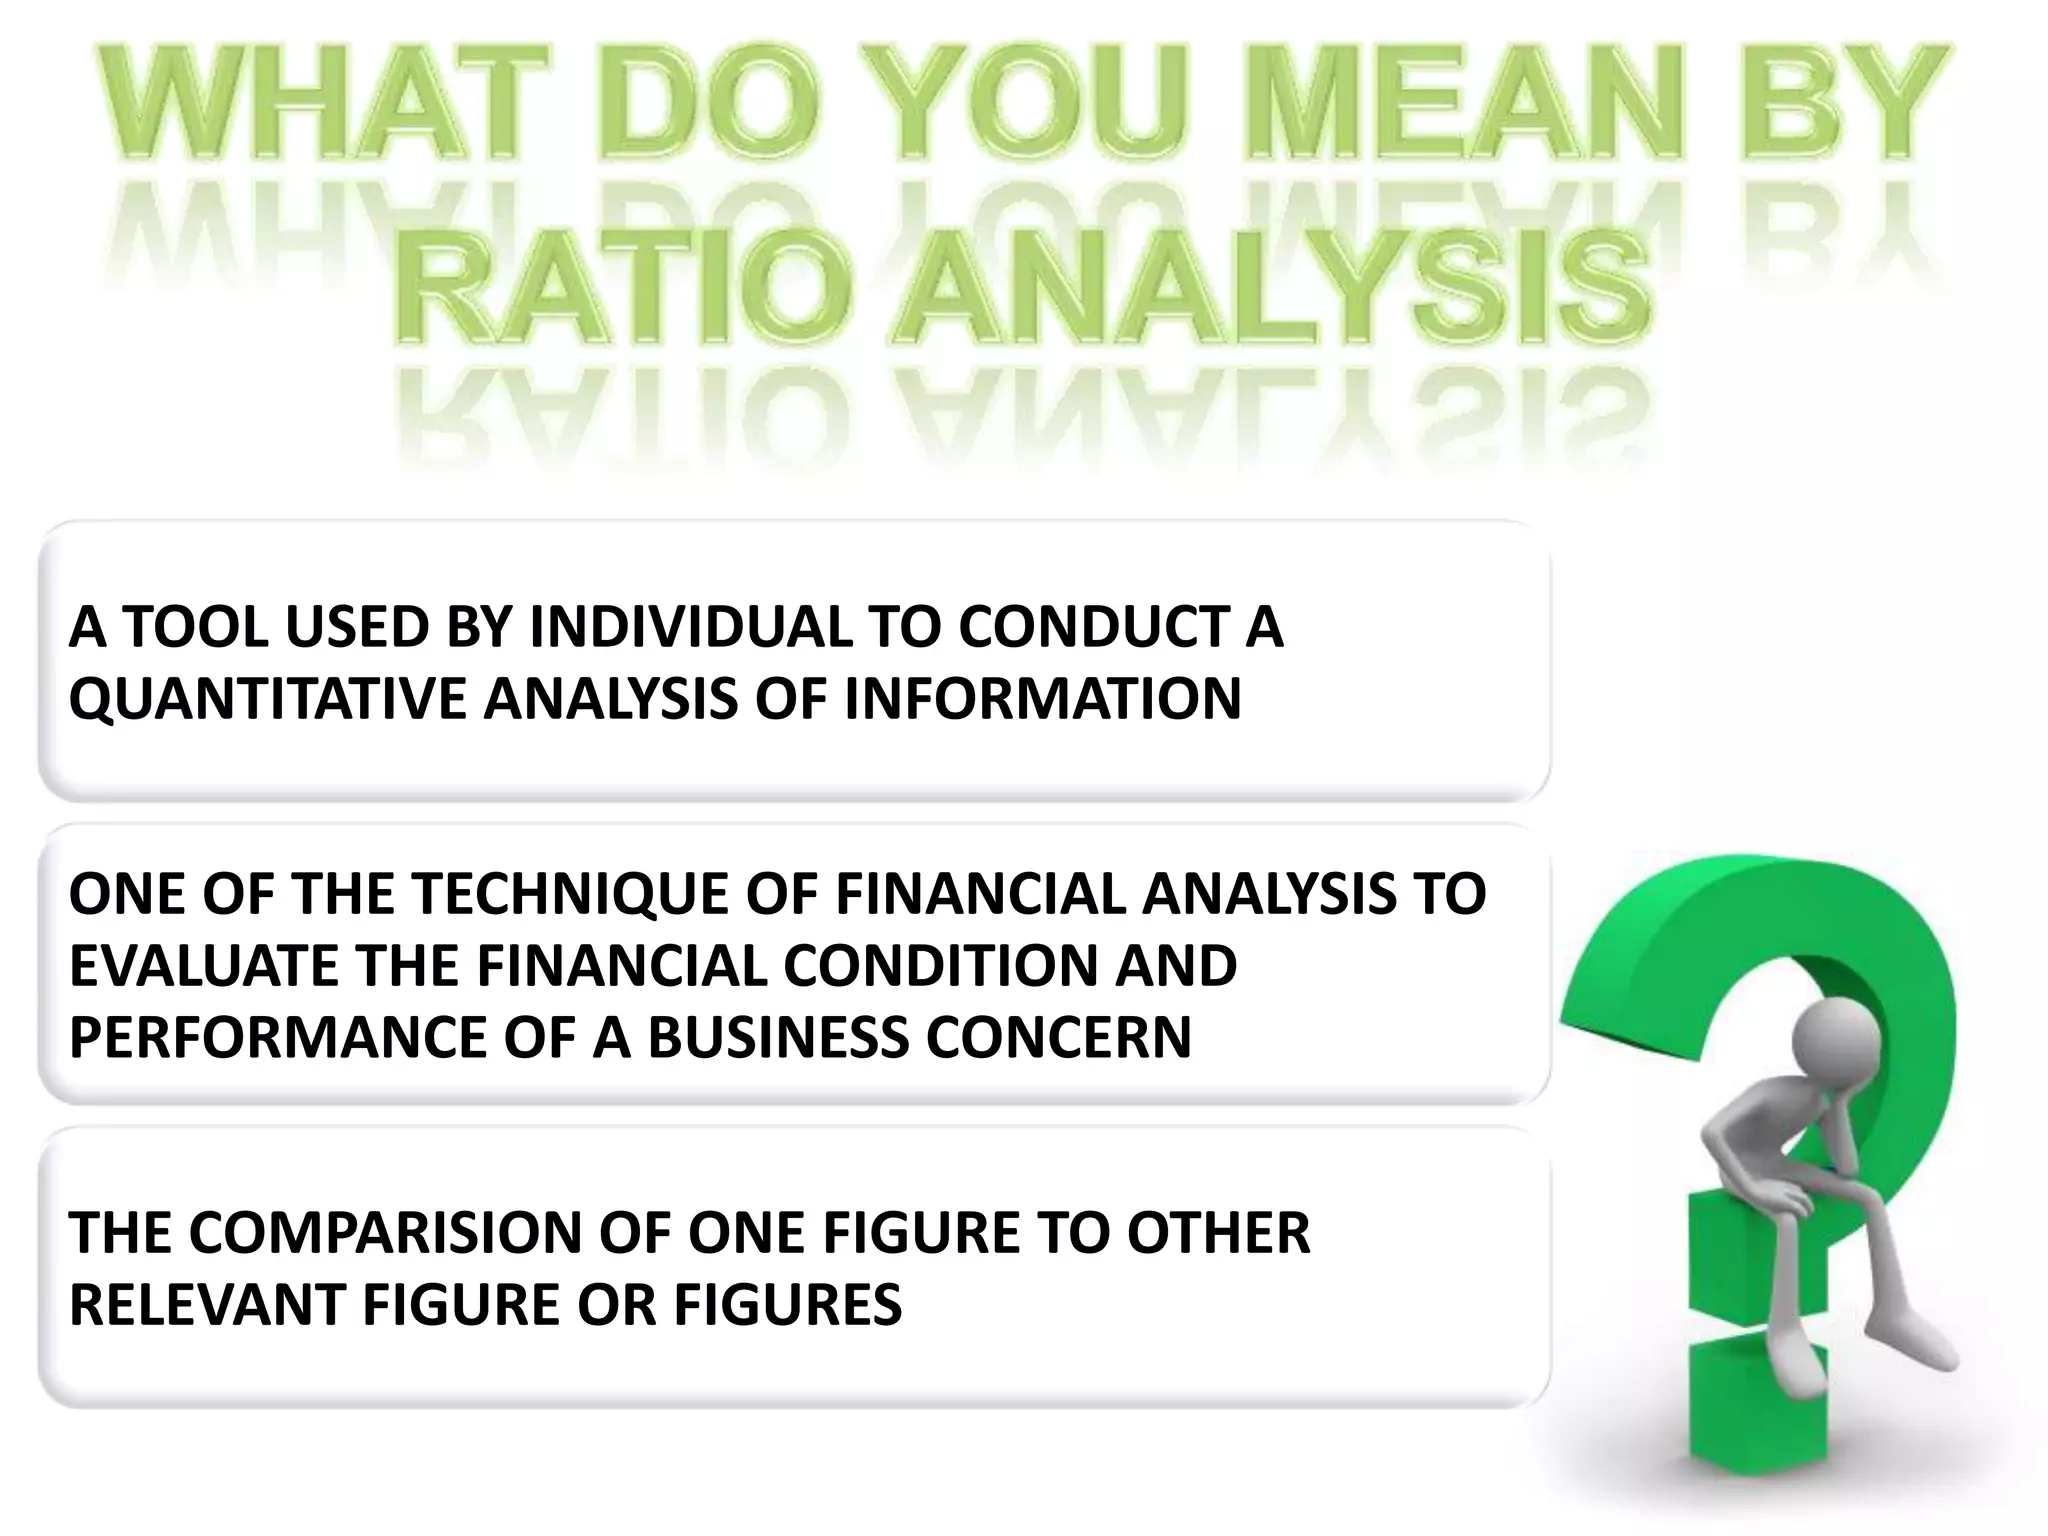
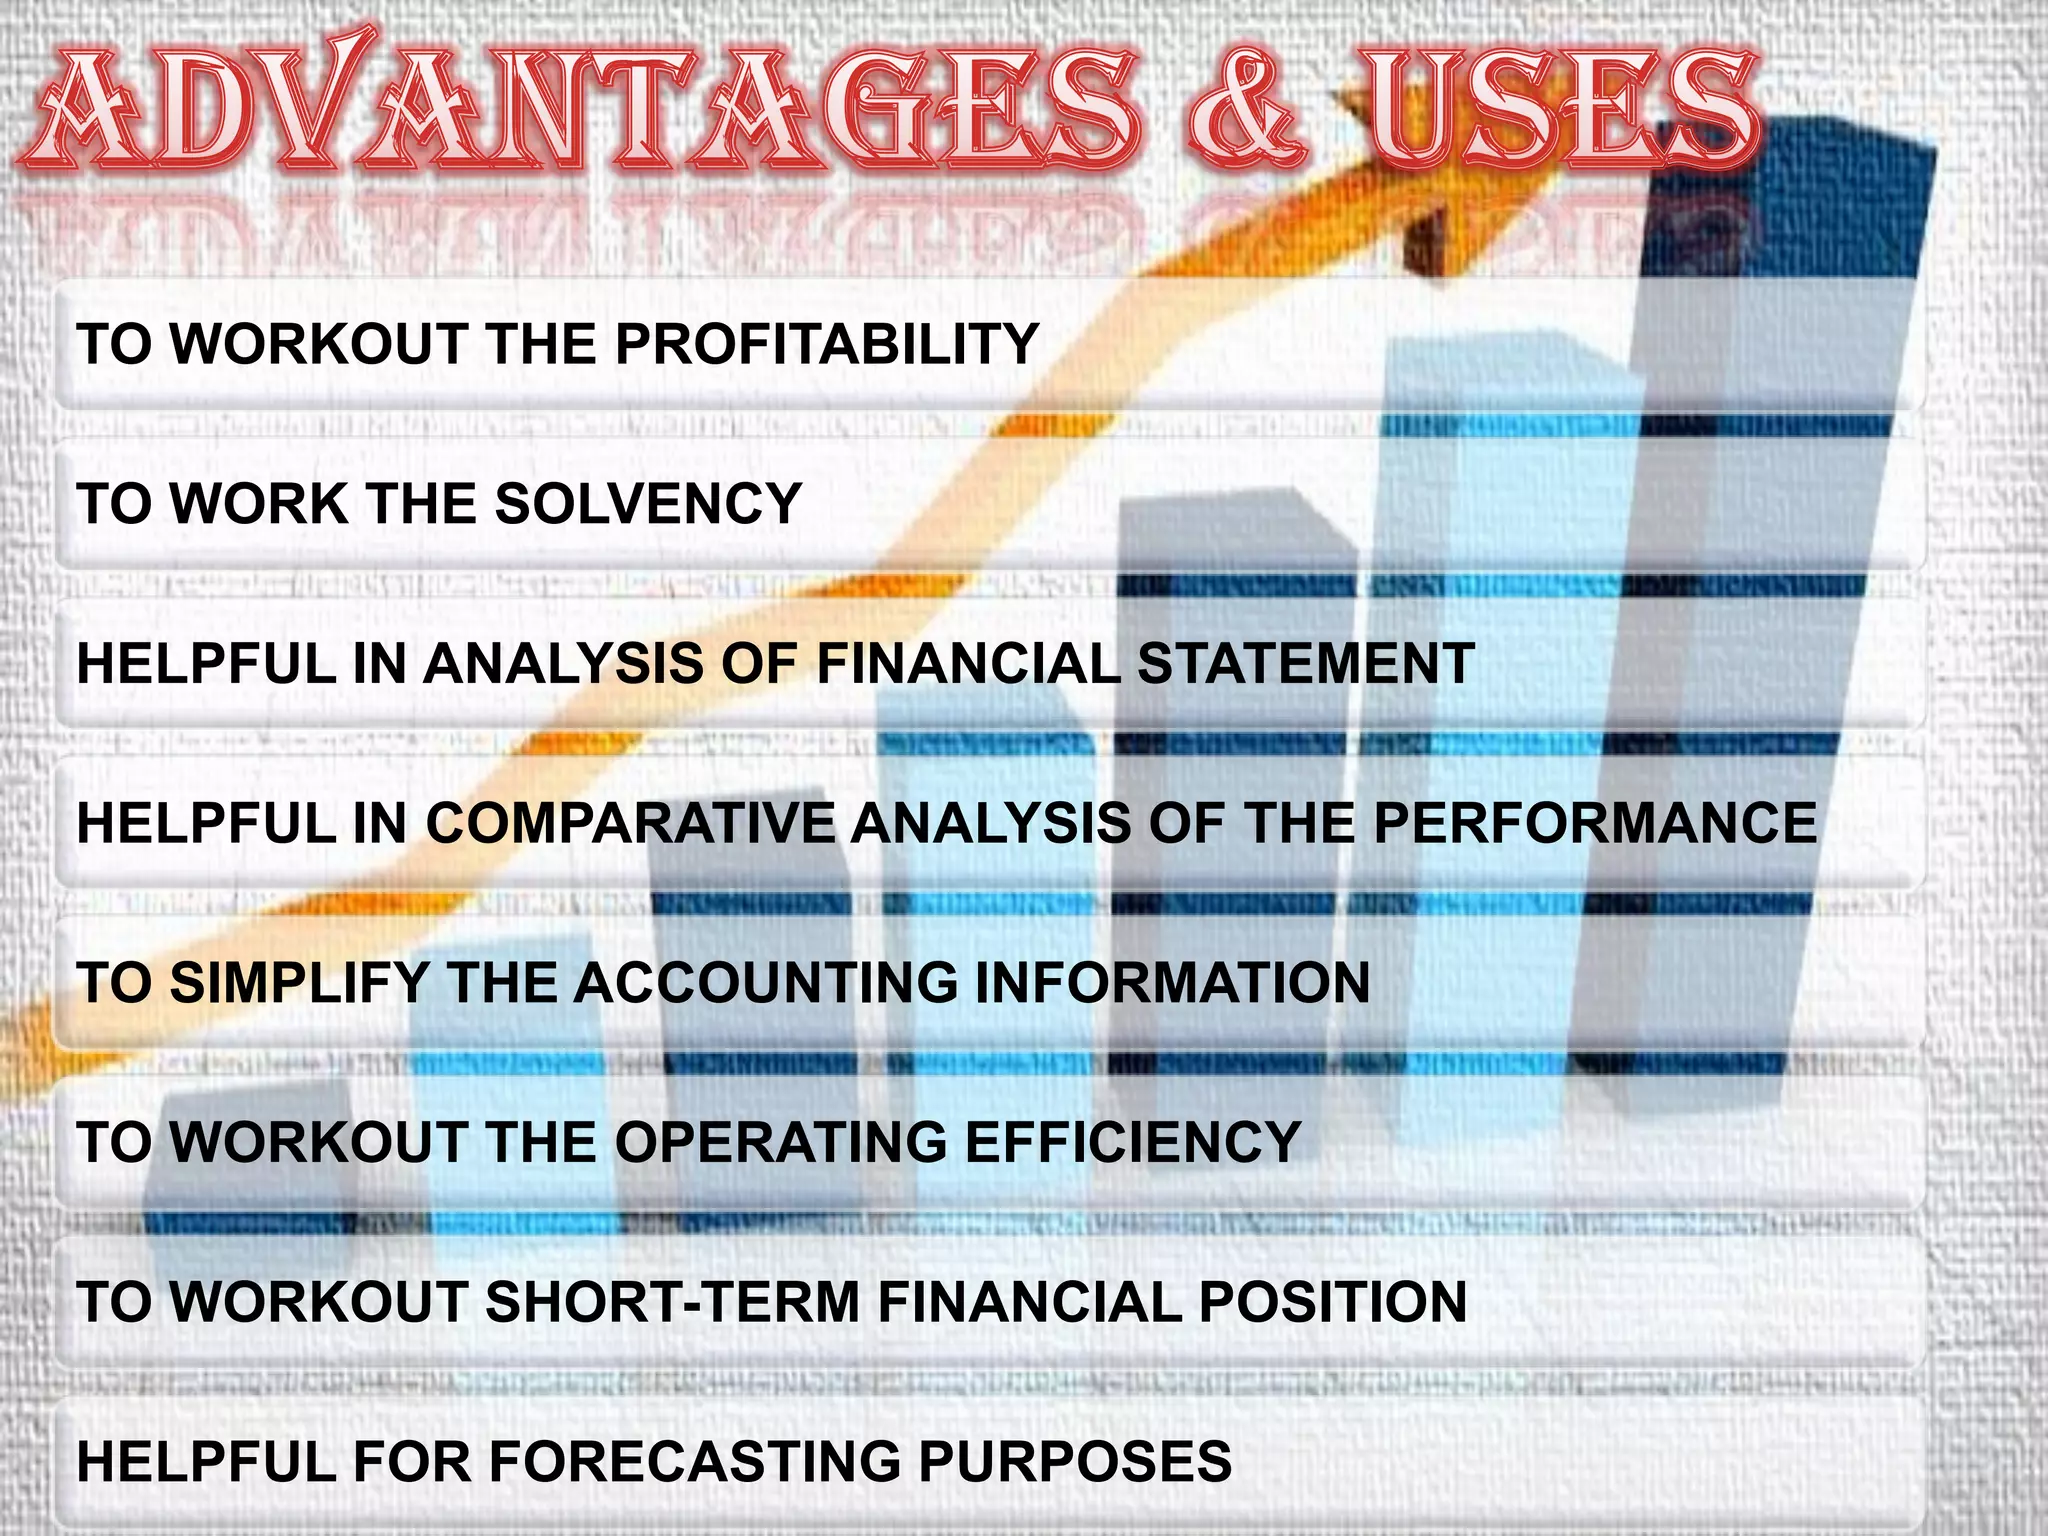
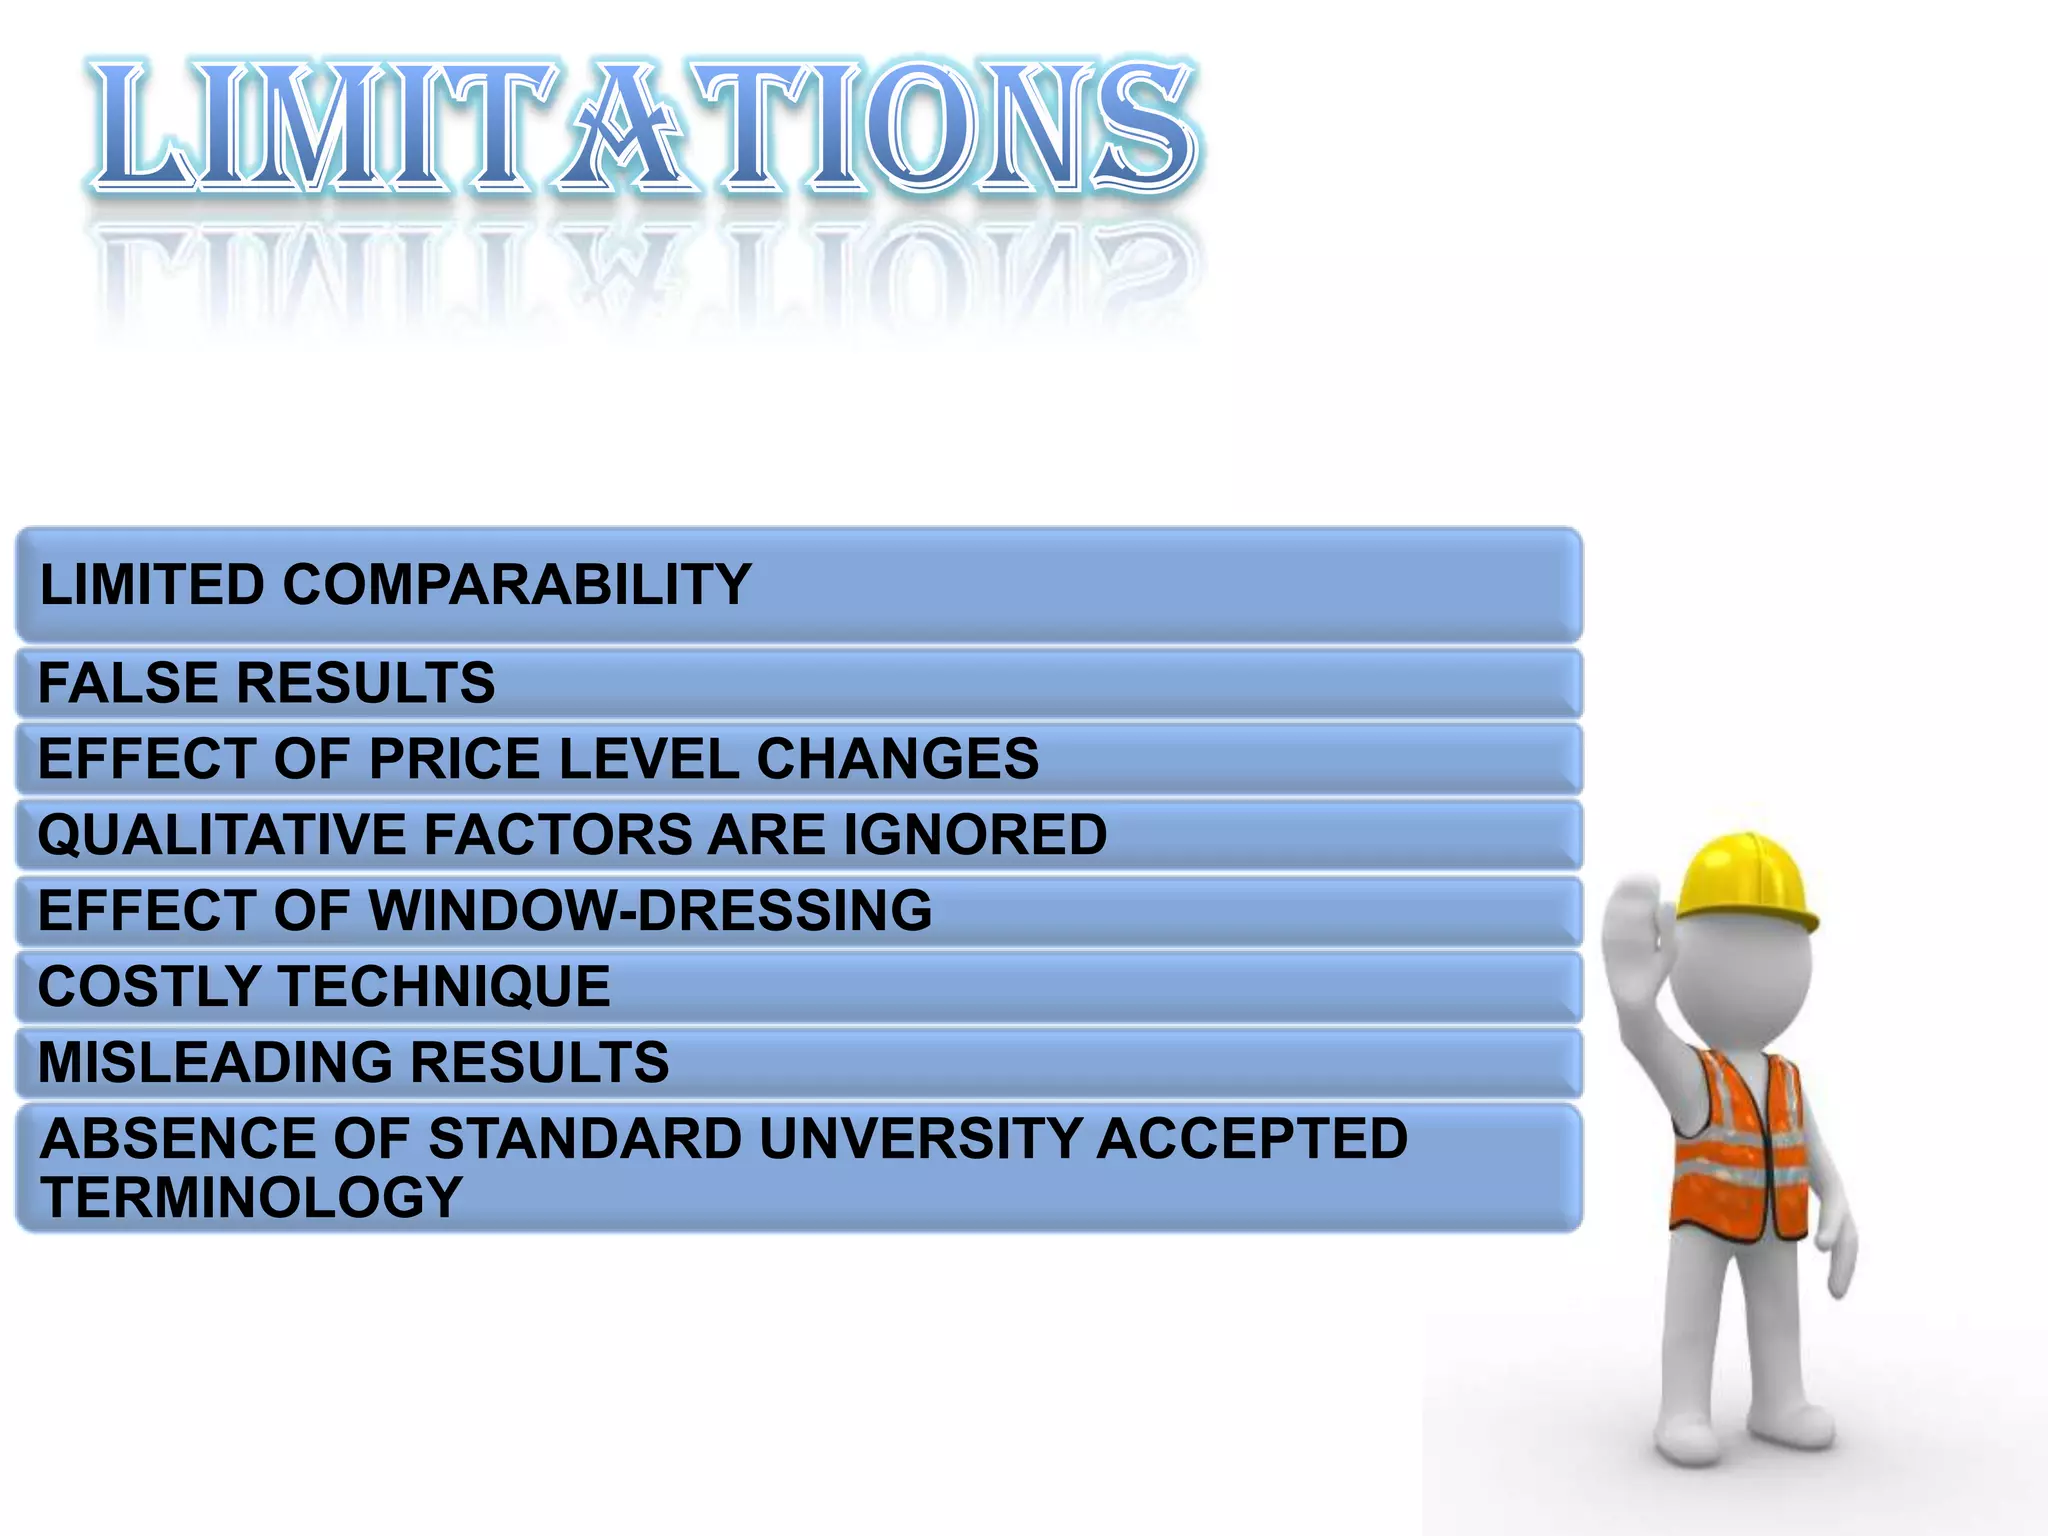
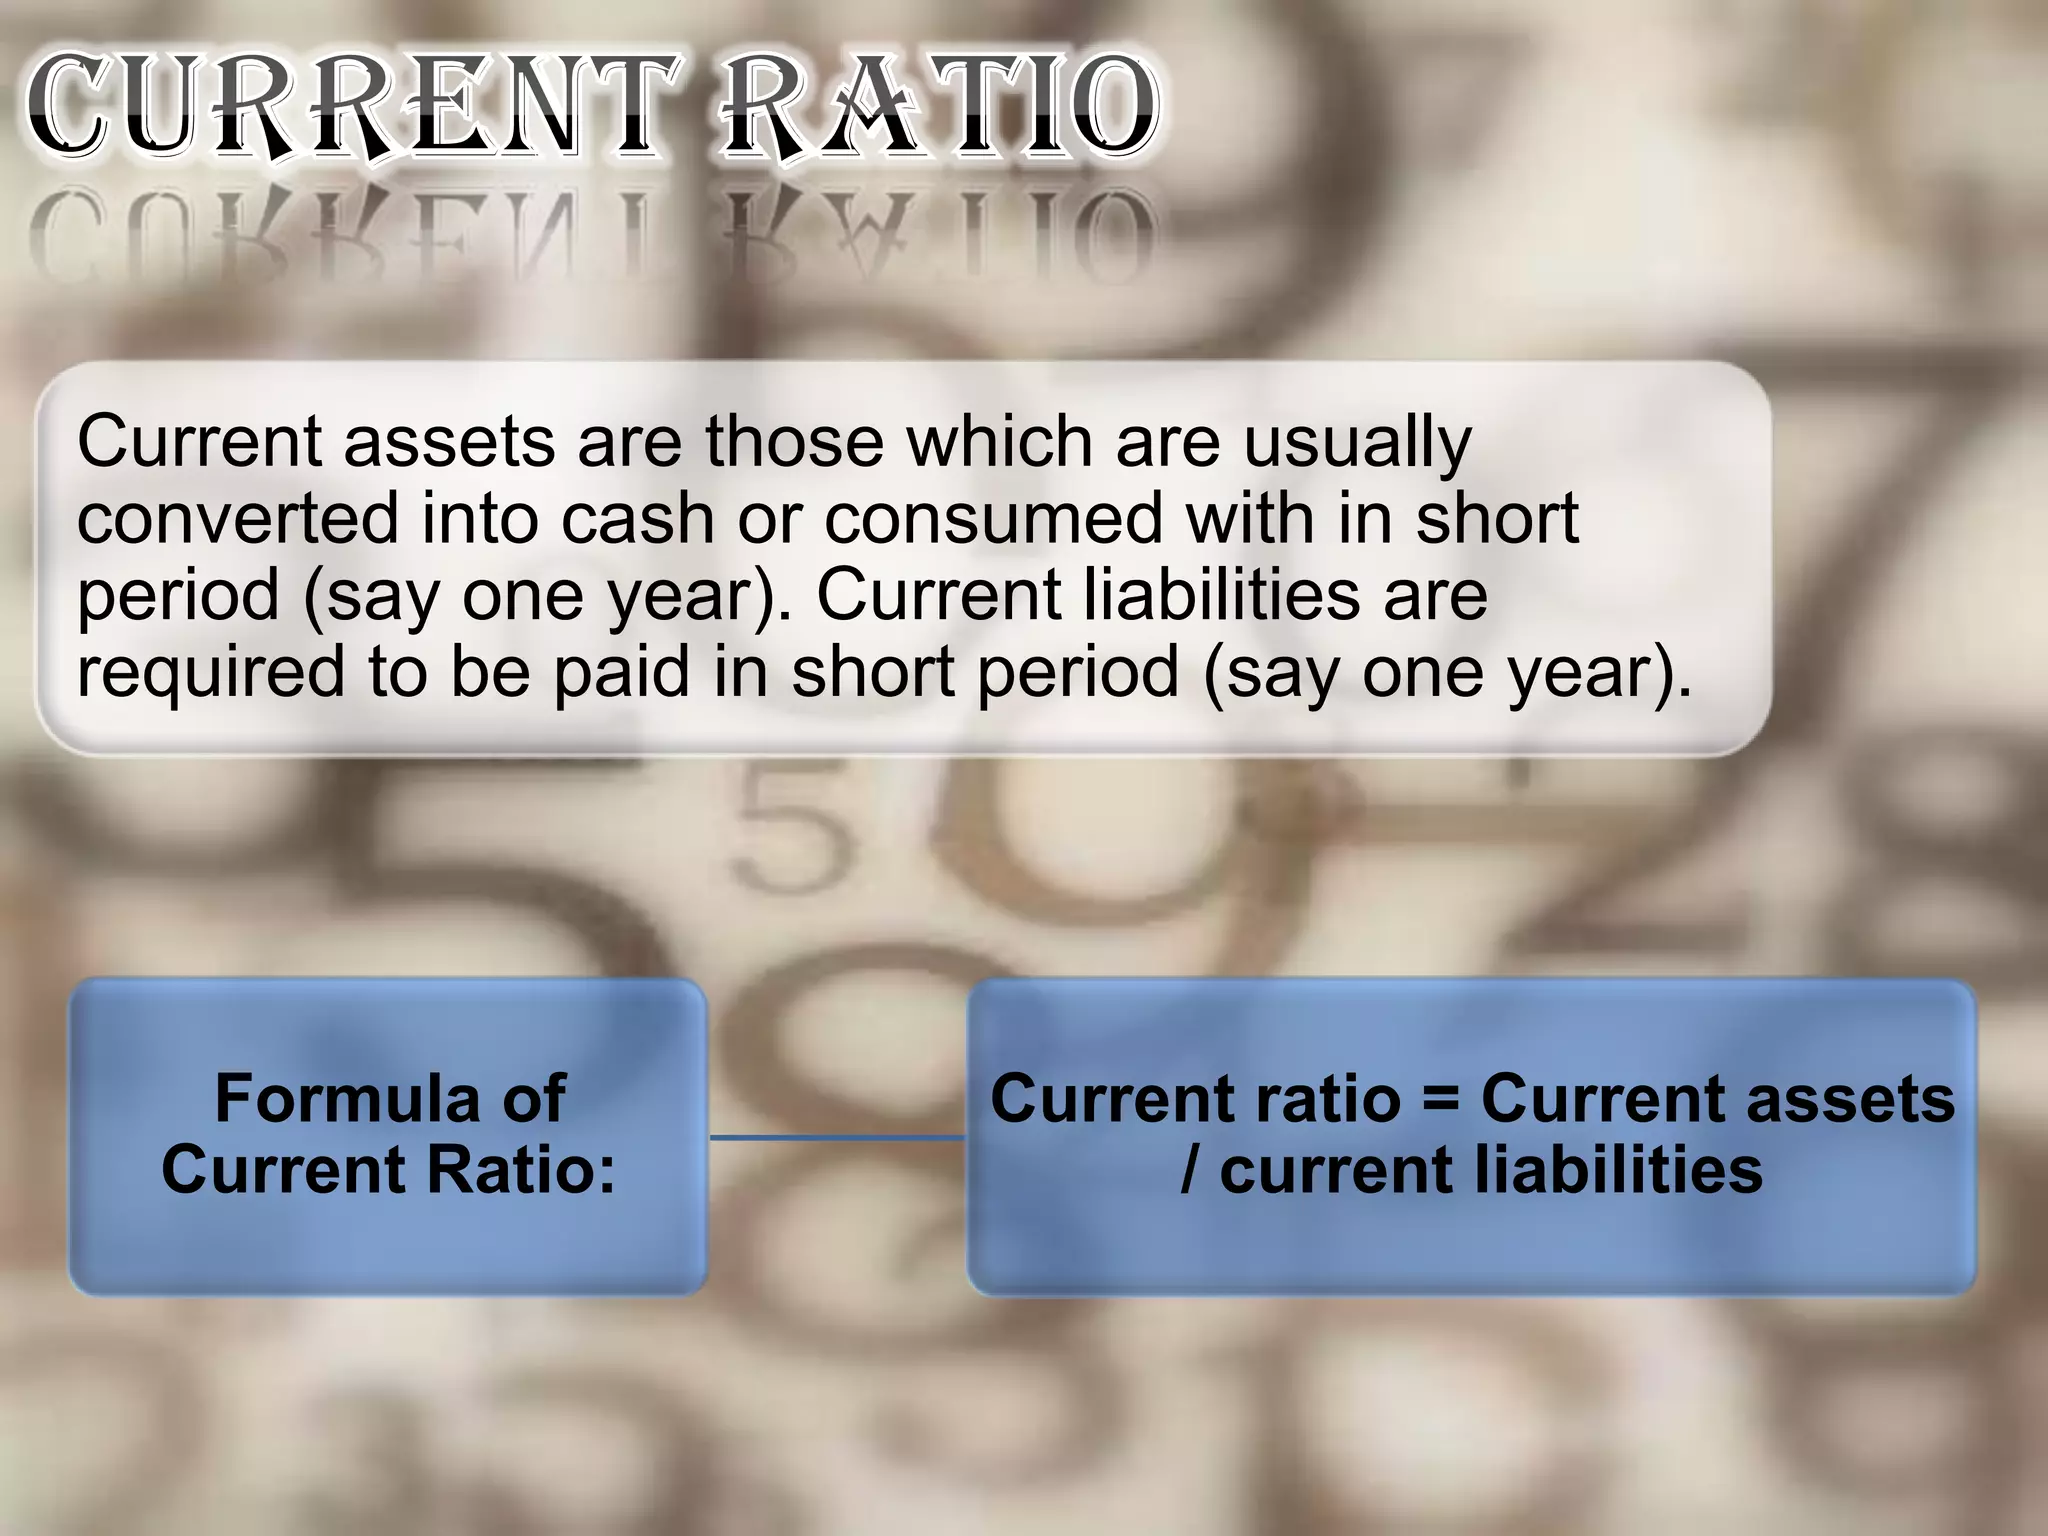
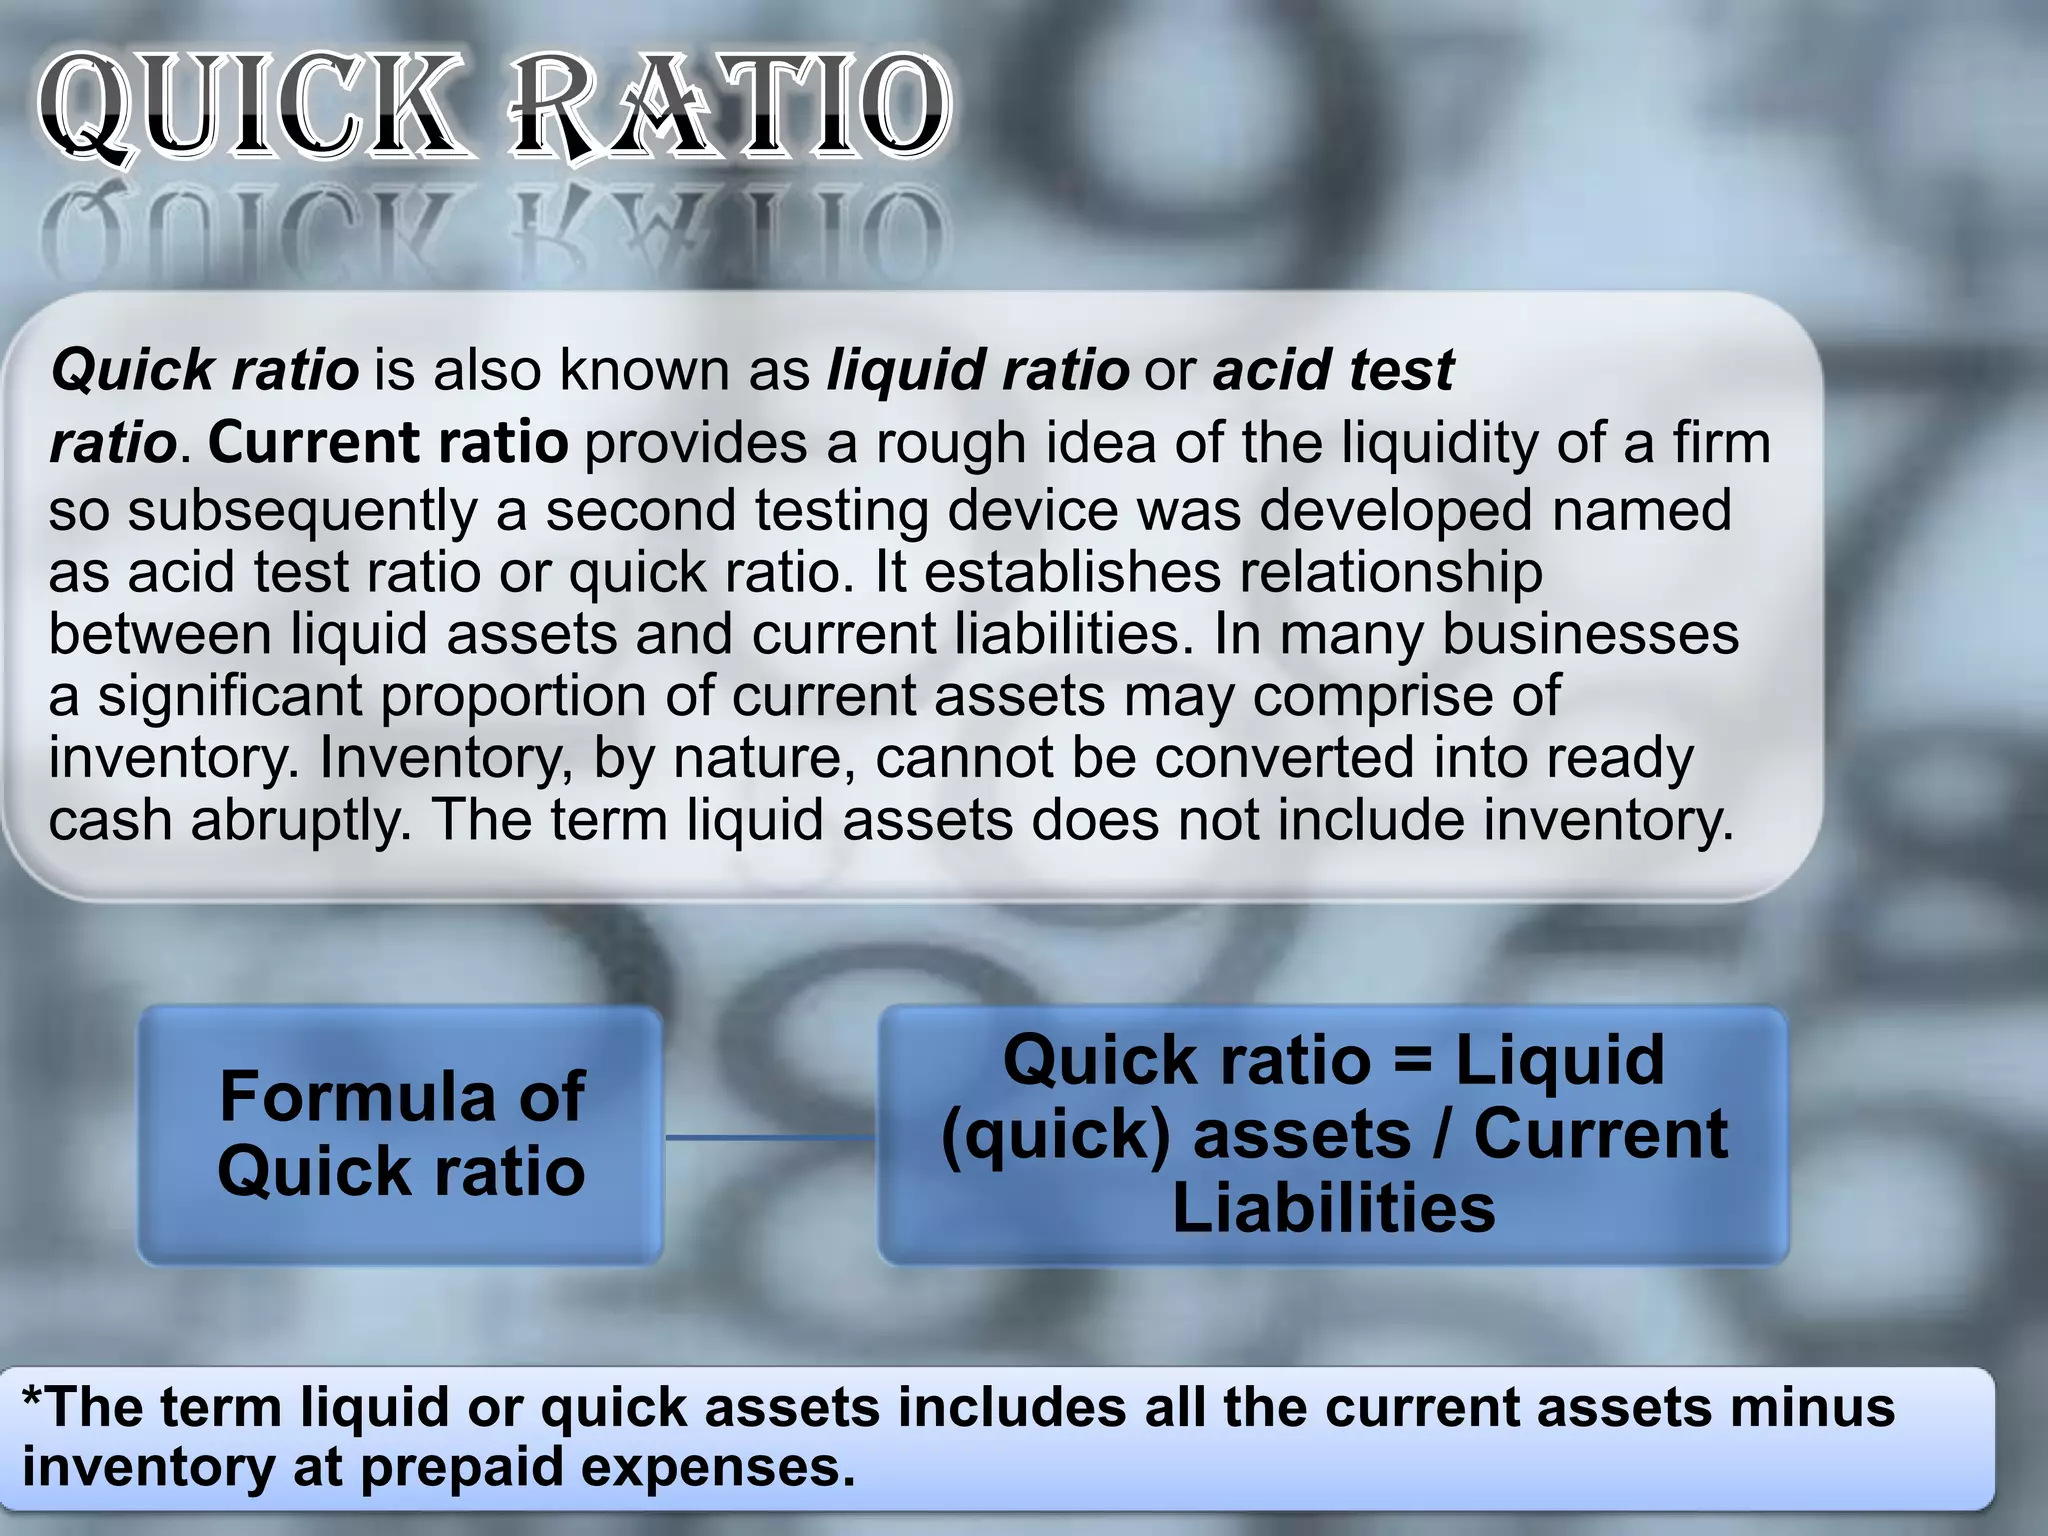
Ratio analysis is a technique used to analyze and interpret financial statements to evaluate the performance, financial position and cash flows of a business. It involves calculating and comparing various ratios using information from the financial statements. Some key ratios discussed in the document include current ratio, quick ratio, debtors turnover ratio, gross profit ratio, operating ratio, net profit ratio and expense ratios. The document also discusses ratios like debt-equity ratio, proprietary ratio, price to book ratio and price earnings ratio. Advantages of ratio analysis include simplifying accounting information and helping in comparative analysis and forecasting. Limitations include non-comparability between firms and qualitative factors being ignored.


