Downloaded 4,684 times

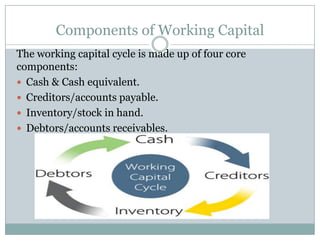
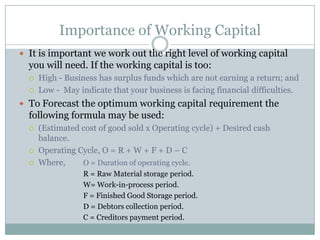
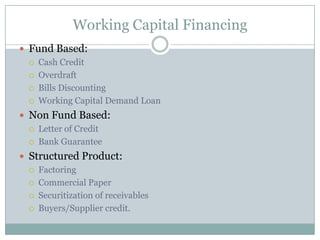
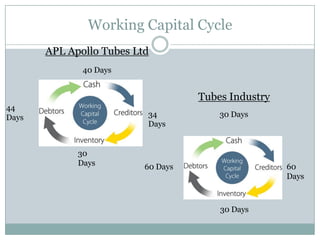
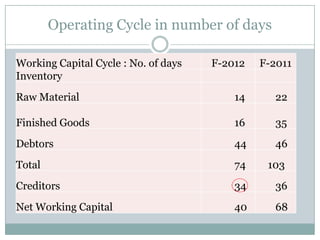
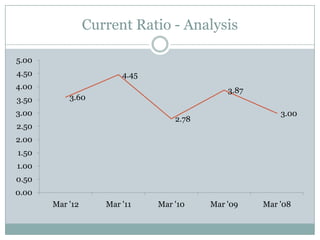
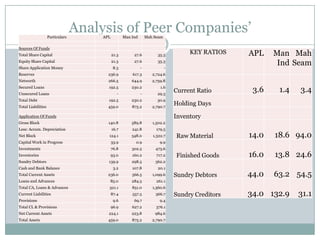
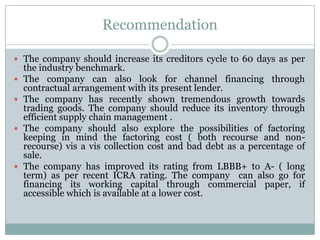


The document discusses working capital, which represents a business's liquidity and ability to meet short-term debts and expenses. It defines working capital's key components and importance, outlines formulas for calculating optimal levels, and financing options. It then analyzes an Indian steel manufacturer's working capital cycle, current ratio, inventory levels, and compares it to peers. Recommendations include increasing creditors cycles, exploring factoring, and utilizing export financing options to improve liquidity.


![Awareness of digital currency[1] (1).pptx](https://cdn.slidesharecdn.com/ss_thumbnails/awarenessofdigitalcurrency11-260125155504-b1badee4-thumbnail.jpg?width=640&height=640&fit=bounds)


