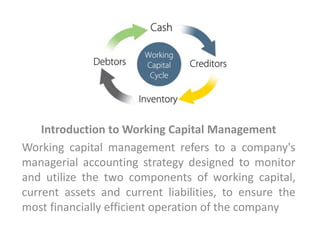
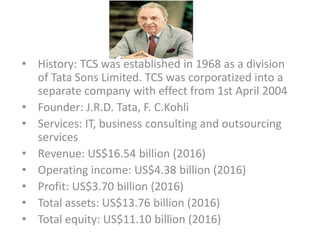
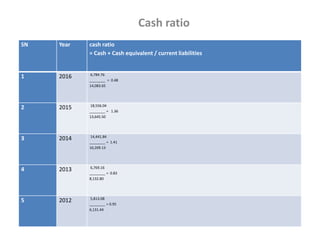
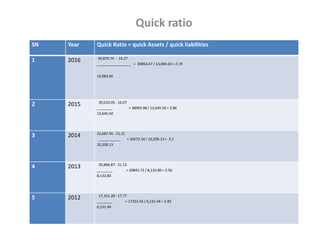
- The document analyzes the working capital management of Tata Consultancy Services (TCS) from March 2012 to March 2016 by examining key ratios like current ratio, cash ratio, and quick ratio.
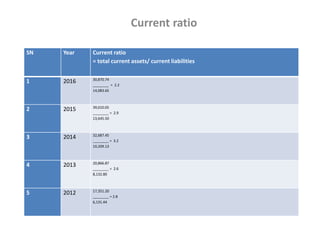
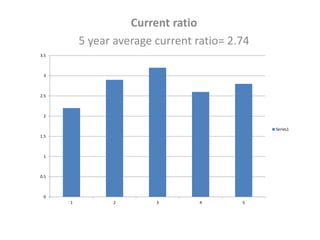
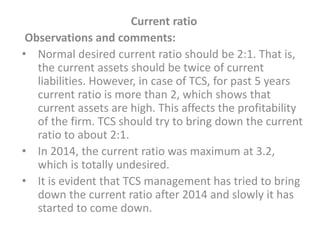
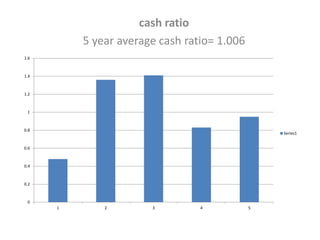
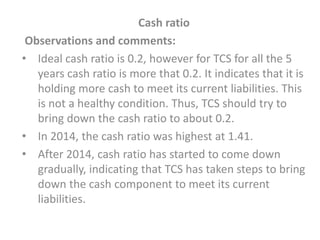
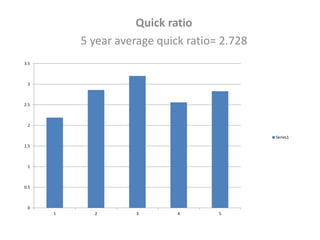
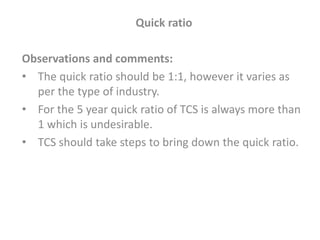
- The average current, cash, and quick ratios for TCS over the five year period were higher than industry standards, suggesting room for improvement in working capital management.
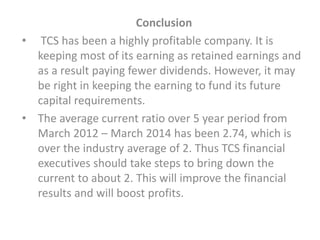
- While TCS has been highly profitable, the analysis concludes the company should take steps to optimize working capital and bring key ratios more in line with industry averages to further improve financial performance.