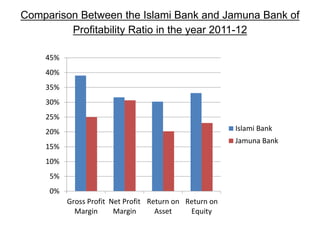
WELCOME TO THE
PRESENTATION
Group Members
1)Mohammad Wahidul Haque
• 111-11-1906
2)Chinmay Roy
• 111-11-1904
3)Md. Thowhidul Islam
• 111-11-1775
4)Shohag Parvez
• 111-11-1772
5)Hasna Yeasmin Sumi
• 111-11-1898
6) Nadia Islam
• 111-11-1877
7) Abul kalam Azad
• 111-11-1770
Profitability Ratio Analysis of
Islami Bank Bangladesh Ltd.
and
Jamuna Bank Ltd.
Profitability Ratios
• There are many measures of profitability. As a
group, these measures enable analysts to
evaluate the firm’s profits with respect to a
given level of sales, a certain level of assets or
the owner’s investment. Without profits, a
firm could not attract outside capital.
• Three frequently cited ratios of profitability that can be read
directly from the common-size income statements are:
1. The Gross Profit Margin
2. The Operating Profit Margin
3. The Net Profit Margin
Others are:
 Earnings per share (EPS)
 Return on Total Asset (ROA)
 Return on Equity
Profitability Ratio Analysis of
Islami Bank Bangladesh Ltd.
• Gross Profit Margin
G.Profit
Margin
2007-08 2008-09 2009-10 2010-11 2011-12
Gross Profit
Sales
2197854621
10256987534
= 0.21 X 100
= 21%
5935982040
21369827458
= 0.24X 100
= 24%
6969875318
21584679280
= 0.27 X 100
= 27 %
7203574218
22654789123
= 0.31 X 100
= 31%
8895125845
25369741852
= 0.39 X 100
= 39%
0
5
10
15
20
25
30
35
40
45
2007-08 2008-09 2009-10 2010-11 2011-12
Gross Profit Margin
Gross Profit Margin
Decision: The higher the gross profit margin,
the better amount of money is remaining the
firm has paid for its goods. The lower the gross
profit margin, the less amount of money is
remaining the firm has after paying for its
goods.
Net Profit Margin
Net Profit
Margin
2007-08 2008-09 2009-10 2010-11 2011-12
Earnings
available for
common stock
holders
Sales
27743111949
10256987534
= 27%
31235982040
21369827458
= 28%
35369875318
21584679280
= 29.50%
42035742189
22654789123
= 31%
68951258456
25369741852
= 31.65%
24%
25%
26%
27%
28%
29%
30%
31%
32%
2007-08 2008-09 2009-10 2010-11 2011-12
Net profit margin
Net profit margin
Decision: The higher the firm’s net profit
margin, the better amount of money the firm
has. Again, the lower the firm’s net profit
margin, the less amount of money the firm has.
Return on Asset
Return on Asset 2007-08 2008-09 2009-10 2010-11 2011-12
Earnings
available for
common stock
holders
Total Assets
47743111949
22167444018
= 25%
51235982040
21369827458
= 26.50%
55369875318
21584679280
= 27%
62035742189
22654789123
= 28%
78951258456
25369741852
= 30.20%
0
5
10
15
20
25
30
35
2007-08 2008-09 2009-10 2010-11 2011-12
Return on Asset
Return on Asset
Decision: The higher the firm’s return on total
assets, the better effectiveness of management
in generating profits with its available assets.
The lower the firm’s return on total assets, the
less effectiveness of management in generating
profits with its available assets.
Return on Equity
Return on
Equity
2007-08 2008-09 2009-10 2010-11 2011-12
Earnings
available for
common stock
holders
Common stock
equity
47743111949
332167444018
= 28%
51235982040
51369827458
= 29.50%
55369875318
641584679280
= 30%
62035742189
652654789123
= 32%
78951258456
685369741852
= 33.10%
25
26
27
28
29
30
31
32
33
34
2007-08 2008-09 2009-10 2010-11 2011-12
Return on Equity
Return on Equity
Decision: The higher this return, the better off
are the owners in terms of earning on the
common stockholders investment in the firm.
The lower this return, the less better off are the
owners.
Earnings per share
EPS 2007-08 2008-09 2009-10 2010-11 2011-12
Earnings after
Tax
No.of share
1025497621
5090300
= 12.03
2565489521
10369524
= 31.10
3698527458
15698456
= 45.91
4203574218
20568546
= 60.21
5895125845
29136952
= 78.12
0
10
20
30
40
50
60
70
80
2007-08 2008-09 2009-10 2010-11 2011-12
EPS
EPS
Decision: The higher the EPS, the greater
chance of profit of the firm. Whereas the lower
EPS indicates the lower chance of profit of the
firm.
Profitability ratio analysis of Jamuna Bank
Gross Profit Margin
Gross Profit
Margin
2007-08 2008-09 2009-10 2010-11 2011-12
Gross Profit
Sales
197854621
1025698753
= 0.19 X 100
= 19%
293598204
2036982745
= 0.14X 100
= 14%
299987531
3158467928
= 0.17 X 100
= 17 %
420357421
4265489123
= 0.21 X 100
= 21%
689512584
55369741852
= 0.39 X 100
= 25%
0%
5%
10%
15%
20%
25%
30%
2007-08 2008-09 2009-10 2010-11 2011-12
Gross profit margin
Gross profit margin
Decision: The higher the gross profit margin,
the better amount of money is remaining the
firm has paid for its goods. The lower the gross
profit margin, the less amount of money is
remaining the firm has after paying for its
goods.
Net Profit Margin
Net Profit Margin 2007-08 2008-09 2009-10 2010-11 2011-12
Earnings
available for
common stock
holders
Sales
274311194
1025698753
= 21%
312359820
2036982745
= 18%
353698753
3158467928
= 21.50%
403574218
4265489123
= 27%
689512584
55369741852
= 30.65%
0%
5%
10%
15%
20%
25%
30%
35%
2007-08 2008-09 2009-10 2010-11 2011-12
Net profit margin
Net profit margin
Decision: The higher the firm’s net profit
margin, the better amount of money the firm
has. Again, the lower the firm’s net profit
margin, the less amount of money the firm has.
Return on Asset
Return on Asset 2007-08 2008-09 2009-10 2010-11 2011-12
Earnings
available for
common stock
holders
Total Assets
274311194
3216744401
= 15%
312359820
3336982745
= 16.50%
353698753
3458467928
= 17%
403574218
3864789123
= 18.75%
689512584
5536974182
= 20.20%
0%
5%
10%
15%
20%
25%
2007-08 2008-09 2009-10 2010-11 2011-12
Return on asset
Return on asset
Decision: The higher the firm’s return on total
assets, the better effectiveness of management
in generating profits with its available assets.
The lower the firm’s return on total assets, the
less effectiveness of management in generating
profits with its available assets.
Return on Equity
Return on Asset 2007-08 2008-09 2009-10 2010-11 2011-12
Earnings
available for
common stock
holders
Common stock
equity
274311194
4216744401
= 16.24%
312359820
3336982745
= 14.90%
353698753
4458467928
= 18.18%
403574218
5864789123
= 19.05%
589512584
6136974182
= 23%
0.00%
5.00%
10.00%
15.00%
20.00%
25.00%
2007-08 2008-09 2009-10 2010-11 2011-12
Return on Equity
Return on Equity
Decision: The higher this return, the better off
are the owners in terms of earning on the
common stockholders investment in the firm.
The lower this return, the less better off are the
owners.
Earnings per share
EPS 2007-08 2008-09 2009-10 2010-11 2011-12
Earnings after
Tax
No.of share
225976
40200
= 5.62
865489
50150
= 17.26
1055569
91250
= 25.91
25487963
125698
= 30.21
39858214
2913695
= 48.12
0
5
10
15
20
25
30
35
40
45
50
2007-08 2008-09 2009-10 2010-11 2011-12
EPS
EPS
Decision: The higher the EPS, the greater
chance of profit of the firm. Whereas the lower
EPS indicates the lower chance of profit of the
firm.
Comparison Between the Islami Bank and Jamuna Bank of
Profitability Ratio in the year 2011-12
0%
5%
10%
15%
20%
25%
30%
35%
40%
45%
Gross Profit
Margin
Net Profit
Margin
Return on
Asset
Return on
Equity
Islami Bank
Jamuna Bank
EPS
0
10
20
30
40
50
60
70
80
90
2007-08 EPS2008-09 EPS2009-10 EPS2010-11 EPS2011-12 EPS
Islami Bank
Jamuna Bank
THANK YOU !!!

Profitability ratio analysis

  • 1.
  • 2.
    Group Members 1)Mohammad WahidulHaque • 111-11-1906 2)Chinmay Roy • 111-11-1904 3)Md. Thowhidul Islam • 111-11-1775 4)Shohag Parvez • 111-11-1772 5)Hasna Yeasmin Sumi • 111-11-1898 6) Nadia Islam • 111-11-1877 7) Abul kalam Azad • 111-11-1770
  • 3.
    Profitability Ratio Analysisof Islami Bank Bangladesh Ltd. and Jamuna Bank Ltd.
  • 4.
    Profitability Ratios • Thereare many measures of profitability. As a group, these measures enable analysts to evaluate the firm’s profits with respect to a given level of sales, a certain level of assets or the owner’s investment. Without profits, a firm could not attract outside capital.
  • 5.
    • Three frequentlycited ratios of profitability that can be read directly from the common-size income statements are: 1. The Gross Profit Margin 2. The Operating Profit Margin 3. The Net Profit Margin Others are:  Earnings per share (EPS)  Return on Total Asset (ROA)  Return on Equity
  • 6.
    Profitability Ratio Analysisof Islami Bank Bangladesh Ltd.
  • 7.
    • Gross ProfitMargin G.Profit Margin 2007-08 2008-09 2009-10 2010-11 2011-12 Gross Profit Sales 2197854621 10256987534 = 0.21 X 100 = 21% 5935982040 21369827458 = 0.24X 100 = 24% 6969875318 21584679280 = 0.27 X 100 = 27 % 7203574218 22654789123 = 0.31 X 100 = 31% 8895125845 25369741852 = 0.39 X 100 = 39% 0 5 10 15 20 25 30 35 40 45 2007-08 2008-09 2009-10 2010-11 2011-12 Gross Profit Margin Gross Profit Margin
  • 8.
    Decision: The higherthe gross profit margin, the better amount of money is remaining the firm has paid for its goods. The lower the gross profit margin, the less amount of money is remaining the firm has after paying for its goods.
  • 9.
    Net Profit Margin NetProfit Margin 2007-08 2008-09 2009-10 2010-11 2011-12 Earnings available for common stock holders Sales 27743111949 10256987534 = 27% 31235982040 21369827458 = 28% 35369875318 21584679280 = 29.50% 42035742189 22654789123 = 31% 68951258456 25369741852 = 31.65% 24% 25% 26% 27% 28% 29% 30% 31% 32% 2007-08 2008-09 2009-10 2010-11 2011-12 Net profit margin Net profit margin
  • 10.
    Decision: The higherthe firm’s net profit margin, the better amount of money the firm has. Again, the lower the firm’s net profit margin, the less amount of money the firm has.
  • 11.
    Return on Asset Returnon Asset 2007-08 2008-09 2009-10 2010-11 2011-12 Earnings available for common stock holders Total Assets 47743111949 22167444018 = 25% 51235982040 21369827458 = 26.50% 55369875318 21584679280 = 27% 62035742189 22654789123 = 28% 78951258456 25369741852 = 30.20% 0 5 10 15 20 25 30 35 2007-08 2008-09 2009-10 2010-11 2011-12 Return on Asset Return on Asset
  • 12.
    Decision: The higherthe firm’s return on total assets, the better effectiveness of management in generating profits with its available assets. The lower the firm’s return on total assets, the less effectiveness of management in generating profits with its available assets.
  • 13.
    Return on Equity Returnon Equity 2007-08 2008-09 2009-10 2010-11 2011-12 Earnings available for common stock holders Common stock equity 47743111949 332167444018 = 28% 51235982040 51369827458 = 29.50% 55369875318 641584679280 = 30% 62035742189 652654789123 = 32% 78951258456 685369741852 = 33.10% 25 26 27 28 29 30 31 32 33 34 2007-08 2008-09 2009-10 2010-11 2011-12 Return on Equity Return on Equity
  • 14.
    Decision: The higherthis return, the better off are the owners in terms of earning on the common stockholders investment in the firm. The lower this return, the less better off are the owners.
  • 15.
    Earnings per share EPS2007-08 2008-09 2009-10 2010-11 2011-12 Earnings after Tax No.of share 1025497621 5090300 = 12.03 2565489521 10369524 = 31.10 3698527458 15698456 = 45.91 4203574218 20568546 = 60.21 5895125845 29136952 = 78.12 0 10 20 30 40 50 60 70 80 2007-08 2008-09 2009-10 2010-11 2011-12 EPS EPS
  • 16.
    Decision: The higherthe EPS, the greater chance of profit of the firm. Whereas the lower EPS indicates the lower chance of profit of the firm.
  • 17.
  • 18.
    Gross Profit Margin GrossProfit Margin 2007-08 2008-09 2009-10 2010-11 2011-12 Gross Profit Sales 197854621 1025698753 = 0.19 X 100 = 19% 293598204 2036982745 = 0.14X 100 = 14% 299987531 3158467928 = 0.17 X 100 = 17 % 420357421 4265489123 = 0.21 X 100 = 21% 689512584 55369741852 = 0.39 X 100 = 25% 0% 5% 10% 15% 20% 25% 30% 2007-08 2008-09 2009-10 2010-11 2011-12 Gross profit margin Gross profit margin
  • 19.
    Decision: The higherthe gross profit margin, the better amount of money is remaining the firm has paid for its goods. The lower the gross profit margin, the less amount of money is remaining the firm has after paying for its goods.
  • 20.
    Net Profit Margin NetProfit Margin 2007-08 2008-09 2009-10 2010-11 2011-12 Earnings available for common stock holders Sales 274311194 1025698753 = 21% 312359820 2036982745 = 18% 353698753 3158467928 = 21.50% 403574218 4265489123 = 27% 689512584 55369741852 = 30.65% 0% 5% 10% 15% 20% 25% 30% 35% 2007-08 2008-09 2009-10 2010-11 2011-12 Net profit margin Net profit margin
  • 21.
    Decision: The higherthe firm’s net profit margin, the better amount of money the firm has. Again, the lower the firm’s net profit margin, the less amount of money the firm has.
  • 22.
    Return on Asset Returnon Asset 2007-08 2008-09 2009-10 2010-11 2011-12 Earnings available for common stock holders Total Assets 274311194 3216744401 = 15% 312359820 3336982745 = 16.50% 353698753 3458467928 = 17% 403574218 3864789123 = 18.75% 689512584 5536974182 = 20.20% 0% 5% 10% 15% 20% 25% 2007-08 2008-09 2009-10 2010-11 2011-12 Return on asset Return on asset
  • 23.
    Decision: The higherthe firm’s return on total assets, the better effectiveness of management in generating profits with its available assets. The lower the firm’s return on total assets, the less effectiveness of management in generating profits with its available assets.
  • 24.
    Return on Equity Returnon Asset 2007-08 2008-09 2009-10 2010-11 2011-12 Earnings available for common stock holders Common stock equity 274311194 4216744401 = 16.24% 312359820 3336982745 = 14.90% 353698753 4458467928 = 18.18% 403574218 5864789123 = 19.05% 589512584 6136974182 = 23% 0.00% 5.00% 10.00% 15.00% 20.00% 25.00% 2007-08 2008-09 2009-10 2010-11 2011-12 Return on Equity Return on Equity
  • 25.
    Decision: The higherthis return, the better off are the owners in terms of earning on the common stockholders investment in the firm. The lower this return, the less better off are the owners.
  • 26.
    Earnings per share EPS2007-08 2008-09 2009-10 2010-11 2011-12 Earnings after Tax No.of share 225976 40200 = 5.62 865489 50150 = 17.26 1055569 91250 = 25.91 25487963 125698 = 30.21 39858214 2913695 = 48.12 0 5 10 15 20 25 30 35 40 45 50 2007-08 2008-09 2009-10 2010-11 2011-12 EPS EPS
  • 27.
    Decision: The higherthe EPS, the greater chance of profit of the firm. Whereas the lower EPS indicates the lower chance of profit of the firm.
  • 28.
    Comparison Between theIslami Bank and Jamuna Bank of Profitability Ratio in the year 2011-12 0% 5% 10% 15% 20% 25% 30% 35% 40% 45% Gross Profit Margin Net Profit Margin Return on Asset Return on Equity Islami Bank Jamuna Bank
  • 29.
    EPS 0 10 20 30 40 50 60 70 80 90 2007-08 EPS2008-09 EPS2009-10EPS2010-11 EPS2011-12 EPS Islami Bank Jamuna Bank
  • 30.