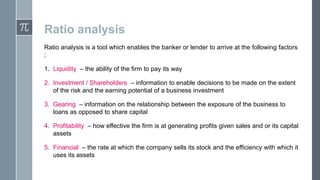
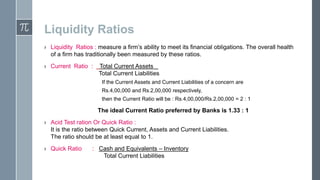
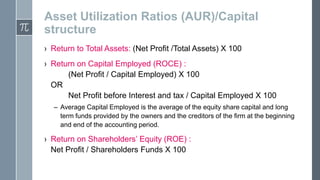
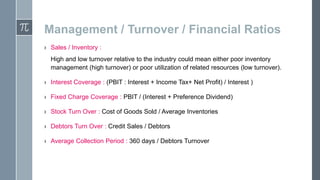
Ratio analysis is a tool used to analyze financial statements and determine a firm's liquidity, profitability, and financial stability. It involves calculating various ratios using data from the income statement and balance sheet, and comparing them over time and against industry benchmarks. The document discusses various types of ratios like liquidity, leverage, asset utilization, and market valuation ratios. It also provides the formulas to calculate important ratios like current ratio, debt-to-equity, return on equity, and earnings per share. The document is intended to explain the concept of ratio analysis and its importance for financial statement evaluation.
We have picked up HUL balance sheets of years from ACE-Equity and applied some ratio analysis to analyze the trend and predict next year results of the company.
Profitability Ratio
A profitability ratio is a measure of financial ratio defining the profit percent and return percent from the business using data from financial statements at a specific point of time
It assess business’s ability to generate gross profit, operating profit and net profit from the sales using data from profit& loss statement
It even takes into consideration various return generating ability of business in terms of return on assets, return on capital employed, return on equity, return on investment using data from balance sheet
Types of profitability ratio
Gross Profit Ratio, Net Profit Ratio, Operating Profit Ratio, Return on Assets, Return on Equity, Return on Investment, Return on Capital Employed
Gross Profit Ratio
Gross Profit Ratio(GPR) is a profitability ratio that shows the relationship between gross profit and the revenue from net sales
GPR = (퐆퐫퐨퐬퐬 퐏퐫퐨퐟퐢퐭)/(퐍퐞퐭 퐒퐚퐥퐞퐬)
Net Profit Ratio
The net profit ratio is equal to how much net profit is generated as a ratio of revenue earned through sales
Net Profit Ratio = (퐍퐞퐭 푷풓풐풇풊풕)/(퐍퐞퐭 푺풂풍풆풔)
Operating Profit Margin is a profitability ratio used to calculate the percentage of operating profit a company produces from its operations, prior to deduction of taxes and interest charges
Operating Profit Ratio
Operating Profit Ratio = (퐎퐩퐞퐫퐚퐭퐢퐧퐠 퐏퐫퐨퐟퐢퐭)/(퐍퐞퐭 퐒퐚퐥퐞퐬)
Return on assets (ROA) is a kind of profitability measure used to determine returns on assets relevant when compared across the companies or previous performance of the company
Return On Asset = (퐍퐞퐭 퐏퐫퐨퐟퐢퐭)/(퐀퐯퐠.퐓퐨퐭퐚퐥 퐀퐬퐬퐞퐭퐬)
Return on equity (ROE) is a measure of financial performance calculated by dividing net profit by average shareholders' equity
ROE = (퐍퐞퐭 퐏퐫퐨퐟퐢퐭)/(퐀퐯퐠.퐓퐨퐭퐚퐥 퐄퐪퐮퐢퐭퐲)
Return on capital employed is a profitability ratio used in valuation of company’s financial position depicting the return out of capital employed
ROCE = 퐄퐁퐈퐓/(퐂퐚퐩퐢퐭퐚퐥 퐄퐦퐩퐥퐨퐲퐞퐝)
Return on investment is a profitability measure used by businesses to identify the efficiency of business in generating return out of an investment
ROI = (퐍퐞퐭 퐏퐫퐨퐟퐢퐭)/(퐂퐨퐬퐭 퐨퐟 퐈퐧퐯퐞퐬퐭퐦퐞퐧퐭)
Ratio analysis refers to the analysis and interpretation of the data collected from the financial statements (i.e., Profit and Loss Statement, Balance Sheet and Fund/Cash Flow statement etc.)
Thank You for Watching
DevTech Finance
A du-pont analysis of automobile companiespriya1826dangi
Do-Pont is the method of measuring the performance which was started by DuPont Corporation in 1920’s. With this method, assets are measured at their gross book value rather than at net book value in order to produce a higher return on equity (ROE). It is also known as "DuPont identity".
DuPont analysis tells us that ROE is affected by three things:
- Operating efficiency, which is measured by profit margin
- Asset use efficiency, which is measured by total asset turnover
- Financial leverage, which is measured by the equity multiplier
The Du-Pont analysis also called the Du-Pont model is a financial ratio based on the return on equity ratio that is used to analyze a company's ability to increase its return on equity. In other words, this model breaks down the return on equity ratio to explain how companies can increase their return for investors.
The Du-Pont analysis looks at three main components of the ROE ratio.
• Profit Margin
• Total Asset Turnover
• Financial Leverage
Based on these three performances measures the model concludes that a company can raise its ROE by maintaining a high profit margin, increasing asset turnover, or leveraging assets more effectively
It is one of the strongest indicators for a financially successful company. ROE is a great tool for investors because it shows you what the return is on the portion of the company that belongs to equity. It is a simple calculation that quickly summarizes the ability of management to turn shareholder equity into profitable returns
There are two other indicators that would like to analyze in a company: profit margin and asset turnover. Ideally we would like to see a company with high numbers for both of these, but that’s not always possible. It is a must that the company has at least one of these performing better than the industry standard. If the asset turnover is low, then the profit margin better be high (a specialty producer with a competitive advantage). If the profit margin is low, then the asset turnover better be high (a low cost provider with large market share).
In this report there is comparison between Five automobile companies i.e. Tata motors, Mahindra and Mahindra ,Maruti Suzuki, Hero MotoCorp, and Bajaj Auto through Do-Pont Model
The Du-Pont analysis is only the first step in analyzing the firm’s performance. The next step is to dig deeper into the differences between the firm’s performance and the benchmark against which it is being measured.
After analyzing these automobile companies I found that Hero MotoCorp maintaining highest ROE as per comparison of others automobile companies more effectively.
Additional analysis can include comparing additional financial ratios and common-size financial statements that facilitate comparisons between firms. Common-size financial statements express everything as a percentage of one financial statement parameter, such as sales on the income statement or total assets on the balance she
Ratio analysis project on ONGC of year 2010-11 & 2011-12Arjun Negi
Title: ratio analysis for period 2010-11 & 2011-12 : case study of ONGC SCOPE:
a) Ratio Analysis: concept, definition, Objectives, merits and demerits;
b) Calculation of solvency ratios: short term & long term;
c) Analysis of last two year 2010-11 & 2011-12;
d) Conclusion.
( included bibliography, literature review , and ONGC balance sheet )
The matter includes concept and types of Working Capital. Further it explains Optimum Level of Current Assets, Various Approaches to Working Capital Financing. Then Operating Cycle, Cash Cycle and Working Capital Estimation Techniques are discussed.
This particular project is based on ratio analysis of Coca-Cola International. I have analyzed two years financial performance of Coke i.e. from 2011 to 2012. I hope my this effort will help other interested students.
Financial ratios and their use in understanding Financial StatementsPranav Dedhia
An introduction and in-depth understanding on the importance of Financial ratios in understanding financial statements of business entities along with relevant examples
Financial analysis for juhayna & domty co . graduation project zagzig uni...Eslam Fathi
Financial Analysis is the process of selecting, evaluating, and identifying the financial
strength and weaknesses of the firm by properly establishing relationship between
items of financial statements. Firms, bank, loan officers and business owners all use
Financial analysis to learn more about a company’s current financial health as well as its
potential.
The European Unemployment Puzzle: implications from population agingGRAPE
We study the link between the evolving age structure of the working population and unemployment. We build a large new Keynesian OLG model with a realistic age structure, labor market frictions, sticky prices, and aggregate shocks. Once calibrated to the European economy, we quantify the extent to which demographic changes over the last three decades have contributed to the decline of the unemployment rate. Our findings yield important implications for the future evolution of unemployment given the anticipated further aging of the working population in Europe. We also quantify the implications for optimal monetary policy: lowering inflation volatility becomes less costly in terms of GDP and unemployment volatility, which hints that optimal monetary policy may be more hawkish in an aging society. Finally, our results also propose a partial reversal of the European-US unemployment puzzle due to the fact that the share of young workers is expected to remain robust in the US.
Empowering the Unbanked: The Vital Role of NBFCs in Promoting Financial Inclu...Vighnesh Shashtri
In India, financial inclusion remains a critical challenge, with a significant portion of the population still unbanked. Non-Banking Financial Companies (NBFCs) have emerged as key players in bridging this gap by providing financial services to those often overlooked by traditional banking institutions. This article delves into how NBFCs are fostering financial inclusion and empowering the unbanked.
Introduction to Indian Financial System ()Avanish Goel
The financial system of a country is an important tool for economic development of the country, as it helps in creation of wealth by linking savings with investments.
It facilitates the flow of funds form the households (savers) to business firms (investors) to aid in wealth creation and development of both the parties
Resume
• Real GDP growth slowed down due to problems with access to electricity caused by the destruction of manoeuvrable electricity generation by Russian drones and missiles.
• Exports and imports continued growing due to better logistics through the Ukrainian sea corridor and road. Polish farmers and drivers stopped blocking borders at the end of April.
• In April, both the Tax and Customs Services over-executed the revenue plan. Moreover, the NBU transferred twice the planned profit to the budget.
• The European side approved the Ukraine Plan, which the government adopted to determine indicators for the Ukraine Facility. That approval will allow Ukraine to receive a EUR 1.9 bn loan from the EU in May. At the same time, the EU provided Ukraine with a EUR 1.5 bn loan in April, as the government fulfilled five indicators under the Ukraine Plan.
• The USA has finally approved an aid package for Ukraine, which includes USD 7.8 bn of budget support; however, the conditions and timing of the assistance are still unknown.
• As in March, annual consumer inflation amounted to 3.2% yoy in April.
• At the April monetary policy meeting, the NBU again reduced the key policy rate from 14.5% to 13.5% per annum.
• Over the past four weeks, the hryvnia exchange rate has stabilized in the UAH 39-40 per USD range.
Latino Buying Power - May 2024 Presentation for Latino CaucusDanay Escanaverino
Unlock the potential of Latino Buying Power with this in-depth SlideShare presentation. Explore how the Latino consumer market is transforming the American economy, driven by their significant buying power, entrepreneurial contributions, and growing influence across various sectors.
**Key Sections Covered:**
1. **Economic Impact:** Understand the profound economic impact of Latino consumers on the U.S. economy. Discover how their increasing purchasing power is fueling growth in key industries and contributing to national economic prosperity.
2. **Buying Power:** Dive into detailed analyses of Latino buying power, including its growth trends, key drivers, and projections for the future. Learn how this influential group’s spending habits are shaping market dynamics and creating opportunities for businesses.
3. **Entrepreneurial Contributions:** Explore the entrepreneurial spirit within the Latino community. Examine how Latino-owned businesses are thriving and contributing to job creation, innovation, and economic diversification.
4. **Workforce Statistics:** Gain insights into the role of Latino workers in the American labor market. Review statistics on employment rates, occupational distribution, and the economic contributions of Latino professionals across various industries.
5. **Media Consumption:** Understand the media consumption habits of Latino audiences. Discover their preferences for digital platforms, television, radio, and social media. Learn how these consumption patterns are influencing advertising strategies and media content.
6. **Education:** Examine the educational achievements and challenges within the Latino community. Review statistics on enrollment, graduation rates, and fields of study. Understand the implications of education on economic mobility and workforce readiness.
7. **Home Ownership:** Explore trends in Latino home ownership. Understand the factors driving home buying decisions, the challenges faced by Latino homeowners, and the impact of home ownership on community stability and economic growth.
This SlideShare provides valuable insights for marketers, business owners, policymakers, and anyone interested in the economic influence of the Latino community. By understanding the various facets of Latino buying power, you can effectively engage with this dynamic and growing market segment.
Equip yourself with the knowledge to leverage Latino buying power, tap into their entrepreneurial spirit, and connect with their unique cultural and consumer preferences. Drive your business success by embracing the economic potential of Latino consumers.
**Keywords:** Latino buying power, economic impact, entrepreneurial contributions, workforce statistics, media consumption, education, home ownership, Latino market, Hispanic buying power, Latino purchasing power.
Falcon stands out as a top-tier P2P Invoice Discounting platform in India, bridging esteemed blue-chip companies and eager investors. Our goal is to transform the investment landscape in India by establishing a comprehensive destination for borrowers and investors with diverse profiles and needs, all while minimizing risk. What sets Falcon apart is the elimination of intermediaries such as commercial banks and depository institutions, allowing investors to enjoy higher yields.
how to sell pi coins on Bitmart crypto exchangeDOT TECH
Yes. Pi network coins can be exchanged but not on bitmart exchange. Because pi network is still in the enclosed mainnet. The only way pioneers are able to trade pi coins is by reselling the pi coins to pi verified merchants.
A verified merchant is someone who buys pi network coins and resell it to exchanges looking forward to hold till mainnet launch.
I will leave the telegram contact of my personal pi merchant to trade with.
@Pi_vendor_247
What price will pi network be listed on exchangesDOT TECH
The rate at which pi will be listed is practically unknown. But due to speculations surrounding it the predicted rate is tends to be from 30$ — 50$.
So if you are interested in selling your pi network coins at a high rate tho. Or you can't wait till the mainnet launch in 2026. You can easily trade your pi coins with a merchant.
A merchant is someone who buys pi coins from miners and resell them to Investors looking forward to hold massive quantities till mainnet launch.
I will leave the telegram contact of my personal pi vendor to trade with.
@Pi_vendor_247
If you are looking for a pi coin investor. Then look no further because I have the right one he is a pi vendor (he buy and resell to whales in China). I met him on a crypto conference and ever since I and my friends have sold more than 10k pi coins to him And he bought all and still want more. I will drop his telegram handle below just send him a message.
@Pi_vendor_247
US Economic Outlook - Being Decided - M Capital Group August 2021.pdfpchutichetpong
The U.S. economy is continuing its impressive recovery from the COVID-19 pandemic and not slowing down despite re-occurring bumps. The U.S. savings rate reached its highest ever recorded level at 34% in April 2020 and Americans seem ready to spend. The sectors that had been hurt the most by the pandemic specifically reduced consumer spending, like retail, leisure, hospitality, and travel, are now experiencing massive growth in revenue and job openings.
Could this growth lead to a “Roaring Twenties”? As quickly as the U.S. economy contracted, experiencing a 9.1% drop in economic output relative to the business cycle in Q2 2020, the largest in recorded history, it has rebounded beyond expectations. This surprising growth seems to be fueled by the U.S. government’s aggressive fiscal and monetary policies, and an increase in consumer spending as mobility restrictions are lifted. Unemployment rates between June 2020 and June 2021 decreased by 5.2%, while the demand for labor is increasing, coupled with increasing wages to incentivize Americans to rejoin the labor force. Schools and businesses are expected to fully reopen soon. In parallel, vaccination rates across the country and the world continue to rise, with full vaccination rates of 50% and 14.8% respectively.
However, it is not completely smooth sailing from here. According to M Capital Group, the main risks that threaten the continued growth of the U.S. economy are inflation, unsettled trade relations, and another wave of Covid-19 mutations that could shut down the world again. Have we learned from the past year of COVID-19 and adapted our economy accordingly?
“In order for the U.S. economy to continue growing, whether there is another wave or not, the U.S. needs to focus on diversifying supply chains, supporting business investment, and maintaining consumer spending,” says Grace Feeley, a research analyst at M Capital Group.
While the economic indicators are positive, the risks are coming closer to manifesting and threatening such growth. The new variants spreading throughout the world, Delta, Lambda, and Gamma, are vaccine-resistant and muddy the predictions made about the economy and health of the country. These variants bring back the feeling of uncertainty that has wreaked havoc not only on the stock market but the mindset of people around the world. MCG provides unique insight on how to mitigate these risks to possibly ensure a bright economic future.
Currently pi network is not tradable on binance or any other exchange because we are still in the enclosed mainnet.
Right now the only way to sell pi coins is by trading with a verified merchant.
What is a pi merchant?
A pi merchant is someone verified by pi network team and allowed to barter pi coins for goods and services.
Since pi network is not doing any pre-sale The only way exchanges like binance/huobi or crypto whales can get pi is by buying from miners. And a merchant stands in between the exchanges and the miners.
I will leave the telegram contact of my personal pi merchant. I and my friends has traded more than 6000pi coins successfully
Tele-gram
@Pi_vendor_247
how to sell pi coins in South Korea profitably.DOT TECH
Yes. You can sell your pi network coins in South Korea or any other country, by finding a verified pi merchant
What is a verified pi merchant?
Since pi network is not launched yet on any exchange, the only way you can sell pi coins is by selling to a verified pi merchant, and this is because pi network is not launched yet on any exchange and no pre-sale or ico offerings Is done on pi.
Since there is no pre-sale, the only way exchanges can get pi is by buying from miners. So a pi merchant facilitates these transactions by acting as a bridge for both transactions.
How can i find a pi vendor/merchant?
Well for those who haven't traded with a pi merchant or who don't already have one. I will leave the telegram id of my personal pi merchant who i trade pi with.
Tele gram: @Pi_vendor_247
#pi #sell #nigeria #pinetwork #picoins #sellpi #Nigerian #tradepi #pinetworkcoins #sellmypi
how to swap pi coins to foreign currency withdrawable.DOT TECH
As of my last update, Pi is still in the testing phase and is not tradable on any exchanges.
However, Pi Network has announced plans to launch its Testnet and Mainnet in the future, which may include listing Pi on exchanges.
The current method for selling pi coins involves exchanging them with a pi vendor who purchases pi coins for investment reasons.
If you want to sell your pi coins, reach out to a pi vendor and sell them to anyone looking to sell pi coins from any country around the globe.
Below is the contact information for my personal pi vendor.
Telegram: @Pi_vendor_247
The secret way to sell pi coins effortlessly.DOT TECH
Well as we all know pi isn't launched yet. But you can still sell your pi coins effortlessly because some whales in China are interested in holding massive pi coins. And they are willing to pay good money for it. If you are interested in selling I will leave a contact for you. Just telegram this number below. I sold about 3000 pi coins to him and he paid me immediately.
Telegram: @Pi_vendor_247
Turin Startup Ecosystem 2024 - Ricerca sulle Startup e il Sistema dell'Innov...Quotidiano Piemontese
Turin Startup Ecosystem 2024
Una ricerca de il Club degli Investitori, in collaborazione con ToTeM Torino Tech Map e con il supporto della ESCP Business School e di Growth Capital
2. Ratio Analysis
› Is a method or process by which the relationship of items
or groups of items in the financial statements are
computed, and presented.
› Is an important tool of financial analysis.
› Is used to interpret the financial statements so that the
strengths and weaknesses of a firm, its historical
performance and current financial condition can be
determined.
3. Ratio Analysis
It’s a tool which enables the banker or lender to arrive at the
following factors :
› Liquidity position
› Profitability
› Solvency
› Financial Stability
› Quality of the Management
› Safety & Security of the loans & advances to be or already
been provided
4. Why Financial Analysis
› Lenders need it for carrying out the following
› Technical Appraisal
› Commercial Appraisal
› Financial Appraisal
› Economic Appraisal
› Management Appraisal
5. Why Financial Analysis
Before looking at the ratios there are a number of cautionary
points concerning their use that need to be identified :
› The dates and duration of the financial statements being compared
should be the same. If not, the effects of seasonality may cause
erroneous conclusions to be drawn.
› The accounts to be compared should have been prepared on the
same bases. Different treatment of stocks or depreciations or asset
valuations will distort the results.
› In order to judge the overall performance of the firm a group of ratios,
as opposed to just one or two should be used. In order to identify
trends at least three years of ratios are normally required.
6. Why Financial Analysis
The utility of ratio analysis will get further enhanced if
following comparison is possible.
› Between the borrower and its competitor
› Between the borrower and the best enterprise in the
industry
› Between the borrower and the average performance in the
industry
› Between the borrower and the global average
7. How a Ratio is expressed?
› As Percentage - such as 25% or 50% . For example if net
profit is Rs.25,000/- and the sales is Rs.1,00,000/- then the net
profit can be said to be 25% of the sales.
› As Proportion - The above figures may be expressed in terms
of the relationship between net profit to sales
as 1 : 4.
› As Pure Number / Times - The same can also be expressed in
an alternatively way such as the sale is 4 times of the net profit
or profit is 1/4th of the sales.
8. Classification of Ratios
Balance Sheet Ratio
P&L Ratio or
Income/Revenue
Statement Ratio
Balance Sheet and Profit
& Loss Ratio
Financial Ratio / Liquidity
Ratio
Operating Ratio /
Profitability / Leverage
Ratio
Composite Ratio / Market
Valuation Ratio
›
›
›
›
›
›
›
›
›
Fixed Asset Turnover Ratio,
Return on Total Resources
Ratio,
Return on Own Funds
Ratio, Earning per Share
Ratio, Debtors’ Turnover
Ratio, P/E
Current Ratio
Quick Asset Ratio
Proprietary Ratio
Debt Equity Ratio
Gross Profit Ratio
Operating Ratio
Expense Ratio
Net profit Ratio
Stock Turnover Ratio
9. Format of Balance Sheet for Ratio Analysis
LIABILITIES
ASSETS
NET WORTH/EQUITY/OWNED FUNDS
› Share Capital/ Partner’s Capital/ Paid up Capital/
Owners Funds
› Reserves ( General, Capital, Revaluation & Other
Reserves)
› Credit Balance in P&L A/c
FIXED ASSETS : LAND & BUILDING, PLANT &
MACHINERIES
› Original Value Less Depreciation
LONG TERM LIABILITIES/ BORROWED FUNDS :
› Term Loans (Banks & Institutions)
NON CURRENT ASSETS
› Investments in quoted shares & securities
› Old stocks or old/ disputed book debts
› Long Term Security Deposits
› Other Misc. assets which are not current or fixed in nature
› Debentures/Bonds, Unsecured Loans, Fixed Deposits,
Other Long Term Liabilities
CURRENT LIABILTIES
› Bank Working Capital Limits such as CC/ OD/ Bills/
Export Credit
› Sundry/ Trade Creditors/ Creditors/ Bills Payable, Short
duration loans or deposits
› Expenses payable & provisions against various items
› Net Value or Book Value or Written down value
CURRENT ASSETS :
Cash & Bank Balance, Marketable/ quoted Govt. or other
securities, Book Debts/ Sundry Debtors, Bills Receivables,
Stocks & inventory (RM,SIP,FG) Stores & Spares, Advance
Payment of Taxes, Prepaid expenses, Loans and Advances
recoverable within 12 months
INTANGIBLE ASSETS
Patent, Goodwill, Debit balance in P&L A/c, Preliminary or
Preoperative expenses
10. Some important notes
› Liabilities have Credit balance and Assets have Debit balance
› Current Liabilities are those which have either become due for payment or shall fall due for
payment within 12 months from the date of Balance Sheet
› Current Assets are those which undergo change in their shape/form within 12 months.
These are also called Working Capital or Gross Working Capital
› Net Worth & Long Term Liabilities are also called Long Term Sources of Funds
› Current Liabilities are known as Short Term Sources of Funds
› Long Term Liabilities & Short Term Liabilities are also called Outside Liabilities
› Current Assets are Short Term Use of Funds
11. Some important notes
› Assets other than Current Assets are Long Term Use of Funds
› Instalments of Term Loan Payable in 12 months are to be taken as Current Liability
only for Calculation of Current Ratio & Quick Ratio.
› If there is profit it shall become part of Net Worth under the head Reserves and if
there is loss it will become part of Intangible Assets
› Investments in Govt. Securities to be treated current only if these are marketable
and due. Investments in other securities are to be treated Current if they are
quoted. Investments in allied / associate / sister units or firms to be treated as Noncurrent.
› Bonus Shares as issued by capitalization of General reserves and as such do not
affect the Net Worth. With Rights Issue, change takes place in Net Worth and
Current Ratio.
12. Ratio analysis
Ratio analysis is a tool which enables the banker or lender to arrive at the following factors
:
1. Liquidity – the ability of the firm to pay its way
2. Investment / Shareholders – information to enable decisions to be made on the extent
of the risk and the earning potential of a business investment
3. Gearing – information on the relationship between the exposure of the business to
loans as opposed to share capital
4. Profitability – how effective the firm is at generating profits given sales and or its capital
assets
5. Financial – the rate at which the company sells its stock and the efficiency with which it
uses its assets
13. Liquidity Ratios
› Liquidity Ratios : measure a firm’s ability to meet its financial obligations. The overall health
of a firm has traditionally been measured by these ratios.
› Current Ratio :
Total Current Assets .
Total Current Liabilities
If the Current Assets and Current Liabilities of a concern are
Rs.4,00,000 and Rs.2,00,000 respectively,
then the Current Ratio will be : Rs.4,00,000/Rs.2,00,000 = 2 : 1
The ideal Current Ratio preferred by Banks is 1.33 : 1
› Acid Test ration Or Quick Ratio :
It is the ratio between Quick Current, Assets and Current Liabilities.
The ratio should be at least equal to 1.
› Quick Ratio
: Cash and Equivalents – Inventory
Total Current Liabilities
14. Leverage / Solvency / Profitability Ratios
› Leverage of a firm: Proportion of its long term liabilities that are debts
› Debt/Equity ratio:
Long term Debt .
Shareholders’ Funds
For instance, if the Firm is having the following :
Capital
= Rs. 200 Lacs
Free Reserves & Surplus = Rs. 300 Lacs
Long Term Loans/Liabilities = Rs. 800 Lacs
Debt Equity Ratio will be
= 800/500 i.e. 1.6 : 1
› Debt to Assets: (Debts /Total Assets) X 100
15. Asset Utilization Ratios (AUR)/Capital
structure
› Return to Total Assets: (Net Profit /Total Assets) X 100
› Return on Capital Employed (ROCE) :
(Net Profit / Capital Employed) X 100
OR
Net Profit before Interest and tax / Capital Employed X 100
– Average Capital Employed is the average of the equity share capital and long
term funds provided by the owners and the creditors of the firm at the beginning
and end of the accounting period.
› Return on Shareholders’ Equity (ROE) :
Net Profit / Shareholders Funds X 100
16. Market Value /Investment /Valuation Ratios)
› EPS (Earning Per Share) :
(Net Profit – Preference Dividend)
No. of equity Shares
› P/E : Market Price / Earnings Per Share :
Market Price of Share
EPS
› Earning Yields : (EPS / Market Price) X 100
17. Management / Turnover / Financial Ratios
› Sales / Inventory :
High and low turnover relative to the industry could mean either poor inventory
management (high turnover) or poor utilization of related resources (low turnover).
› Interest Coverage : (PBIT : Interest + Income Tax+ Net Profit) / Interest )
› Fixed Charge Coverage : PBIT / (Interest + Preference Dividend)
› Stock Turn Over : Cost of Goods Sold / Average Inventories
› Debtors Turn Over : Credit Sales / Debtors
› Average Collection Period : 360 days / Debtors Turnover
18. Ratio Analysis - Assignments
› Compare the performance of the company for three/five
successive years
› The absolute numbers change so compare ratios
› Compare two companies of differing size but from the
same industry, e.g., HUL and Godrej
› Calculate industry-wide numbers (net profit margins for
consumer-able products )
19. Assignment - Undertaken
We have compared balance sheets / Profit and loss account
statements of two companies viz. Hindustan Unilever Ltd.
and Godrej Consumer products.
20. Comparative Financial Analysis
The following are various analysis metrics considered to
compare the performance of HUL and GCPL:› Short term Investment
› Long term Investment
› Short term Lending
› Long term Lending
21. Short Term Investment
Short term investment is the investment wherein it happens the continual
buying and selling of stock of companies. Normally investments are done
for less than a year.
Short term investment includes investment in stocks and other short term
debt. The various ratios and factors to be taken into consideration are:› P/E ratio
› P/BV ratio
› EPS
22. P/E Ratio
The P/E ratio tells us how much an investor in common stock pay per rupee of current earnings'
Computation: PE Ratio = Market Value per share / Earning per share
Interpretation:
A higher P/E ratio means that investors are paying more for each unit of net income, so the stock is more
expensive, that is overvalued, compared to one with a lower P/E ratio
Ratio
Profit Earning Ratio
45
40
35
30
25
20
15
10
5
0
41.15
32.48
26.72
24.44
40.53
27.18
24.77
26.65
21.6
HUL
21.13
GCPL
2008
2009
2010
2011
2012
HUL
26.72
24.44
24.77
26.65
41.15
GCPL
21.6
21.13
32.48
27.18
40.53
Trend Analysis:
P/E ratios for both the companies are increasing with almost equal rate and the absolute values are also more
or less equal. Hence, we can’t conclude anything on the basis of this ratio alone.
23. P/BV Ratio
This ratio is used to compare a stock's market value to its book value.
Computation: Price to Book Value = Market price per share / book value per share
Interpretation:
A lower P/BV ratio could mean that the stock is undervalued. Higher the P/BV ratio better is the shareholders
position in terms of capital gain
Profit Book Value Ratio
35
32.5
30
25.25
Ratio
25
20
23.12
20.16
18.96
15
9.74
10
25.22
6.36
HUL
7.71
6.47
GCPL
5
0
2008
2009
2010
2011
2012
HUL
32.5
25.25
20.16
23.12
25.22
GCPL
18.96
6.36
9.74
7.71
6.47
Trend Analysis:
P/BV ratio of GCPL is 6.46 and it is decreasing but for HUL, it is 25.22 and increasing. So, we can say that
GCPL share is under-valued as compared to HUL. This ratio for GPCL is not too low to get tense about returns
from investment
24. EPS
The earnings per share is a good measure of profitability. It gives a view of the comparative earnings of the
similar firm.
Computation: Earnings per share (EPS) Ratio = (Net profit after interest, tax and Preference dividend) /
of equity shares (common shares)
Interpretation:
Higher the EPS better it is and vice versa. It helps the company in estimating its capacity to pay dividend.
Ratio
EPS
20
18
16
14
12
10
8
6
4
2
0
17.76
11.47
13.44
10.09
8.12
12.45
10.68
6.29
8.05
2008
2009
2010
2011
2012
HUL
8.12
11.47
10.09
10.68
12.45
GCPL
6.56
6.29
8.05
13.44
17.76
6.56
Trend Analysis:
EPS has been increasing for both the companies but GCPL is at a better position since the percentage
increase in EPS and the absolute value of EPS is much better as compared to HUL
No.
25. Long Term Investing
Long Term Investing refers to the fact that investment is made for a period greater than 1
year. The various factors to be considered are:› Fixed asset turnover ratio
› Return on Equity
› Return on capital employed
› Operating profit margin
Each of these factors has a role to play in the selection of the company for investment.
However, the degrees to which they affect the returns vary in response to the other
factors as well. Hence, for arriving at a decision for the investment, the entire basket
needs to be considered. Following is a brief discussion for each of them.
26. Fixed-asset Turnover Ratio:
This ratio measures a company's ability to generate net sales from fixed-asset investments - specifically
property, plant and equipment (PP&E) - net of depreciation.
Computation:
Interpretation:
A higher fixed-asset turnover ratio shows that the company has been more effective in using the investment in
fixed assets to generate revenues.
Fixed-asset Turnover Ratio
12
9.8
10
7.81
7.49
Ratio
8
6
4.6
5.35
6.09
4.18
4
4.73
5.63
6.26
HUL
GCPL
2
0
2008
2009
2010
2011
2012
HUL
9.8
7.81
5.35
5.63
6.26
GCPL
4.6
4.18
4.73
6.09
7.49
Trend Analysis:
The ratio is increasing for both the companies but for GCPL, it is increasing at a higher rate as compared to
HUL, also, the absolute value for GCPL is higher than HUL. So, GCPL is more efficient of the two
27. Return on Equity
The objective of computing this ratio is to find out how efficiently the funds supplied by the suppliers (Equity and
Preference) have been used.
Computation: Return on Equity = Net Income/Shareholder's Equity
Interpretation:
Return on equity measures a corporation's profitability by revealing how much profit a company generates with
the money shareholders have invested. So higher the ROE, better is the performance of the company.
ROE
140.00%
122.91%
121.27%
120.00%
98.47%
Ratio
100.00%
85.25%
87.54%
76.62%
80.00%
60.00%
HUL
30.08%
29.98%
28.36%
23.94%
2008
2009
2010
2011
2012
HUL
122.91%
121.27%
85.25%
87.54%
76.62%
GCPL
98.47%
30.08%
29.98%
28.36%
23.94%
40.00%
GCPL
20.00%
0.00%
Trend Analysis : ROE for both the companies are decreasing but for HUL the absolute value is much higher as
compared to GCPL. Hence, of the two, HUL is a better option.
28. Return on Capital Employed (ROCE)
It is used to find out how efficiently the total assets have been utilized by the management.
Computation: ROCE = EBIT / (Total asset – current liabilities)
Interpretation:
ROCE indicates firm’s ability of generating profit per rupee of total assets. So higher the ROCE, better is the
performance of the company
ROCE
160
138.72
140
118.59
106.78
Ratio
120
102.47
100
80
93.08
66.03
HUL
60
32.65
40
35.73
28.43
21.42
GCPL
20
0
2008
2009
2010
2011
2012
HUL
138.72
118.59
106.78
102.47
93.08
GCPL
66.03
32.65
35.73
28.43
21.42
Trend Analysis : ROCE has been decreasing for both the companies but the absolute value of ROCE for HUL
is more than 4 times than GCPL, which shows that HUL is performing much better and hence, it is a better
option
29. Operating Profit Margins
A ratio used to measure a company's pricing strategy and operating efficiency.
Computation: Operating Profit Margin = Operating Income / Net Sales
Interpretation: Operating margin gives analysts an idea of how much a company makes (before interest and
taxes) on each rupee of sales. If a company's margin is increasing, it is earning more per rupee of sales.
Higher the operating profit margin, the better the performance of the company.
Ratio
Operating Profit Margin
0.2
0.18
0.16
0.14
0.12
0.1
0.08
0.06
0.04
0.02
0
0.175
0.136
0.122
0.127
0.128
0.142
0.131
0.12
0.118
0.111
HUL
GCPL
2008
2009
2010
2011
2012
HUL
0.127
0.122
0.136
0.128
0.142
GCPL
0.175
0.118
0.131
0.12
0.111
Trend Analysis : HUL is a better option as its operating margin is high as well as it is increasing from the last
year which is not the case with GCPL
Overall Analysis : After considering all the parameters, we can say that HUL is better for long term investment
since it provides better dividends as compared to GCPL.
30. Short Term Lending
The analysis of short term will depend on how much returns our investment will give us in the
short run. A bank will thus lend only to the company, which is more efficient in running
business, and will have higher sales in the near future that will ensure that the loan will be repaid
on time.
Thus we must analyze why the company is borrowing money and what will be the application of
funds. We must find out whether the company will apply the funds to pay back loans (principal or
interest) or to raise fixed assets or to increase current assets. For short term lending the primary
concern for any bank are the liquidity ratios of the company(s) concerned. So the parameters that
we will take into consideration are:› Current Ratio
› Debtors Turnover Ratio
› Inventory Turnover Ratio
31. Current Ratio
A liquidity ratio that measures a company's ability to pay short-term obligations.
Computation:
Interpretation: The higher the current ratio, the more capable the company is of paying its obligations. It
indicates rupees of current assets available for each rupee of current liability. Traditionally , a current ratio of 2:1
is considered to be satisfactory ratio. A ratio under 1 suggests that the company would be unable to pay off its
obligations if they came due at that point. While this shows the company is not in good financial health, it does
not necessarily mean that it will go bankrupt - as there are many ways to access financing - but it is definitely
not a good sign.
Current Ratio
2.5
2.23
2
Ratio
1.46
1.5
1.2
0.95
1
0.5
0
0.88
1.32
1.01
HUL
0.74
0.85
0.86
2008
2009
2010
2011
2012
HUL
0.85
1.32
1.01
0.88
0.86
GCPL
0.95
2.23
1.46
0.74
GCPL
1.2
Trend Analysis : When we compare the ratios for both the companies, HUL has a lower current ratio as
compared to GCPL. The current ratio for HUL is decreasing as well unlike GCPL. This means that GCPL is a
better company in paying off its obligations
32. Debtors Turnover Ratio
This ratio shows how efficiently the company is making its credit sales and thereby making use of its assets.
Computation: Debtors Turnover ratio = Sales / Average Debtors
Interpretation: A high ratio indicates the company is doing well at lending credit and collecting debts. A low ratio
indicates that company has to look back its credit policies.
Receivable Turnover Ratio
120
100
99.37
81.1
Ratio
80
59.25
60
35.1
40
20
0
41.83
31.41
29.24
30.17
24.28
27.27
HUL
GCPL
2008
2009
2010
2011
2012
HUL
31.41
41.83
29.24
24.28
27.27
GCPL
81.1
99.37
59.25
35.1
30.17
Trend Analysis : In the last 5 years, the ratio has decreased for both the companies but it is decreasing at a
much faster rate for GCPL as compared to HUL. The absolute value of GCPL is, however, marginally more than
HUL. But, according to the trend HUL is doing better at lending credit and collecting debts
33. Inventory Turnover Ratio
This ratio gives number of times inventory is sold i.e. for it is sales to inventory ratio.
Computation: Inventory turnover ratio= sales/inventory
Interpretation: High value of this ratio indicates that a lot of inventory is either being sold or there is ineffective
buying because of low prices. Low value indicates high inventory which is not good. It shows that sales are not
happening.
Inventory Turnover Ratio
12
9.26
10
Ratio
8
7.2
8.2
9.25
7.93
6
4
9.93
8.99
7.91
7.16
5.7
HUL
GCPL
2
0
2008
2009
2010
2011
2012
HUL
7.2
9.26
8.99
7.91
9.93
GCPL
5.7
9.25
7.93
8.2
7.16
Trend Analysis: Inventory turnover ratio of GCPL is low and decreasing from last year but for HUL, it is
increasing which shows that HUL is more efficient in utilizing inventory
Overall Analysis: HUL is better at Receivable turnover ratio and Inventory turnover ratio signifying that for
providing short term loans, HUL is a better company as compared to GCPL
34. Long Term Lending
The main purpose of long term lending is:
› Steady return for a long period of time
› Reduce risk
The lender generally looks at four ratios apart from the above analysis:
› Debt equity ratio
› Interest coverage ratio
› Fixed asset turnover ratio
› ROCE
35. D/E Ratio
It is a measure of a company's financial leverage. It indicates what proportion of equity and debt the company
is using to finance its assets.
Computation: D/E = Total liabilities / Net worth
Interpretation:
While a lower total debt to equity ratio generally reflects conservative financial policies and mean diluted
earnings for equity investors as it probably suggests that the company is not leveraging itself optimally to
achieve growth in return on equity funds.
A high debt/equity ratio generally means that a company has been aggressive in financing its growth with debt.
This can result in volatile earnings as a result of the additional interest expense.
Ratio
D/E Ratio
0.9
0.8
0.7
0.6
0.5
0.4
0.3
0.2
0.1
0
HUL
GCPL
0.83
HUL
0.17
0.1
0.09
0
2008
0
2009
0
0
2010
0
0
0
0
0
0.83
0.1
0
0.17
0.09
0
2011
0
2012
GCPL
36. Interest Coverage Ratio
A ratio used to determine how easily a company can pay interest on outstanding debt.
Computation:
Interpretation: The lower the ratio, the more the company is burdened by debt expense. When a company's
interest coverage ratio is 1.5 or lower, its ability to meet interest expenses may be questionable. An interest
coverage ratio below 1 indicates the company is not generating sufficient revenues to satisfy interest expenses.
Interest Coverage Ratio
14000
12238.54
12000
Ratio
10000
8000
6000
2796.6
4000
2000
0
92.3
25
2008
119.5
28.87
2009
404.94
226.79
2010
86.33
2011
44.17
2012
HUL
92.3
119.5
404.94
12238.54
2796.6
25
28.87
226.79
86.33
44.17
GCPL
Trend Analysis : Interest coverage ratio of HUL is higher than GCPL and it has increased by almost 3000% and
for GCPL, it has increased by almost 90% which clearly tells that HUL will be in better condition to repay
interest on loans.
37. Fixed Asset Turnover Ratio
This ratio measures a company's ability to generate net sales from fixed-asset investments - specifically
property, plant and equipment (PP&E) - net of depreciation.
Computation:
Interpretation: A higher fixed-asset turnover ratio shows that the company has been more effective in using the
investment in fixed assets to generate revenues.
Fixed-asset Turnover Ratio
12
9.8
10
7.81
7.49
Ratio
8
6
4.6
5.35
4.18
4
6.09
5.63
6.26
4.73
GCPL
2
0
HUL
2008
2009
2010
2011
2012
HUL
9.8
7.81
5.35
5.63
6.26
GCPL
4.6
4.18
4.73
6.09
7.49
Trend Analysis : From the last 3 years, the ratio is increasing for both the companies but the increase in
percentage of GCPL as well as absolute value is greater as compared to HUL and hence, GCPL is a better
option
38. Return on Capital Employed
It is a ratio that indicates the efficiency and profitability of a company's capital investments.
Computation: ROCE = EBIT / (Total asset – Current Liabilities)
Interpretation: ROCE measures a corporation's profitability by revealing how much profit a company generates
with respect to the total investment made. So higher the ROCE, better is the performance of the company
ROCE
160
138.72
140
118.59
106.78
Ratio
120
102.47
100
80
93.08
66.03
HUL
60
32.65
35.73
2008
2009
2010
2011
2012
HUL
138.72
118.59
106.78
102.47
93.08
GCPL
66.03
32.65
35.73
28.43
21.42
40
28.43
21.42
GCPL
20
0
Trend Analysis : ROCE has been decreasing for both the companies but the absolute value of ROCE for HUL is
more than 4 times than GCPL, which shows that HUL is performing much better and hence, it is a better option
Overall Analysis : While comparing the two companies, we can see that HUL is better than GCPL for long term
lending on parameters like ROCE, Interest coverage which signify that HUL is doing well in business.