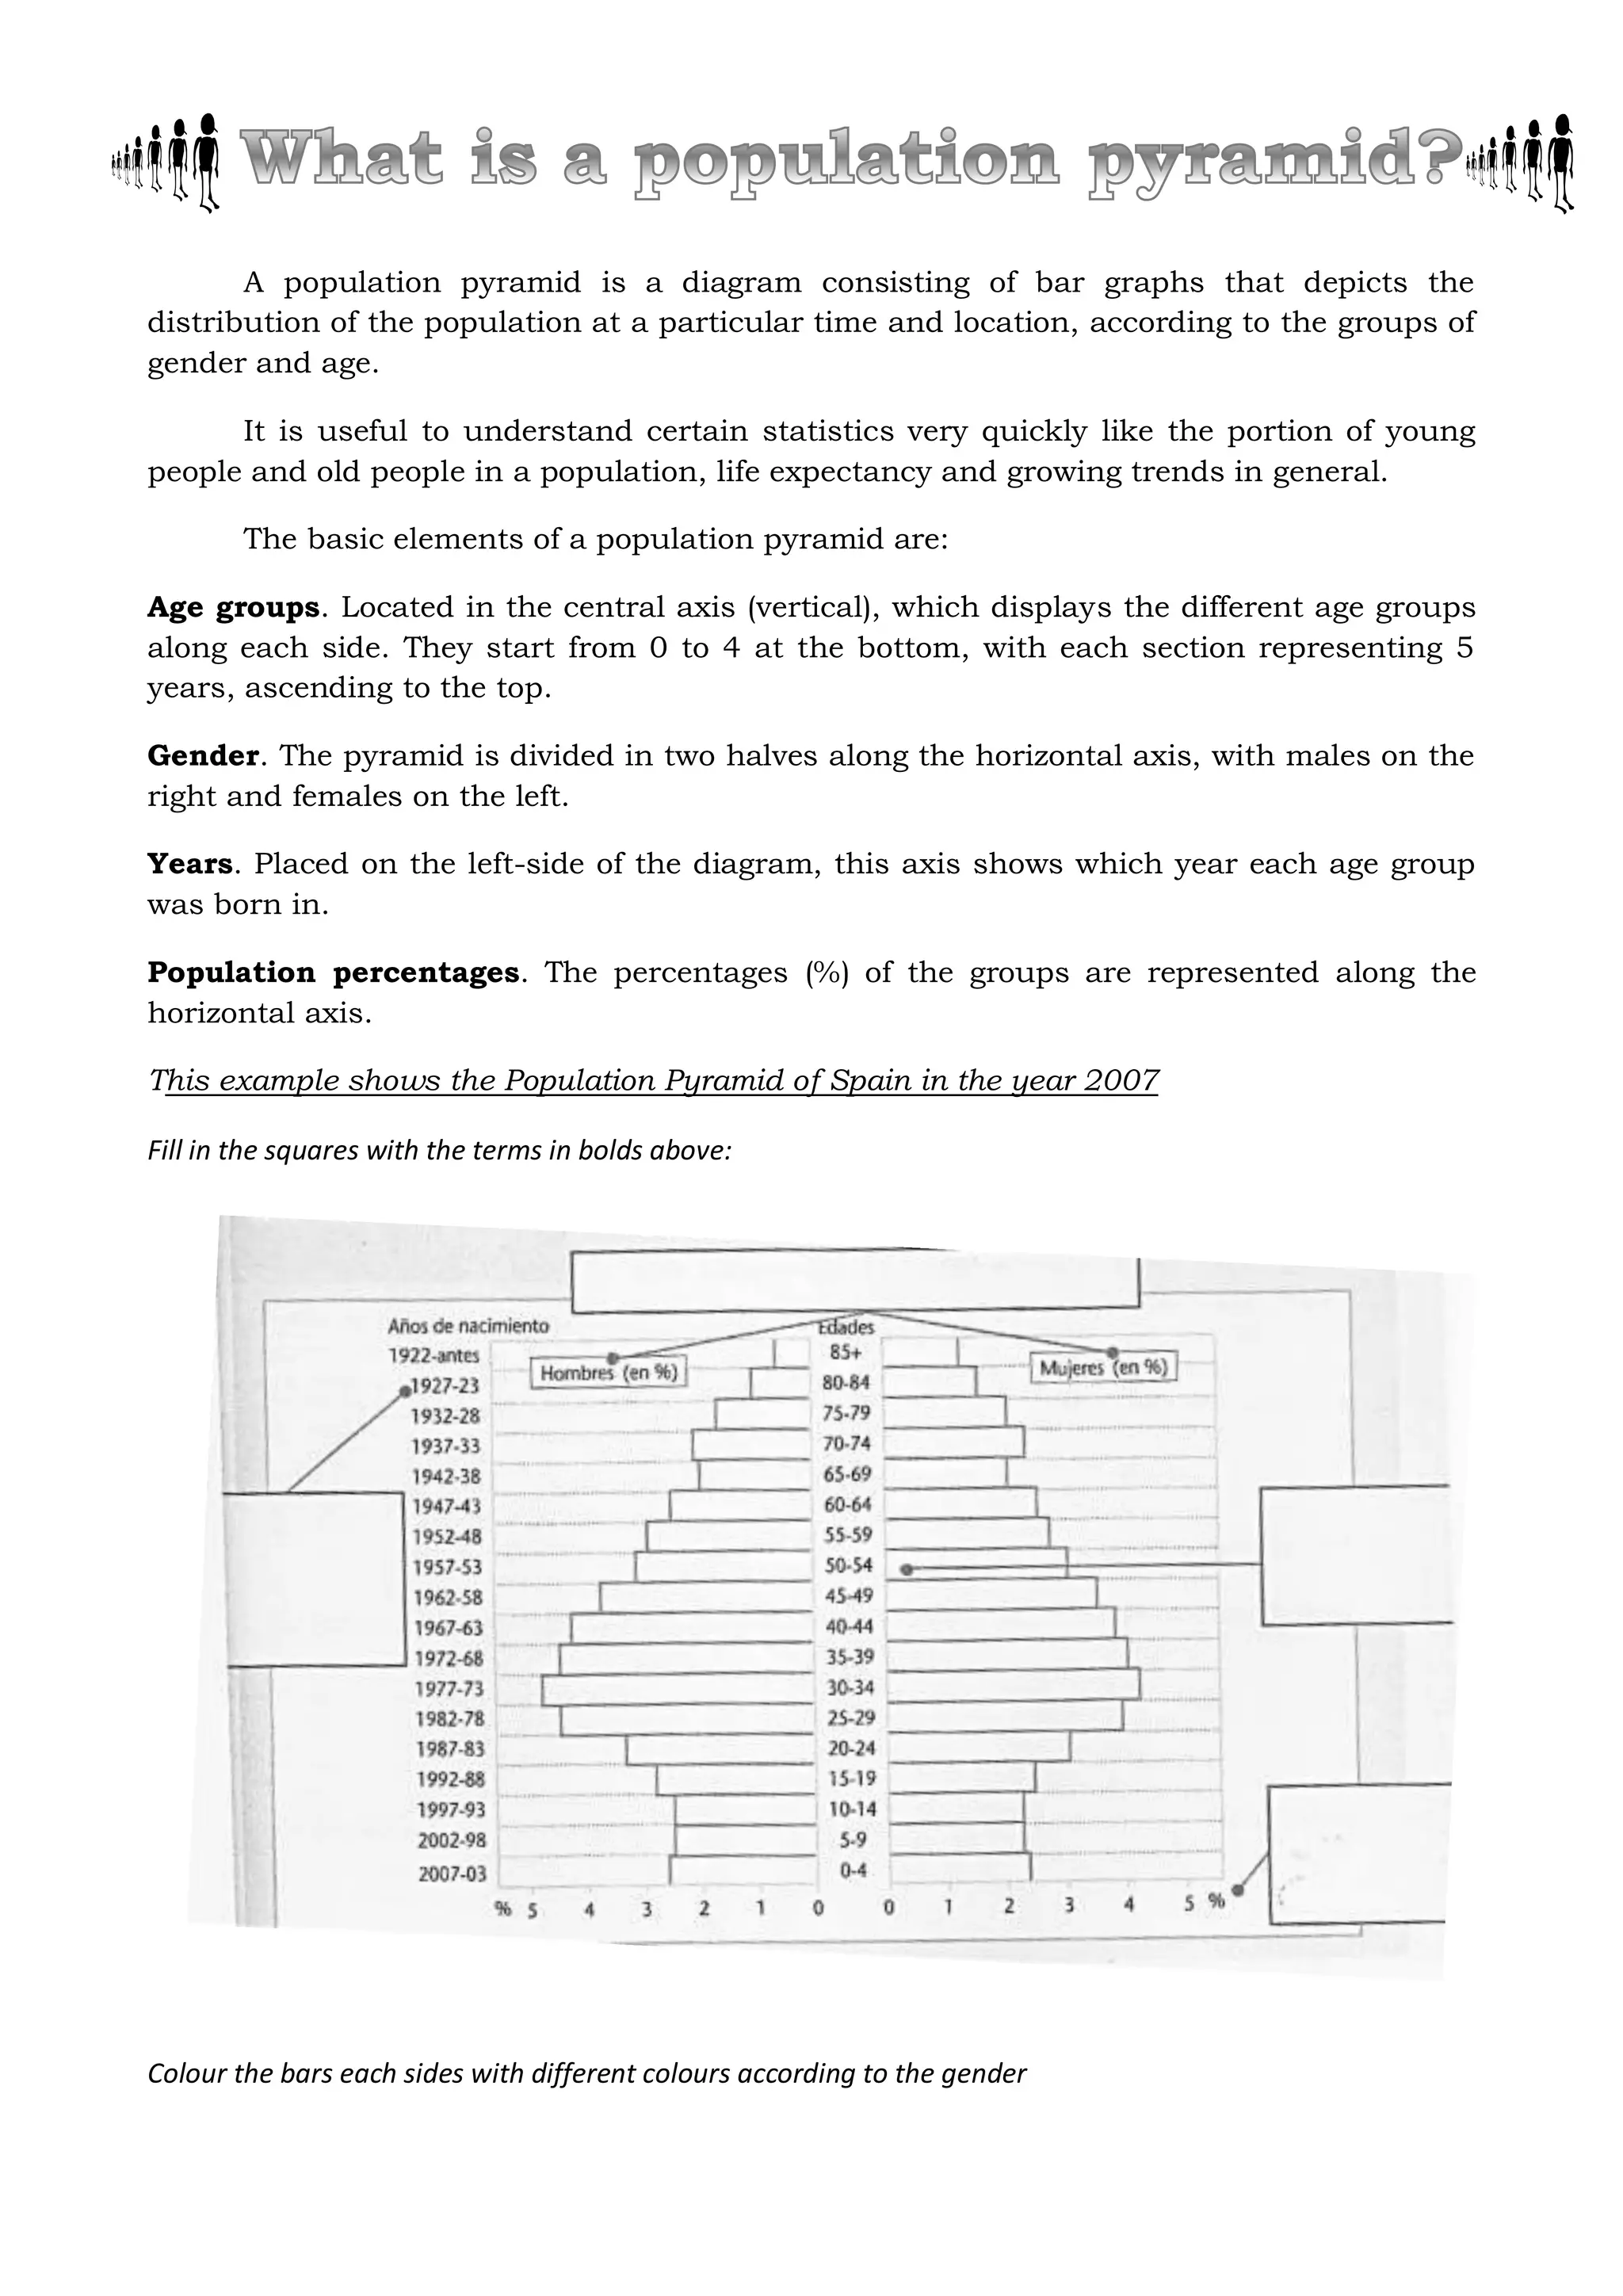
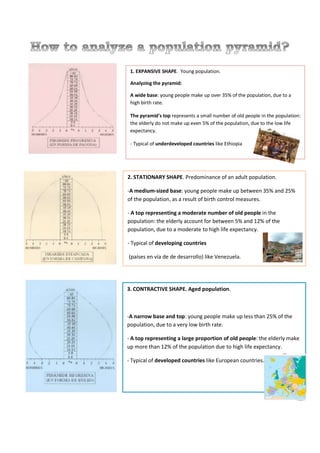
A population pyramid depicts the distribution of a population by age and gender through bar graphs. It shows age groups along the vertical axis separated into 5-year increments, with males on the right side and females on the left. The pyramid illustrates percentages of each group along the horizontal axis and is useful for quickly understanding the proportion of young and old people in a population as well as growth trends. Population pyramids can take expansive, stationary, or contractive shapes indicating characteristics like high birth rates, adult predominance, or an aging population respectively.