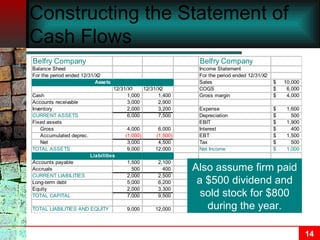
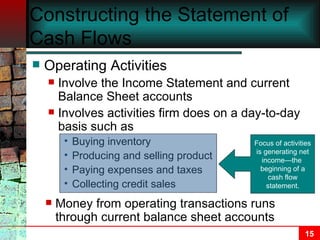
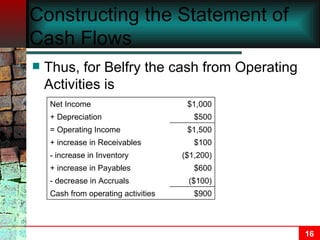
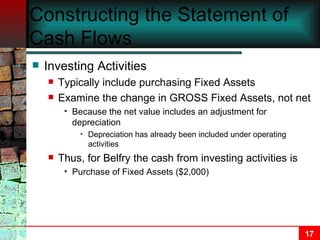
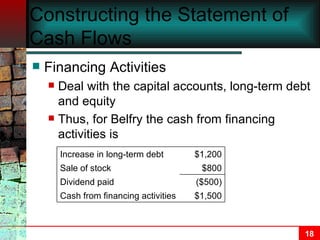
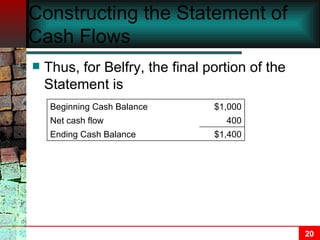
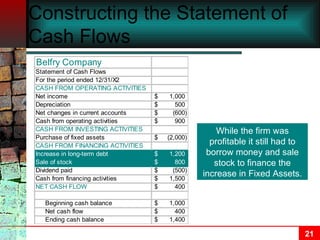
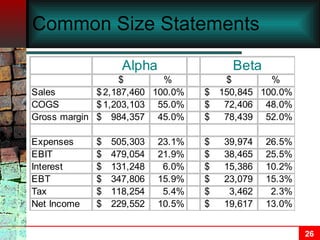
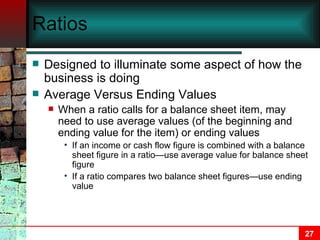
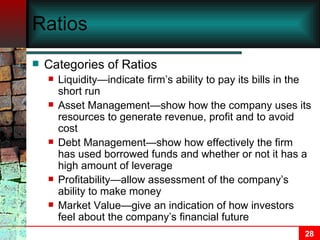
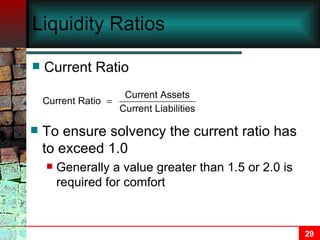
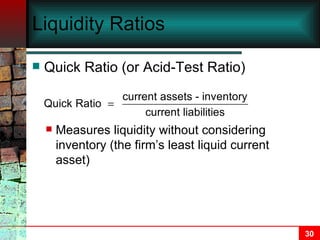
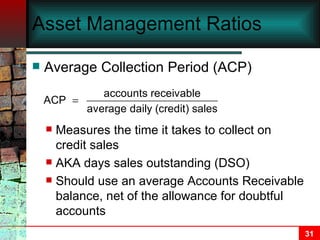
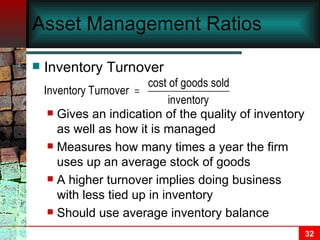
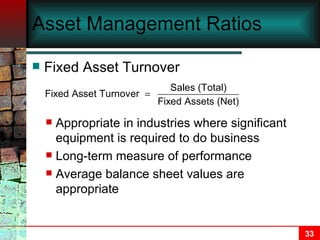
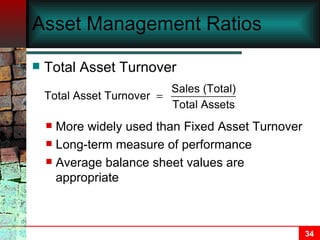
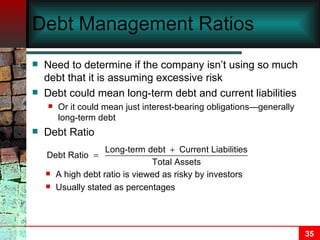
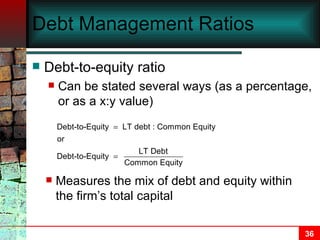
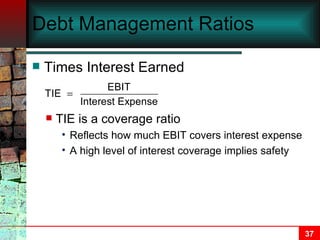
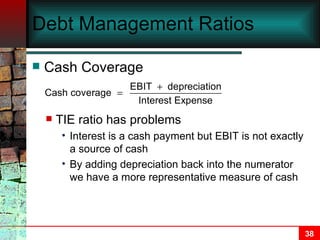
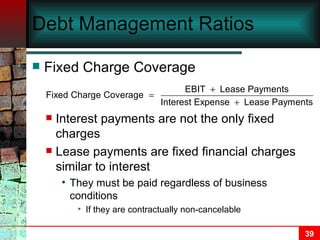
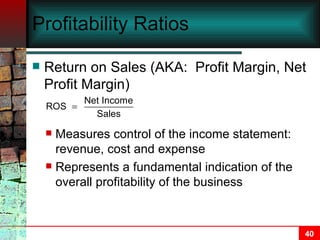
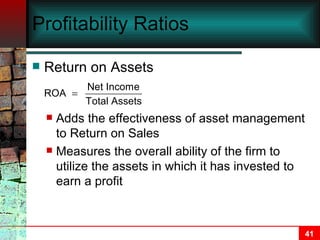
Cash Flows and Financial Analysis Chapter 3
Financial Information—Where Does It Come From,  etc . Financial information is the responsibility of management Created by within-firm accountants Creates a conflict of interest because management wants to portray firm in a positive light Published to a variety of audiences
Users of Financial Information Investors and Financial Analysts Financial analysts interpret information about companies and make recommendations to investors Major part of analyst’s job is to make a careful study of recent financial statements Vendors/Creditors Use financial info to determine if the firm is expected to make good on loans Management Use financial info to pinpoint strengths and weaknesses in operations
Sources of Financial Information Annual Report Required of all publicly traded firms Tend to portray firm in a positive light Also publish a less glossy, more businesslike document called a 10K with the SEC Brokerage firms and investment advisory services (Value Line Investment Survey)
The Orientation of Financial Analysis Accounting is concerned with  creating  financial statements Finance is concerned with using the data contained within financial statements to make decisions The orientation of financial analysis is critical and investigative
The Statement of Cash Flows Income doesn’t represent cash in the firm’s pocket The Statement of Cash Flows (AKA:  Statement of Changes in Financial Position) provides info on the actual movement of cash in and out of the company Constructed from the Balance Sheet and Income Statement
How the Statement of Cash Flows Works—Preliminary Examples Requires two consecutive balance sheets and one income statement from which the statement of cash flows is generated Takes net income for the period and makes adjustments Then takes the balance sheet items and examines the changes
How the Statement of Cash Flows Works—Preliminary Examples Q: Suppose Joe Jones has after-tax income of $50,000 and spends $40,000 on normal living expenses during the year.  Also assume that at the beginning of the year he had a bank balance of $10,000 and no other assets or liabilities.  Further, assume that during the year he bought a new car costing $30,000, financing $25,000 at the bank with a car loan.  At the end of the year he has $15,000 in the bank.  Generate a Statement of Cash Flows for Joe. A: Inflows of cash are known as sources and outflows are known as uses.  The Statement of Cash Flows will show how Joe ended up with $15,000 in his bank account. Joe generated a net source of cash of $10,000, or the difference between his income and normal living expenses.  He also experienced an inflow of $25,000 from the car loan and used $30,000 to buy the car.  Thus, Joe’s Statement of Cash Flows is: Example
How the Statement of Cash Flows Works—Preliminary Examples Example $15,000 Ending cash balance $5,000 Net cash flow $10,000 Beginning cash balance $5,000 Net inflow/(outflow) of cash ($30,000) Use of cash to buy auto (40,000) $50,000 $25,000 Source of cash from loan $10,000 Net source of cash from income Cash used on living expenses Cash income
Business Cash Flows Cash Flows Rules The following rules can be applied to any business’s financial statements Asset increase    use of cash Asset decrease    source of cash Liability increase    source of cash Liability decrease    use of cash
Business Cash Flows Standard Presentation Statement of Cash Flows organized to show Operating activities Running business on day-to-day basis Investing activities When firm buys or sells things to do business Includes long-term purchases and sales of financial assets Financing activities When firm borrows money, pays off loans, sells stock or pays dividends
Figure 3.2:  Business Cash Flows A successful business has to withdraw cash to finance growth and replace worn out assets, pay taxes and for profit.
Figure 3.3:  The Cash Conversion Cycle Product is converted into cash, which is transformed into more product, creating the cash conversion cycle.
Constructing the Statement of Cash Flows Also assume firm paid a $500 dividend and sold stock for $800 during the year.
Constructing the Statement of Cash Flows Operating Activities Involve the Income Statement and current Balance Sheet accounts Involves activities firm does on a day-to-day basis such as Buying inventory Producing and selling product Paying expenses and taxes Collecting credit sales Focus of activities is generating net income—the  beginning of a cash flow statement. Money from operating transactions runs through current balance sheet accounts
Constructing the Statement of Cash Flows Thus, for Belfry the cash from Operating Activities is $900 Cash from operating activities ($100) - decrease in Accruals $600 + increase in Payables ($1,200) - increase in Inventory $100 $1,500 $500 $1,000 + increase in Receivables = Operating Income + Depreciation Net Income
Constructing the Statement of Cash Flows Investing Activities Typically include purchasing Fixed Assets Examine the change in GROSS Fixed Assets, not net Because the net value includes an adjustment for depreciation Depreciation has already been included under operating activities Thus, for Belfry the cash from investing activities is Purchase of Fixed Assets ($2,000)
Constructing the Statement of Cash Flows Financing Activities Deal with the capital accounts, long-term debt and equity Thus, for Belfry the cash from financing activities is $1,500 ($500) $800 $1,200 Cash from financing activities Dividend paid Sale of stock Increase in long-term debt
Constructing the Statement of Cash Flows The Equity and Cash Accounts The change in equity is not included because the changes are reflected elsewhere in the Statement of Cash Flows Net Income is included in Cash Flows from Operations Sale of stock and dividends are considered under financing activities The change in the cash account isn’t considered because the sum of cash flows from operations, financing activities and investing activities must equal the change in the cash account
Constructing the Statement of Cash Flows Thus, for Belfry, the final portion of the Statement is $1,400 400 $1,000 Ending Cash Balance Net cash flow Beginning Cash Balance
Constructing the Statement of Cash Flows While the firm was profitable it still had to borrow money and sale stock to finance the increase in Fixed Assets.
Free Cash Flows Refers to cash generated beyond reinvestment needs Under normal conditions most firms generate positive cash flow from operations Some of these funds are used to maintain long-run competitive position Replace worn-out fixed assets Pay dividends on Preferred Stock
Ratio Analysis Used to highlight different areas of performance Involves taking sets of numbers from the financial statement and forming ratios with them
Comparisons Ratios when examined separately don’t convey much information History—examine trends (how the value has changed over time) Competition—compare with other firms in the same industry Budget—compare actual values with expected or desired values
Common Size Statements First step in a financial analysis is usually the calculation of a common size statement Common size income statement Presents each line as a percent of revenue Common size balance sheet Presents each line as a percent of total assets
Common Size Statements
Ratios Designed to illuminate some aspect of how the business is doing Average Versus Ending Values When a ratio calls for a balance sheet item, may need to use average values (of the beginning and ending value for the item) or ending values If an income or cash flow figure is combined with a balance sheet figure in a ratio—use average value for balance sheet figure If a ratio compares two balance sheet figures—use ending value
Ratios Categories of Ratios Liquidity—indicate firm’s ability to pay its bills in the short run Asset Management—show how the company uses its resources to generate revenue, profit and to avoid cost Debt Management—show how effectively the firm has used borrowed funds and whether or not it has a high amount of leverage Profitability—allow assessment of the company’s ability to make money Market Value—give an indication of how investors feel about the company’s financial future
Liquidity Ratios Current Ratio To ensure solvency the current ratio has to exceed 1.0 Generally a value greater than 1.5 or 2.0 is required for comfort
Liquidity Ratios Quick Ratio (or Acid-Test Ratio) Measures liquidity without considering inventory (the firm’s least liquid current asset)
Asset Management Ratios Average Collection Period (ACP) Measures the time it takes to collect on credit sales AKA days sales outstanding (DSO) Should use an average Accounts Receivable balance, net of the allowance for doubtful accounts
Asset Management Ratios Inventory Turnover Gives an indication of the quality of inventory as well as how it is managed Measures how many times a year the firm uses up an average stock of goods A higher turnover implies doing business with less tied up in inventory Should use average inventory balance
Asset Management Ratios Fixed Asset Turnover Appropriate in industries where significant equipment is required to do business Long-term measure of performance Average balance sheet values are appropriate
Asset Management Ratios Total Asset Turnover More widely used than Fixed Asset Turnover Long-term measure of performance Average balance sheet values are appropriate
Debt Management Ratios Need to determine if the company isn’t using so much debt that it is assuming excessive risk Debt could mean long-term debt and current liabilities  Or it could mean just interest-bearing obligations—generally long-term debt Debt Ratio A high debt ratio is viewed as risky by investors Usually stated as percentages
Debt Management Ratios Debt-to-equity ratio Can be stated several ways (as a percentage, or as a x:y value) Measures the mix of debt and equity within the firm’s total capital
Debt Management Ratios Times Interest Earned TIE is a coverage ratio Reflects how much EBIT covers interest expense A high level of interest coverage implies safety
Debt Management Ratios Cash Coverage TIE ratio has problems Interest is a cash payment but EBIT is not exactly a source of cash By adding depreciation back into the numerator we have a more representative measure of cash
Debt Management Ratios Fixed Charge Coverage Interest payments are not the only fixed charges Lease payments are fixed financial charges similar to interest They must be paid regardless of business conditions If they are contractually non-cancelable
Profitability Ratios Return on Sales (AKA:  Profit Margin, Net Profit Margin) Measures control of the income statement:  revenue, cost and expense Represents a fundamental indication of the overall profitability of the business
Profitability Ratios Return on Assets Adds the effectiveness of asset management to Return on Sales Measures the overall ability of the firm to utilize the assets in which it has invested to earn a profit
Profitability Ratios Return on Equity Adds the effect of borrowing to ROA Measures the firm’s ability to earn a return on the owners’ invested capital If the firm has substantial debt, ROE tends to be higher than ROA in good times and lower in bad times
Market Value Ratios Price/Earnings Ratio (PE Ratio) An indication of the value the stock market places on a company Tells how much investors are willing to pay for a dollar of the firm’s earnings A firm’s P/E is primarily a function of its expected growth
Market Value Ratios Market-to-Book Value Ratio A healthy company is expected to have a market value greater than its book value Known as the going concern value of the firm Idea is that the combination of assets and human resources will create an company able to generate future earnings worth more than the assets alone today A value less than 1.0 indicates a poor outlook for the company’s future
Du Pont Equations Ratio measures are not entirely independent Performance on one is sometimes tied to performance on others Du Pont equations express relationships between ratios that give insights into successful operation
Du Pont Equations Du Pont equation involves ROE, which can be written several ways: States that to run a business well, a firm must manage costs and expenses as well as generate lots of sales per dollar of assets.
Du Pont Equations Extended Du Pont equation states ROE in terms of other ratios Related to the proportion to which the firm is financed by other people’s money as opposed to owner’s money.
Du Pont Equations Extended Du Pont equation states that the operation of a business is reflected in its ROE However, this result—good or bad—can be multiplied by borrowing The way you finance a business can exaggerate the results from operations The Du Pont equations can be used to isolate problems
Sources of Comparative Information Generally compare a firm to an industry average Dun and Bradstreet publishes  Industry Norms and Key Business Ratios Robert Morris Associates publishes  Statement Studies U.S. Commerce Department publishes  Quarterly Financial Report Value Line   provides industry profiles and individual company reports
Limitations/Weaknesses of Ratio Analysis Ratio analysis is not an exact science and requires judgment and experienced interpretation Examples of significant problems Diversified companies—because the interpretation of ratios is dependent upon industry norms, comparing conglomerates can be problematic Window dressing—companies attempt to make balance sheet items look better than they would otherwise through improvements that don’t last Accounting principles differ—similar companies may report the same thing differently, making their financial results artificially dissimilar Inflation may distort numbers

Chapter 03 Cash Flows & Financial Analysis

  • 1.
    Cash Flows andFinancial Analysis Chapter 3
  • 2.
    Financial Information—Where DoesIt Come From, etc . Financial information is the responsibility of management Created by within-firm accountants Creates a conflict of interest because management wants to portray firm in a positive light Published to a variety of audiences
  • 3.
    Users of FinancialInformation Investors and Financial Analysts Financial analysts interpret information about companies and make recommendations to investors Major part of analyst’s job is to make a careful study of recent financial statements Vendors/Creditors Use financial info to determine if the firm is expected to make good on loans Management Use financial info to pinpoint strengths and weaknesses in operations
  • 4.
    Sources of FinancialInformation Annual Report Required of all publicly traded firms Tend to portray firm in a positive light Also publish a less glossy, more businesslike document called a 10K with the SEC Brokerage firms and investment advisory services (Value Line Investment Survey)
  • 5.
    The Orientation ofFinancial Analysis Accounting is concerned with creating financial statements Finance is concerned with using the data contained within financial statements to make decisions The orientation of financial analysis is critical and investigative
  • 6.
    The Statement ofCash Flows Income doesn’t represent cash in the firm’s pocket The Statement of Cash Flows (AKA: Statement of Changes in Financial Position) provides info on the actual movement of cash in and out of the company Constructed from the Balance Sheet and Income Statement
  • 7.
    How the Statementof Cash Flows Works—Preliminary Examples Requires two consecutive balance sheets and one income statement from which the statement of cash flows is generated Takes net income for the period and makes adjustments Then takes the balance sheet items and examines the changes
  • 8.
    How the Statementof Cash Flows Works—Preliminary Examples Q: Suppose Joe Jones has after-tax income of $50,000 and spends $40,000 on normal living expenses during the year. Also assume that at the beginning of the year he had a bank balance of $10,000 and no other assets or liabilities. Further, assume that during the year he bought a new car costing $30,000, financing $25,000 at the bank with a car loan. At the end of the year he has $15,000 in the bank. Generate a Statement of Cash Flows for Joe. A: Inflows of cash are known as sources and outflows are known as uses. The Statement of Cash Flows will show how Joe ended up with $15,000 in his bank account. Joe generated a net source of cash of $10,000, or the difference between his income and normal living expenses. He also experienced an inflow of $25,000 from the car loan and used $30,000 to buy the car. Thus, Joe’s Statement of Cash Flows is: Example
  • 9.
    How the Statementof Cash Flows Works—Preliminary Examples Example $15,000 Ending cash balance $5,000 Net cash flow $10,000 Beginning cash balance $5,000 Net inflow/(outflow) of cash ($30,000) Use of cash to buy auto (40,000) $50,000 $25,000 Source of cash from loan $10,000 Net source of cash from income Cash used on living expenses Cash income
  • 10.
    Business Cash FlowsCash Flows Rules The following rules can be applied to any business’s financial statements Asset increase  use of cash Asset decrease  source of cash Liability increase  source of cash Liability decrease  use of cash
  • 11.
    Business Cash FlowsStandard Presentation Statement of Cash Flows organized to show Operating activities Running business on day-to-day basis Investing activities When firm buys or sells things to do business Includes long-term purchases and sales of financial assets Financing activities When firm borrows money, pays off loans, sells stock or pays dividends
  • 12.
    Figure 3.2: Business Cash Flows A successful business has to withdraw cash to finance growth and replace worn out assets, pay taxes and for profit.
  • 13.
    Figure 3.3: The Cash Conversion Cycle Product is converted into cash, which is transformed into more product, creating the cash conversion cycle.
  • 14.
    Constructing the Statementof Cash Flows Also assume firm paid a $500 dividend and sold stock for $800 during the year.
  • 15.
    Constructing the Statementof Cash Flows Operating Activities Involve the Income Statement and current Balance Sheet accounts Involves activities firm does on a day-to-day basis such as Buying inventory Producing and selling product Paying expenses and taxes Collecting credit sales Focus of activities is generating net income—the beginning of a cash flow statement. Money from operating transactions runs through current balance sheet accounts
  • 16.
    Constructing the Statementof Cash Flows Thus, for Belfry the cash from Operating Activities is $900 Cash from operating activities ($100) - decrease in Accruals $600 + increase in Payables ($1,200) - increase in Inventory $100 $1,500 $500 $1,000 + increase in Receivables = Operating Income + Depreciation Net Income
  • 17.
    Constructing the Statementof Cash Flows Investing Activities Typically include purchasing Fixed Assets Examine the change in GROSS Fixed Assets, not net Because the net value includes an adjustment for depreciation Depreciation has already been included under operating activities Thus, for Belfry the cash from investing activities is Purchase of Fixed Assets ($2,000)
  • 18.
    Constructing the Statementof Cash Flows Financing Activities Deal with the capital accounts, long-term debt and equity Thus, for Belfry the cash from financing activities is $1,500 ($500) $800 $1,200 Cash from financing activities Dividend paid Sale of stock Increase in long-term debt
  • 19.
    Constructing the Statementof Cash Flows The Equity and Cash Accounts The change in equity is not included because the changes are reflected elsewhere in the Statement of Cash Flows Net Income is included in Cash Flows from Operations Sale of stock and dividends are considered under financing activities The change in the cash account isn’t considered because the sum of cash flows from operations, financing activities and investing activities must equal the change in the cash account
  • 20.
    Constructing the Statementof Cash Flows Thus, for Belfry, the final portion of the Statement is $1,400 400 $1,000 Ending Cash Balance Net cash flow Beginning Cash Balance
  • 21.
    Constructing the Statementof Cash Flows While the firm was profitable it still had to borrow money and sale stock to finance the increase in Fixed Assets.
  • 22.
    Free Cash FlowsRefers to cash generated beyond reinvestment needs Under normal conditions most firms generate positive cash flow from operations Some of these funds are used to maintain long-run competitive position Replace worn-out fixed assets Pay dividends on Preferred Stock
  • 23.
    Ratio Analysis Usedto highlight different areas of performance Involves taking sets of numbers from the financial statement and forming ratios with them
  • 24.
    Comparisons Ratios whenexamined separately don’t convey much information History—examine trends (how the value has changed over time) Competition—compare with other firms in the same industry Budget—compare actual values with expected or desired values
  • 25.
    Common Size StatementsFirst step in a financial analysis is usually the calculation of a common size statement Common size income statement Presents each line as a percent of revenue Common size balance sheet Presents each line as a percent of total assets
  • 26.
  • 27.
    Ratios Designed toilluminate some aspect of how the business is doing Average Versus Ending Values When a ratio calls for a balance sheet item, may need to use average values (of the beginning and ending value for the item) or ending values If an income or cash flow figure is combined with a balance sheet figure in a ratio—use average value for balance sheet figure If a ratio compares two balance sheet figures—use ending value
  • 28.
    Ratios Categories ofRatios Liquidity—indicate firm’s ability to pay its bills in the short run Asset Management—show how the company uses its resources to generate revenue, profit and to avoid cost Debt Management—show how effectively the firm has used borrowed funds and whether or not it has a high amount of leverage Profitability—allow assessment of the company’s ability to make money Market Value—give an indication of how investors feel about the company’s financial future
  • 29.
    Liquidity Ratios CurrentRatio To ensure solvency the current ratio has to exceed 1.0 Generally a value greater than 1.5 or 2.0 is required for comfort
  • 30.
    Liquidity Ratios QuickRatio (or Acid-Test Ratio) Measures liquidity without considering inventory (the firm’s least liquid current asset)
  • 31.
    Asset Management RatiosAverage Collection Period (ACP) Measures the time it takes to collect on credit sales AKA days sales outstanding (DSO) Should use an average Accounts Receivable balance, net of the allowance for doubtful accounts
  • 32.
    Asset Management RatiosInventory Turnover Gives an indication of the quality of inventory as well as how it is managed Measures how many times a year the firm uses up an average stock of goods A higher turnover implies doing business with less tied up in inventory Should use average inventory balance
  • 33.
    Asset Management RatiosFixed Asset Turnover Appropriate in industries where significant equipment is required to do business Long-term measure of performance Average balance sheet values are appropriate
  • 34.
    Asset Management RatiosTotal Asset Turnover More widely used than Fixed Asset Turnover Long-term measure of performance Average balance sheet values are appropriate
  • 35.
    Debt Management RatiosNeed to determine if the company isn’t using so much debt that it is assuming excessive risk Debt could mean long-term debt and current liabilities Or it could mean just interest-bearing obligations—generally long-term debt Debt Ratio A high debt ratio is viewed as risky by investors Usually stated as percentages
  • 36.
    Debt Management RatiosDebt-to-equity ratio Can be stated several ways (as a percentage, or as a x:y value) Measures the mix of debt and equity within the firm’s total capital
  • 37.
    Debt Management RatiosTimes Interest Earned TIE is a coverage ratio Reflects how much EBIT covers interest expense A high level of interest coverage implies safety
  • 38.
    Debt Management RatiosCash Coverage TIE ratio has problems Interest is a cash payment but EBIT is not exactly a source of cash By adding depreciation back into the numerator we have a more representative measure of cash
  • 39.
    Debt Management RatiosFixed Charge Coverage Interest payments are not the only fixed charges Lease payments are fixed financial charges similar to interest They must be paid regardless of business conditions If they are contractually non-cancelable
  • 40.
    Profitability Ratios Returnon Sales (AKA: Profit Margin, Net Profit Margin) Measures control of the income statement: revenue, cost and expense Represents a fundamental indication of the overall profitability of the business
  • 41.
    Profitability Ratios Returnon Assets Adds the effectiveness of asset management to Return on Sales Measures the overall ability of the firm to utilize the assets in which it has invested to earn a profit
  • 42.
    Profitability Ratios Returnon Equity Adds the effect of borrowing to ROA Measures the firm’s ability to earn a return on the owners’ invested capital If the firm has substantial debt, ROE tends to be higher than ROA in good times and lower in bad times
  • 43.
    Market Value RatiosPrice/Earnings Ratio (PE Ratio) An indication of the value the stock market places on a company Tells how much investors are willing to pay for a dollar of the firm’s earnings A firm’s P/E is primarily a function of its expected growth
  • 44.
    Market Value RatiosMarket-to-Book Value Ratio A healthy company is expected to have a market value greater than its book value Known as the going concern value of the firm Idea is that the combination of assets and human resources will create an company able to generate future earnings worth more than the assets alone today A value less than 1.0 indicates a poor outlook for the company’s future
  • 45.
    Du Pont EquationsRatio measures are not entirely independent Performance on one is sometimes tied to performance on others Du Pont equations express relationships between ratios that give insights into successful operation
  • 46.
    Du Pont EquationsDu Pont equation involves ROE, which can be written several ways: States that to run a business well, a firm must manage costs and expenses as well as generate lots of sales per dollar of assets.
  • 47.
    Du Pont EquationsExtended Du Pont equation states ROE in terms of other ratios Related to the proportion to which the firm is financed by other people’s money as opposed to owner’s money.
  • 48.
    Du Pont EquationsExtended Du Pont equation states that the operation of a business is reflected in its ROE However, this result—good or bad—can be multiplied by borrowing The way you finance a business can exaggerate the results from operations The Du Pont equations can be used to isolate problems
  • 49.
    Sources of ComparativeInformation Generally compare a firm to an industry average Dun and Bradstreet publishes Industry Norms and Key Business Ratios Robert Morris Associates publishes Statement Studies U.S. Commerce Department publishes Quarterly Financial Report Value Line provides industry profiles and individual company reports
  • 50.
    Limitations/Weaknesses of RatioAnalysis Ratio analysis is not an exact science and requires judgment and experienced interpretation Examples of significant problems Diversified companies—because the interpretation of ratios is dependent upon industry norms, comparing conglomerates can be problematic Window dressing—companies attempt to make balance sheet items look better than they would otherwise through improvements that don’t last Accounting principles differ—similar companies may report the same thing differently, making their financial results artificially dissimilar Inflation may distort numbers