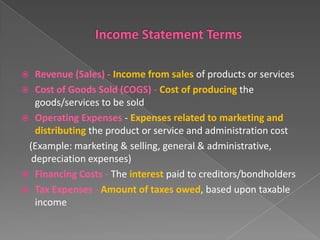
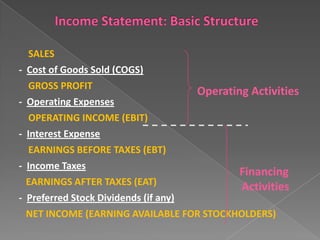
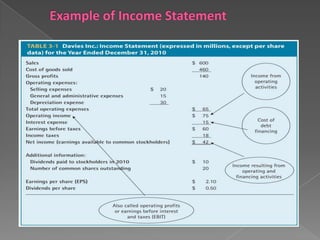
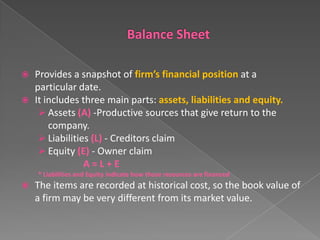
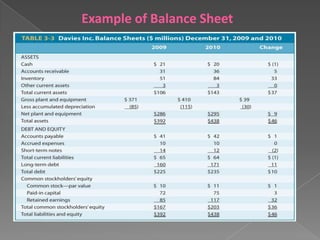
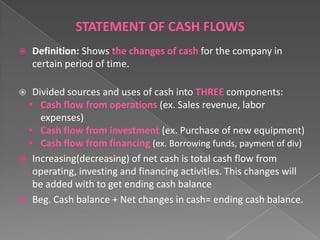
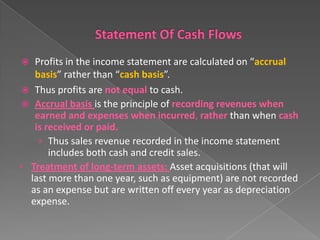
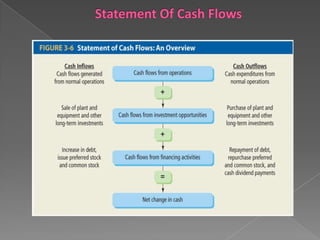
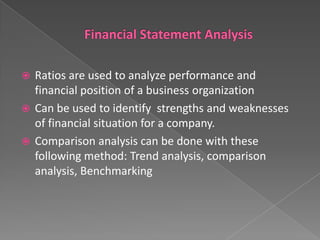
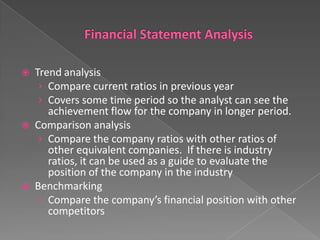
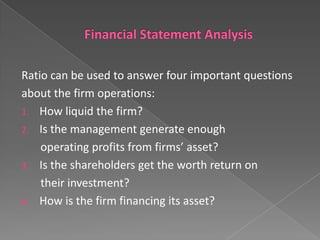
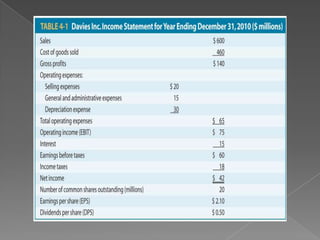
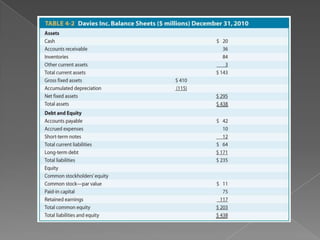
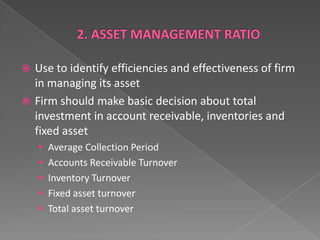
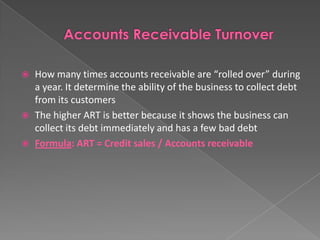
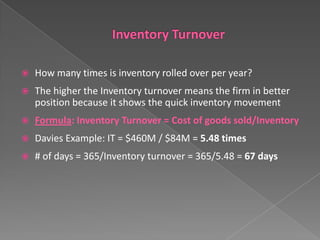
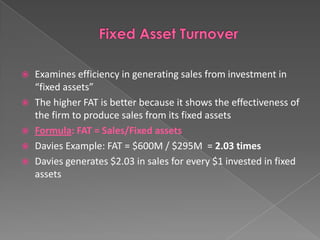
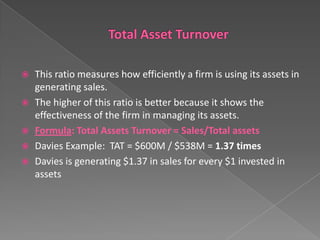
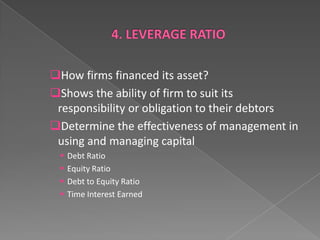
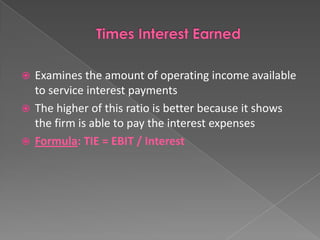
The document discusses the needs and purposes of key financial statements including the income statement, balance sheet, and statement of cash flows. It explains the components and calculations of these statements. It also describes common financial ratios used in analysis of statements, such as liquidity, profitability, asset management, and leverage ratios. These ratios are used to evaluate a firm's performance and financial position over time and in comparison to other companies.
2. Needs of financial statements
Financial statements
› Income Statement
› Balance Sheet
› Statement of Cash Flows
Financial statement analysis
› Liquidity ratios
› Profitability ratios
› Asset management ratios
› Leverage ratios
› Market value ratios
› Limitations of ratio analysis
3.
In Malaysia, Company Act 1965 required companies to
expose their annual report to Company Registrar.
Among the content of the report is financial statement,
covers; income statement, balance sheet, cash flow
statement, and explanation notes about those accounts.
Financial statements users can be classified into 2 types:
• Internal users
• External users
4. •
Also known as Profit and Loss Statement.
•
It measures the results of a firm’s operation over a
specific period.
•
The bottom line of the income statement shows the
firm’s profit or loss for a period.
•
Usefulness of income statement:
-Evaluate the past performance of the firm.
-Provide a basis for predicting future performance.
5.
6. Revenue (Sales) - Income from sales of products or services
Cost of Goods Sold (COGS) - Cost of producing the
goods/services to be sold
Operating Expenses - Expenses related to marketing and
distributing the product or service and administration cost
(Example: marketing & selling, general & administrative,
depreciation expenses)
Financing Costs - The interest paid to creditors/bondholders
Tax Expenses - Amount of taxes owed, based upon taxable
income
7. SALES
- Cost of Goods Sold (COGS)
-
-
GROSS PROFIT
Operating Activities
Operating Expenses
OPERATING INCOME (EBIT)
Interest Expense
EARNINGS BEFORE TAXES (EBT)
Income Taxes
Financing
EARNINGS AFTER TAXES (EAT)
Activities
Preferred Stock Dividends (if any)
NET INCOME (EARNING AVAILABLE FOR STOCKHOLDERS)
8.
9.
Operating income (EBIT) is NOT affected by how the firm is
financed.
Interest expense is subtracted from income before
computing the firm’s tax liability, i.e. Interest is not taxable
expenses.
Firms that has a positive net income does NOT necessarily
mean it has any cash
10.
Provides a snapshot of firm’s financial position at a
particular date.
It includes three main parts: assets, liabilities and equity.
Assets (A) -Productive sources that give return to the
company.
Liabilities (L) - Creditors claim
Equity (E) - Owner claim
A=L+E
* Liabilities and Equity indicate how those resources are financed
The items are recorded at historical cost, so the book value of
a firm may be very different from its market value.
11. Assets
Liabilities (Debt) & Equity
Current Assets
Cash
Accounts Receivable
Inventories
Prepaid Expenses
Fixed Assets
Machinery & Equipment
Buildings and Land
Other Assets
Copyrights, Goodwill &
patents
Current Liabilities
Accounts Payable
Accrued Expenses
Short-term notes
Long-Term Liabilities
Long-term notes
Mortgages
Equity
Preferred Stock
Common Stock (Par value)
Paid in Capital
Retained Earnings
Treasury Stock
TOTAL ASSETS
TOTAL LIABILITIES + EQUITY
12. •
CURRENT ASSETS
The assets will not stay in the business for long (relatively
liquid), or expected to be converted into cash within 12
months.
Cash – currency or coins owned by company either in bank
account or hand.
Marketable security – investment on short term financial
assets with high liquidity. Example: T-bill, bankers
acceptance, etc.
Accounts receivable – payments due from customers who
buy on credit.
Inventory – raw materials, working in process and final
products that will be sold.
Prepaid expenses – Items paid for in advance
13. •
FIXED ASSETS
The assets are held for more than one year. Fixed
assets typically include: plant and machinery,
building and land.
•
OTHER ASSETS
Assets that are neither current assets nor fixed
assets. They may include intangible assets that can’t
be touched or saw physically such as pattern, right
and goodwill.
14.
LIABILITIES are money borrowed and must be repaid at
predetermined date.
CURRENT LIABILITIES (Short-term Liabilities)
Liability that must be paid within 12 months.
Accounts payable (Credit extended by suppliers to a firm when it
purchases inventories)
Accrued expenses (Short term liabilities incurred in the firm’s
operations but not yet paid for)
Short-term notes (Borrowings from a bank or lending institution due
and payable within 12 months)
LONG-TERM LIABILITIES/DEBTS
Covers loan from bank or other sources that provide capital for liability
term more than 1 year.
(Example: buying machinery and building for period of 25 to 30 years
using bank loan)
15. •
EQUITY
Shareholder’s investment in the firm in the form of
preferred stock and common stock.
Preferred Stock (received dividend in fixed amount)
Common Stock
Treasury Stock (stock that has been re-purchased by the
firm)
Retained Earnings (earnings retained and will be reinvest
in the firm)
Paid in Capital (money that a firm gets from potential
investors in addition to the stated value of the stock)
17. STATEMENT OF CASH FLOWS
Definition: Shows the changes of cash for the company in
certain period of time.
Divided sources and uses of cash into THREE components:
Cash flow from operations (ex. Sales revenue, labor
expenses)
Cash flow from investment (ex. Purchase of new equipment)
Cash flow from financing (ex. Borrowing funds, payment of div)
Increasing(decreasing) of net cash is total cash flow from
operating, investing and financing activities. This changes will
be added with to get ending cash balance
Beg. Cash balance + Net changes in cash= ending cash balance.
18. Profits in the income statement are calculated on “accrual
basis” rather than “cash basis”.
Thus profits are not equal to cash.
Accrual basis is the principle of recording revenues when
earned and expenses when incurred, rather than when cash
is received or paid.
› Thus sales revenue recorded in the income statement
includes both cash and credit sales.
• Treatment of long-term assets: Asset acquisitions (that will
last more than one year, such as equipment) are not recorded
as an expense but are written off every year as depreciation
expense.
19.
20. What is our decision?
Maximize shareholders wealth
or
Maximize profit?
21. Ratios are used to analyze performance and
financial position of a business organization
Can be used to identify strengths and weaknesses
of financial situation for a company.
Comparison analysis can be done with these
following method: Trend analysis, comparison
analysis, Benchmarking
22.
Trend analysis
› Compare current ratios in previous year
› Covers some time period so the analyst can see the
achievement flow for the company in longer period.
Comparison analysis
› Compare the company ratios with other ratios of
other equivalent companies. If there is industry
ratios, it can be used as a guide to evaluate the
position of the company in the industry
Benchmarking
› Compare the company’s financial position with other
competitors
23. Ratio can be used to answer four important questions
about the firm operations:
1. How liquid the firm?
2. Is the management generate enough
operating profits from firms’ asset?
3. Is the shareholders get the worth return on
their investment?
4. How is the firm financing its asset?
24.
25.
26. Liquidity is the ability to have cash available when
needed to meet its short term financial obligations
Measured by two approaches:
Current Ratio
Quick Ratio or Acid Test Ratio
27. Current Ratio
a.
measure the relationship between current assets and
current liabilities
The higher of this ratio, it means the business is better
where it has enough liquid asset of its operation
Formula: Current Ratio = CA / CL
Davies Example: CR = $143m / $64m = 2.23 times
Davies has $2.23 in current assets for every $1 in current
liabilities
28. Quick Ratio or Acid Test Ratio
b.
Calculated by deduct the inventory from the current
assets and divided the amount with current liabilities
The higher the answer, the business has enough quick
assets to pay its short term immediately
Formula: Quick Ratio = (CA – Inventory)/ CL
Davies Example: QR = ($143m - $84) / $64m = 0.92 times
IDavies has $0.92 in quick assets for every $1 in current
liabilities
29. Use to identify efficiencies and effectiveness of firm
in managing its asset
Firm should make basic decision about total
investment in account receivable, inventories and
fixed asset
Average Collection Period
Accounts Receivable Turnover
Inventory Turnover
Fixed asset turnover
Total asset turnover
30.
How long does it take to collect the firm’s receivables?
Comparison of this ratio with credit period will measure the
efficiency of the firm to collect its debt
Formula: ACP = Account Receivable
Annual credit sales /365
Davies Example: ACP = $36M / ($600M/365) = 21.95 days
31.
How many times accounts receivable are “rolled over” during
a year. It determine the ability of the business to collect debt
from its customers
The higher ART is better because it shows the business can
collect its debt immediately and has a few bad debt
Formula: ART = Credit sales / Accounts receivable
32.
How many times is inventory rolled over per year?
The higher the Inventory turnover means the firm in better
position because it shows the quick inventory movement
Formula: Inventory Turnover = Cost of goods sold/Inventory
Davies Example: IT = $460M / $84M = 5.48 times
# of days = 365/Inventory turnover = 365/5.48 = 67 days
33. Examines efficiency in generating sales from investment in
“fixed assets”
The higher FAT is better because it shows the effectiveness of
the firm to produce sales from its fixed assets
Formula: FAT = Sales/Fixed assets
Davies Example: FAT = $600M / $295M = 2.03 times
Davies generates $2.03 in sales for every $1 invested in fixed
assets
34. This ratio measures how efficiently a firm is using its assets in
generating sales.
The higher of this ratio is better because it shows the
effectiveness of the firm in managing its assets.
Formula: Total Assets Turnover = Sales/Total assets
Davies Example: TAT = $600M / $538M = 1.37 times
Davies is generating $1.37 in sales for every $1 invested in
assets
35.
Measures a firm’s ability to generate profits relative
to sales, assets and equity
Gross Profit Margin
Operating Profit Margin
Net Profit Margin
Return on Assets
Return on Equity
36.
It looks at cost of goods sold as a percentage of sales. It
shows firm's ability to turn a dollar of sales into profit after
the cost of goods sold has been accounted for.
Formula: GPM = Gross profit/Sales
Davies Example: GPM = $140m / $600m = 0.2333 or 23.33%
37.
OPM examines how effective the company is in managing its
cost of goods sold and operating expenses that determine
the operating profit.
Formula: OPM = Operating profit/Sales
Davies Example: OPM = $75M / $600M = 0.125 or 12.5%
38.
NPM determines profit earns from every dollar of sales after
all expenses, including cost of good sold, sales expenses,
general and admin cost, depreciation, interest and tax
completely paid.
The higher of this ratio, the better because it shows reducing
in expenses or cost in producing sales
Formula: NPM = Net Income /Sales
Davies Example: NPM = $42m / $600m = 0.07 or 7%
39. Return on Asset determine the effectiveness of management
in using their asset to generate income
The higher of this ratio, the better because it shows the firm
is more effective in using their assets
Formula: ROA = Net income / Total Asset
Davies Example: ROA = $42m / $438m = 0.0959 or 9.59%
40.
Return on Equity determine the effectiveness of efficiency of
the firm to generate income for its shareholder. It is
profitability measurement to equity investment in the firm
The higher of this ratio, the better because it shows the firm
is able to produce higher profits to its owners
Formula: ROE = Net income / Total Equity
Davies Example: ROE = $42m / $203m = 20.69%
41. How firms financed its asset?
Shows the ability of firm to suit its
responsibility or obligation to their debtors
Determine the effectiveness of management in
using and managing capital
Debt Ratio
Equity Ratio
Debt to Equity Ratio
Time Interest Earned
42. Debt ratio shows the percentage of firm’s assets that
are financed by debt
Formula: Debt Ratio = Total Debt / Total Asset
43. What percentage of the firm’s assets are financed by
owner?
Formula: Equity ratio = Total owners’ equity
Total assets
44. It measures the percentage of liability covers by
equity
Formula: DTER = Total Debt / Total Owner’s Equity
45. Examines the amount of operating income available
to service interest payments
The higher of this ratio is better because it shows
the firm is able to pay the interest expenses
Formula: TIE = EBIT / Interest
46.
Difficulty in identifying industry categories or finding peers
Published peer group or industry averages are only approximations
Accounting practices differ among firms
Financial ratios can be too high or too low
Industry averages may not provide a desirable target ratio or norm
Difficulty in identifying industry categories or finding peers
Published peer group or industry averages are only approximations
Accounting practices differ among firms
Financial ratios can be too high or too low
Industry averages may not provide a desirable target ratio or norm