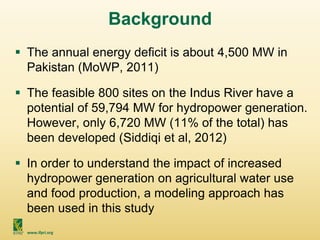
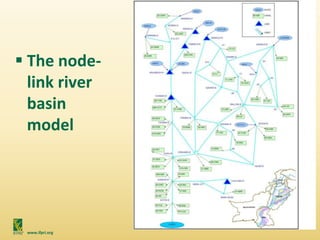
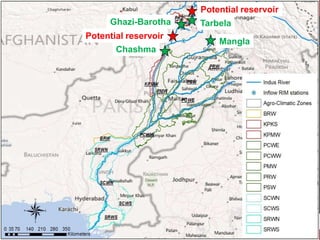
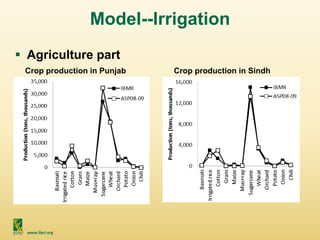
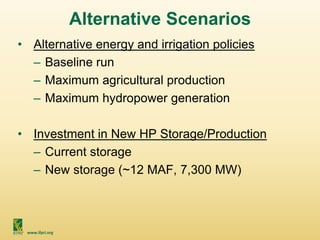
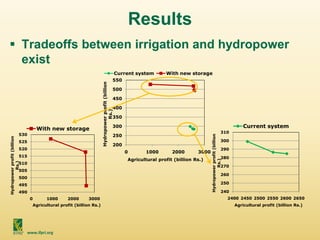
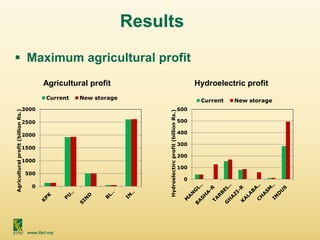
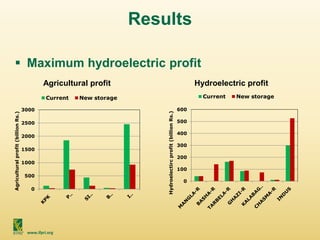
Modeling the water-energy-
food nexus in the Indus River
of Pakistan
Y. C. Ethan Yang, Casey
Brown, Claudia Ringler and
Ghazi Alam
GWSP Conference May 2013
This study is supported by the Pakistan Strategy Support Program (PSSP)
funded by USAID (pssp.ifpri.info)
www.ifpri.org
Background
 The annual energy deficit is about 4,500 MW in
Pakistan (MoWP, 2011)
 The feasible 800 sites on the Indus River have a
potential of 59,794 MW for hydropower generation.
However, only 6,720 MW (11% of the total) has
been developed (Siddiqi et al, 2012)
 In order to understand the impact of increased
hydropower generation on agricultural water use
and food production, a modeling approach has
been used in this study
www.ifpri.org
Daily Power Outages
9
10
10
38
27
72
42
35
39
16
49
18
24
3
9
0 20 40 60 80 100
Overall
Punjab
Sindh
KPK
Percentage of Households
0-6 Hours
7-12 Hours
13-18 Hours
18+ Hours
Source: IFPRI-IDS Household survey
www.ifpri.org
Model
 The Indus Basin Model Revised (IBMR), a flow-
network model coded in GAMS-- has been
modified into a multi-year version–Indus Basin
Model Multi-Year (IBMY) to evaluate the Water-
Food-Energy Nexus in the Indus Basin of Pakistan
 The basin irrigates approximately 18 million ha in
four provinces; most irrigation is d/s of HP in the
basin; officially irrigation has precedence over
energy use
 The model includes the 3 major hydropower
reservoirs: Mangla (1000 MW), Tarbela (3478 MW)
and Chashma (184 MW); and one major run-of-
the-river station: Ghazi-Barotha (1450 MW)
www.ifpri.org
Model
 The node-
link river
basin
model
6/13Department of Civil and Environmental Engineering
IBMR - Modeling structure
Tarbela
Mangla
Ghazi-Barotha
Chashma
Potential reservoir
Potential reservoir
www.ifpri.org
Model
 Objective function
Newly added
www.ifpri.org
Model--Hydropower
 Baseline Setting:
• Inflow: 1961-2010 monthly flow from 9 tributaries
• Reservoir storage and groundwater tables are carried on
to the next year
• Crop price: 2008-09 average price
• Electricity price: 10 Rs. per KWH
www.ifpri.org
Model--Irrigation
 Agriculture part
Crop production in Punjab Crop production in Sindh
www.ifpri.org
Alternative Scenarios
• Alternative energy and irrigation policies
– Baseline run
– Maximum agricultural production
– Maximum hydropower generation
• Investment in New HP Storage/Production
– Current storage
– New storage (~12 MAF, 7,300 MW)
www.ifpri.org
Results
 Tradeoffs between irrigation and hydropower
exist
200
250
300
350
400
450
500
550
0 1000 2000 3000
Hydropowerprofit(billion
Rs.)
Agricultural profit (billion Rs.)
Current system With new storage
490
495
500
505
510
515
520
525
530
0 1000 2000 3000
Hydropowerprofit(billion
Rs.)
Agricultural profit (billion Rs.)
With new storage
240
250
260
270
280
290
300
310
2400 2450 2500 2550 2600 2650
Hydropowerprofit(billion
Rs.)
Agricultural profit (billion Rs.)
Current system
www.ifpri.org
Results
 Maximum agricultural profit
0
500
1000
1500
2000
2500
3000
Agriculturalprofit(billionRs.)
Current New storage
0
100
200
300
400
500
600
Hydroelectircprofit(billionRs.)
Current New storage
Agricultural profit Hydroelectric profit
www.ifpri.org
Results
 Maximum hydroelectric profit
0
500
1000
1500
2000
2500
3000
Agriculturalprofit(billionRs.)
Current New storage
0
100
200
300
400
500
600
Hydroelectircprofit(billionRs.)
Current New storage
Agricultural profit Hydroelectric profit
www.ifpri.org
Conclusion
 Baseline result is close to maximum
agricultural profit which reflects the water
allocation rules in the basin
 Even under current relatively low storage/HP
development and u/s location of HP & d/s
location of irrigation, tradeoffs exist; new
storage could significantly increase tradeoffs
 To increase hydropower production without
jeopardizing irrigation, adding new storage
under the current water allocation scheme is
the most recommended approach
www.ifpri.org
Conclusion
 Model limitations
• We did not model the entire energy market
• We maximized annual hydropower production;
maximizing winter production, where the deficit is
largest, would result in a larger tradeoffs
• While we maximized HP or IRR, we left the rule
curve unchanged. Changes in the rule curve in
favor of HP would change final outcomes
 Future studies
• Changes in HP rule curves
• Climate change impact
• Impact of change in water sharing policies

Modeling the water-energy-food nexus in the Indus River of Pakistan

  • 1.
    Modeling the water-energy- foodnexus in the Indus River of Pakistan Y. C. Ethan Yang, Casey Brown, Claudia Ringler and Ghazi Alam GWSP Conference May 2013 This study is supported by the Pakistan Strategy Support Program (PSSP) funded by USAID (pssp.ifpri.info)
  • 2.
    www.ifpri.org Background  The annualenergy deficit is about 4,500 MW in Pakistan (MoWP, 2011)  The feasible 800 sites on the Indus River have a potential of 59,794 MW for hydropower generation. However, only 6,720 MW (11% of the total) has been developed (Siddiqi et al, 2012)  In order to understand the impact of increased hydropower generation on agricultural water use and food production, a modeling approach has been used in this study
  • 3.
    www.ifpri.org Daily Power Outages 9 10 10 38 27 72 42 35 39 16 49 18 24 3 9 020 40 60 80 100 Overall Punjab Sindh KPK Percentage of Households 0-6 Hours 7-12 Hours 13-18 Hours 18+ Hours Source: IFPRI-IDS Household survey
  • 4.
    www.ifpri.org Model  The IndusBasin Model Revised (IBMR), a flow- network model coded in GAMS-- has been modified into a multi-year version–Indus Basin Model Multi-Year (IBMY) to evaluate the Water- Food-Energy Nexus in the Indus Basin of Pakistan  The basin irrigates approximately 18 million ha in four provinces; most irrigation is d/s of HP in the basin; officially irrigation has precedence over energy use  The model includes the 3 major hydropower reservoirs: Mangla (1000 MW), Tarbela (3478 MW) and Chashma (184 MW); and one major run-of- the-river station: Ghazi-Barotha (1450 MW)
  • 5.
  • 6.
    6/13Department of Civiland Environmental Engineering IBMR - Modeling structure Tarbela Mangla Ghazi-Barotha Chashma Potential reservoir Potential reservoir
  • 7.
  • 8.
    www.ifpri.org Model--Hydropower  Baseline Setting: •Inflow: 1961-2010 monthly flow from 9 tributaries • Reservoir storage and groundwater tables are carried on to the next year • Crop price: 2008-09 average price • Electricity price: 10 Rs. per KWH
  • 9.
    www.ifpri.org Model--Irrigation  Agriculture part Cropproduction in Punjab Crop production in Sindh
  • 10.
    www.ifpri.org Alternative Scenarios • Alternativeenergy and irrigation policies – Baseline run – Maximum agricultural production – Maximum hydropower generation • Investment in New HP Storage/Production – Current storage – New storage (~12 MAF, 7,300 MW)
  • 11.
    www.ifpri.org Results  Tradeoffs betweenirrigation and hydropower exist 200 250 300 350 400 450 500 550 0 1000 2000 3000 Hydropowerprofit(billion Rs.) Agricultural profit (billion Rs.) Current system With new storage 490 495 500 505 510 515 520 525 530 0 1000 2000 3000 Hydropowerprofit(billion Rs.) Agricultural profit (billion Rs.) With new storage 240 250 260 270 280 290 300 310 2400 2450 2500 2550 2600 2650 Hydropowerprofit(billion Rs.) Agricultural profit (billion Rs.) Current system
  • 12.
    www.ifpri.org Results  Maximum agriculturalprofit 0 500 1000 1500 2000 2500 3000 Agriculturalprofit(billionRs.) Current New storage 0 100 200 300 400 500 600 Hydroelectircprofit(billionRs.) Current New storage Agricultural profit Hydroelectric profit
  • 13.
    www.ifpri.org Results  Maximum hydroelectricprofit 0 500 1000 1500 2000 2500 3000 Agriculturalprofit(billionRs.) Current New storage 0 100 200 300 400 500 600 Hydroelectircprofit(billionRs.) Current New storage Agricultural profit Hydroelectric profit
  • 14.
    www.ifpri.org Conclusion  Baseline resultis close to maximum agricultural profit which reflects the water allocation rules in the basin  Even under current relatively low storage/HP development and u/s location of HP & d/s location of irrigation, tradeoffs exist; new storage could significantly increase tradeoffs  To increase hydropower production without jeopardizing irrigation, adding new storage under the current water allocation scheme is the most recommended approach
  • 15.
    www.ifpri.org Conclusion  Model limitations •We did not model the entire energy market • We maximized annual hydropower production; maximizing winter production, where the deficit is largest, would result in a larger tradeoffs • While we maximized HP or IRR, we left the rule curve unchanged. Changes in the rule curve in favor of HP would change final outcomes  Future studies • Changes in HP rule curves • Climate change impact • Impact of change in water sharing policies