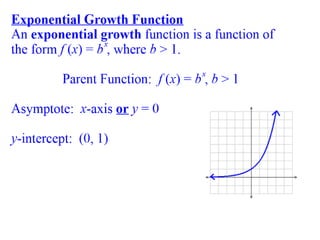
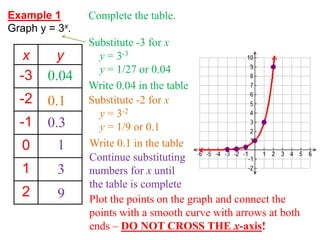
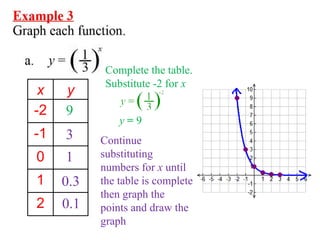
1. The document discusses graphing exponential functions by completing tables of values for functions like y=3^x and y=2x+1, and plotting the points on a graph. It covers exponential growth and decay functions.
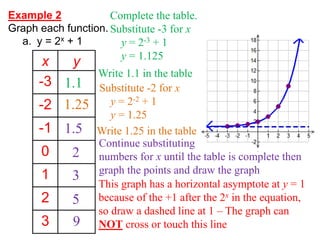
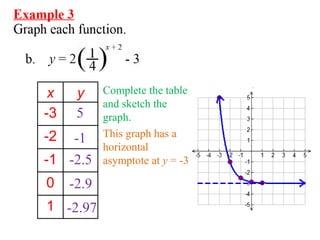
2. Examples show how to graph transformed exponential functions with additions or multiplications like y=2x+1, which has a horizontal asymptote at y=1.
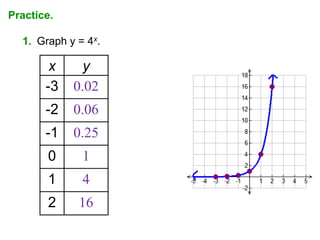
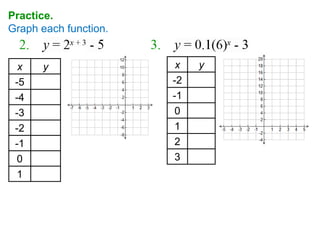
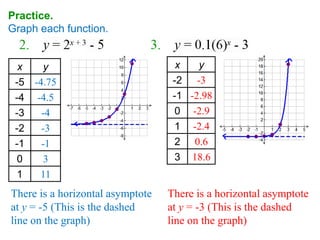
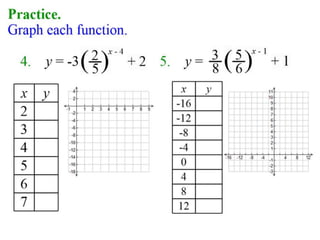
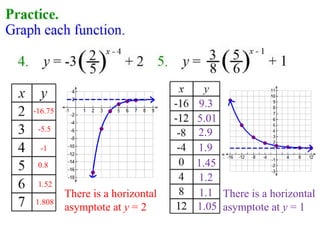
3. Practice problems provide more opportunities to complete tables of values and graph exponential functions, including those with horizontal asymptotes.