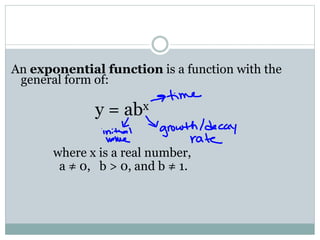
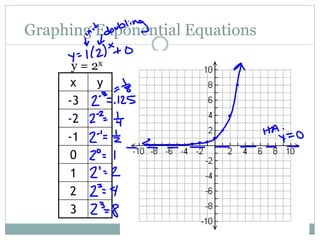
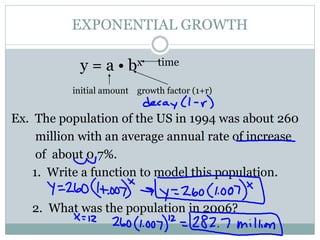
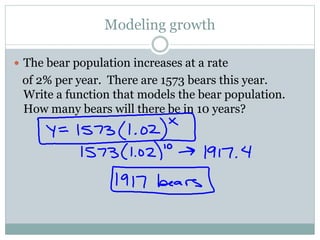
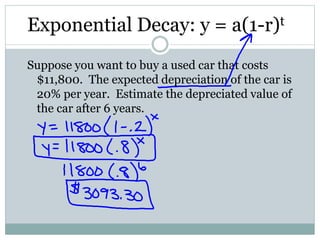
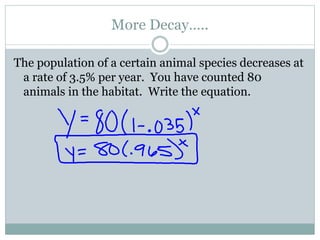
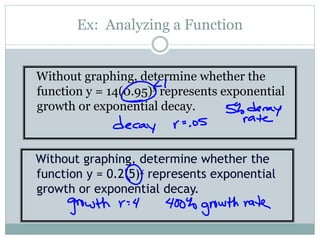
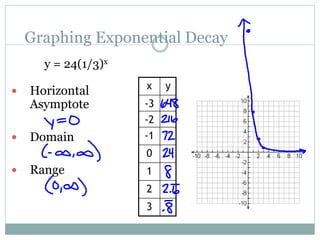
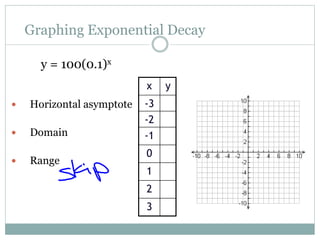
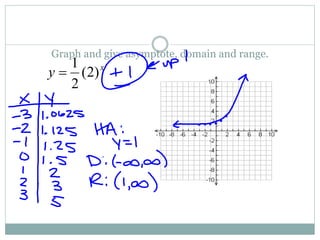
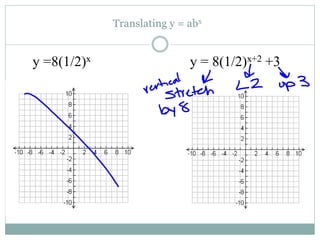
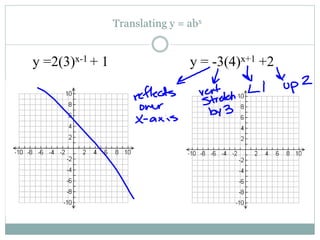
G R A P H I N G E X P O N E N T I A L S A N D L O G S
Day 2
An exponential function is a function with the
general form of:
y = abx
where x is a real number,
a ≠ 0, b > 0, and b ≠ 1.
Graphing Exponential Equations
y = 2x
x y
-3
-2
-1
0
1
2
3
EXPONENTIAL GROWTH
y = a • bx time
initial amount growth factor (1+r)
Ex. The population of the US in 1994 was about 260
million with an average annual rate of increase
of about 0.7%.
1. Write a function to model this population.
2. What was the population in 2006?
Modeling growth
 The bear population increases at a rate
of 2% per year. There are 1573 bears this year.
Write a function that models the bear population.
How many bears will there be in 10 years?
Exponential Decay: y = a(1-r)t
Suppose you want to buy a used car that costs
$11,800. The expected depreciation of the car is
20% per year. Estimate the depreciated value of
the car after 6 years.
More Decay…..
The population of a certain animal species decreases at
a rate of 3.5% per year. You have counted 80
animals in the habitat. Write the equation.
Ex: Analyzing a Function
Without graphing, determine whether the
function y = 14(0.95)x represents exponential
growth or exponential decay.
Without graphing, determine whether the
function y = 0.2(5)x represents exponential
growth or exponential decay.
Graphing Exponential Decay
y = 24(1/3)x
 Horizontal
Asymptote
 Domain
 Range
x y
-3
-2
-1
0
1
2
3
Graphing Exponential Decay
y = 100(0.1)x
 Horizontal asymptote
 Domain
 Range
x y
-3
-2
-1
0
1
2
3
Graph and give asymptote, domain and range.
x
y )2(
2
1

Translating y = abx
y =8(1/2)x y = 8(1/2)x+2 +3
Translating y = abx
y =2(3)x-1 + 1 y = -3(4)x+1 +2
Homework
 Pg. 296 (1-14, 29-34)

Day 2 worked

  • 1.
    G R AP H I N G E X P O N E N T I A L S A N D L O G S Day 2
  • 2.
    An exponential functionis a function with the general form of: y = abx where x is a real number, a ≠ 0, b > 0, and b ≠ 1.
  • 3.
    Graphing Exponential Equations y= 2x x y -3 -2 -1 0 1 2 3
  • 4.
    EXPONENTIAL GROWTH y =a • bx time initial amount growth factor (1+r) Ex. The population of the US in 1994 was about 260 million with an average annual rate of increase of about 0.7%. 1. Write a function to model this population. 2. What was the population in 2006?
  • 5.
    Modeling growth  Thebear population increases at a rate of 2% per year. There are 1573 bears this year. Write a function that models the bear population. How many bears will there be in 10 years?
  • 6.
    Exponential Decay: y= a(1-r)t Suppose you want to buy a used car that costs $11,800. The expected depreciation of the car is 20% per year. Estimate the depreciated value of the car after 6 years.
  • 7.
    More Decay….. The populationof a certain animal species decreases at a rate of 3.5% per year. You have counted 80 animals in the habitat. Write the equation.
  • 8.
    Ex: Analyzing aFunction Without graphing, determine whether the function y = 14(0.95)x represents exponential growth or exponential decay. Without graphing, determine whether the function y = 0.2(5)x represents exponential growth or exponential decay.
  • 9.
    Graphing Exponential Decay y= 24(1/3)x  Horizontal Asymptote  Domain  Range x y -3 -2 -1 0 1 2 3
  • 10.
    Graphing Exponential Decay y= 100(0.1)x  Horizontal asymptote  Domain  Range x y -3 -2 -1 0 1 2 3
  • 11.
    Graph and giveasymptote, domain and range. x y )2( 2 1 
  • 12.
    Translating y =abx y =8(1/2)x y = 8(1/2)x+2 +3
  • 13.
    Translating y =abx y =2(3)x-1 + 1 y = -3(4)x+1 +2
  • 14.
    Homework  Pg. 296(1-14, 29-34)