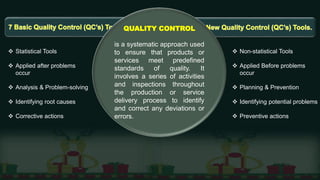
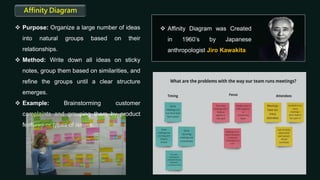
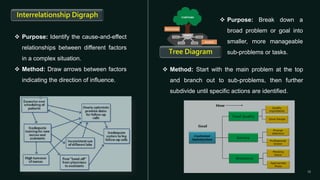
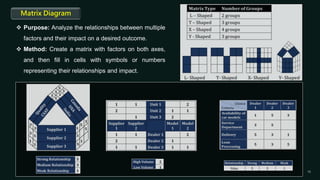
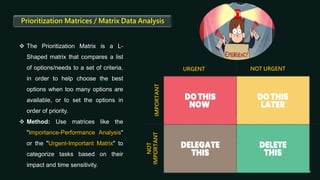
7 Basic QC’s and 7 New QC's (Quality Control) tools.pptx
1. 7 QC’s
and
New QC’s Tools S U J A G . G . G O W D A
B H A R A T H . H . J
H E M A N T H V
A D I T Y A
S U J A Y R A J A R A M N A I K
Sujay. G. Gowda | Bharath. H. J |
Hemanth. V
| Aditya | Sujay Rajaram Naik
Under the guidance : Prof.
Venkatesha
Presented by
Project and Operations
Management
2. QUALITY CONTROL
is a systematic approach used
to ensure that products or
services meet predefined
standards of quality. It
involves a series of activities
and inspections throughout
the production or service
delivery process to identify
and correct any deviations or
errors.
Statistical Tools
Applied after problems
occur
Analysis & Problem-solving
Identifying root causes
Corrective actions
Non-statistical Tools
Applied Before problems
occur
Planning & Prevention
Identifying potential problems
Preventive actions
3. Basic 7 Quality Control Tools (QC’s)
Check sheet
Control chart
Histogram:
Pareto chart
Scatter diagram
Stratification
Ishikawa diagram
New 7 Quality Control Tools (QC’s)
Affinity Diagram
Relationship Diagram
Tree Diagram
Matrix Diagram
PDPC
Activity Network
Diagram
Prioritization Matrix
4.
5. It is a data collection instrument used to record the frequency
and occurrence of specific events, defects, or characteristics
within a process.
Check sheets can be used to collect quantitative or qualitative
data.
When used to collect quantitative data, they can be called a
tally sheet.
CHECK
SHEETS
6. Control Chart
A graph used to track the performance of a
process over time and identify whether it is
operating within acceptable limits.
It used to identify when the process is
going out of control.
Histogram
The most commonly used graph for showing
frequency distributions, or how often each
different value in a set of data occurs.
It was first introduced by Karl Pearson
7. Pareto Chart
Pareto charts are a combination of bar and line graphs.
It is a visual representation of how often the various issues affecting a
process are occurring. Pareto chart derives its name from Italian
economist Vilfredo Pareto.
Pareto 80:20 principle states “80% of the effect comes from 20% of
the causes.” Using this chart, professionals can decide where to place
priority and focus
8. SCATTER PLOT
This graph reveals the relationship between two variables, helping you visualize how changes in
independent variable might affect the dependent variable. It's useful for identifying potential correlations
and root causes of problems.
STRATIFICATION
Dividing data into smaller, more manageable groups based on a
common characteristic, like time, location, or operator. This allows
for targeted analysis and identification of specific factors
influencing process variations.
9. Cause & effect diagram (Ishikawa diagram)
This is used to brainstorm and identify the root causes of a problem by categorizing them into major
factors like people, methods, materials, machines, and environment.
Where, the head of the fish represent problem and the bones represent causes
10.
11. Affinity Diagram
Purpose: Organize a large number of ideas
into natural groups based on their
relationships.
Method: Write down all ideas on sticky
notes, group them based on similarities, and
refine the groups until a clear structure
emerges.
Example: Brainstorming customer
complaints and grouping them by product
features or types of issues.
Affinity Diagram was Created
in 1960’s by Japanese
anthropologist Jiro Kawakita
12. Purpose: Identify the cause-and-effect
relationships between different factors
in a complex situation.
Method: Draw arrows between factors
indicating the direction of influence.
Interrelationship Digraph
Method: Start with the main problem at the top
and branch out to sub-problems, then further
subdivide until specific actions are identified.
Purpose: Break down a
broad problem or goal into
smaller, more manageable
sub-problems or tasks.
Tree Diagram
13. Matrix Diagram
Purpose: Analyze the relationships between multiple
factors and their impact on a desired outcome.
Method: Create a matrix with factors on both axes,
and then fill in cells with symbols or numbers
representing their relationships and impact.
14. Process Decision Program Chart PDPC
This tool is a version of the tree diagram that is
designed to identify all that might go wrong in a plan
under development .
In other words, it is used for forecasting the failures
that may happen while the implementation of the
project
With the help of this tool, we can revise our project
steps that might go wrong.
Activity Network Diagram / Arrow Diagram
Purpose: Plan and schedule tasks for a
project, considering their dependencies and
durations.
We can optimize the tasks and process of our
project with the help of this tool.
Diagram is broadly used in PERT and CPM.
Method: Represent tasks as nodes and their
relationships as arrows, indicating the order
and duration of each task.
15. The Prioritization Matrix is a L-
Shaped matrix that compares a list
of options/needs to a set of criteria,
in order to help choose the best
options when too many options are
available, or to set the options in
order of priority.
Method: Use matrices like the
"Importance-Performance Analysis"
or the "Urgent-Important Matrix" to
categorize tasks based on their
impact and time sensitivity.
Prioritization Matrices / Matrix Data Analysis
URGENT NOT URGENT
IMPORTANT
NOT
IMPORTANT