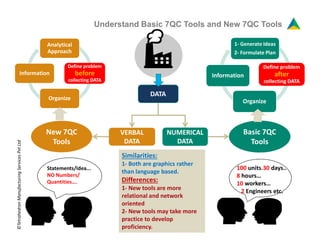
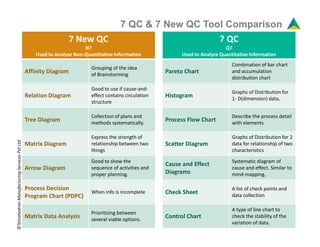
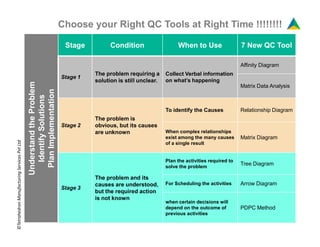
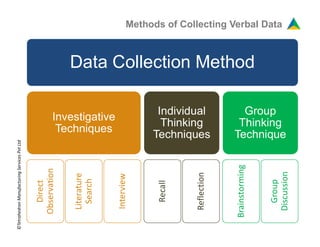
7QC Tools vs New 7 QC Tools
©Tetrahedron Manufacturing Services Pvt Ltd
Comparison of Application & Applicability
By Tetrahedron Manufacturing services Pvt Ltd
Understand Basic 7QC Tools and New 7QC Tools
Analytical
Approach
Define problem
before
collecting DATA
Organize
Information
DATA
1- Generate Ideas
2- Formulate Plan
Define problem
after
collecting DATA
Organize
Information
100 units.30 days..
8 hours…
10 workers…
2 Engineers etc.
Statements/Idea...
NO Numbers/
Quantities….
VERBAL
DATA
NUMERICAL
DATA
Basic 7QC
Tools
New 7QC
Tools
Similarities:
1- Both are graphics rather
than language based.
Differences:
1- New tools are more
relational and network
oriented
2- New tools may take more
practice to develop
proficiency.
©TetrahedronManufacturingServicesPvtLtd
7 QC & 7 New QC Tool Comparison
7 New QC
N7
Used to Analyze Non-Quantitative Information
Affinity Diagram
Grouping of the idea
of Brainstorming
Relation Diagram
Good to use if cause-and-
effect contains circulation
structure
Tree Diagram
Collection of plans and
methods systematically.
7 QC
Q7
Used to Analyze Quantitative Information
Pareto Chart
Combination of bar chart
and accumulation
distribution chart
Histogram
Graphs of Distribution for
1- D(dimension) data.
Process Flow Chart
Describe the process detail
with elementsmethods systematically.
Matrix Diagram
Express the strength of
relationship between two
things
Arrow Diagram
Good to show the
sequence of activities and
proper planning.
Process Decision
Program Chart (PDPC)
When info is incomplete
Matrix Data Analysis
Prioritizing between
several viable options.
with elements
Scatter Diagram
Graphs of Distribution for 2
data for relationship of two
characteristics
Cause and Effect
Diagrams
Systematic diagram of
cause and effect. Similar to
mind-mapping.
Check Sheet
A list of check points and
data collection
Control Chart
A type of line chart to
check the stability of the
variation of data.
©TetrahedronManufacturingServicesPvtLtd
Choose your Right QC Tools at Right Time !!!!!!!!
UnderstandtheProblem
IdentifySolutions
PlanImplementation
Stage Condition When to Use 7 New QC Tool
Stage 1
The problem requiring a
solution is still unclear.
Collect Verbal information
on what’s happening
Affinity Diagram
Matrix Data Analysis
Stage 2
The problem is
obvious, but its causes
To identify the Causes Relationship Diagram
UnderstandtheProblem
IdentifySolutions
PlanImplementation
Stage 2 obvious, but its causes
are unknown When complex relationships
exist among the many causes
of a single result
Matrix Diagram
Stage 3
The problem and its
causes are understood,
but the required action
is not known
Plan the activities required to
solve the problem
Tree Diagram
For Scheduling the activities Arrow Diagram
when certain decisions will
depend on the outcome of
previous activities
PDPC Method
©TetrahedronManufacturingServicesPvtLtd
Methods of Collecting Verbal Data
Data Collection Method
Investigative
Techniques
Individual
Thinking
Group
Thinking
Techniques
Direct
Observation
Literature
Search
Interview Thinking
Techniques
Recall
Reflection
Thinking
Technique
Brainstorming
Group
Discussion
©TetrahedronManufacturingServicesPvtLtd

7 QC and New 7 QC Comparison & Applicability

  • 1.
    7QC Tools vsNew 7 QC Tools ©Tetrahedron Manufacturing Services Pvt Ltd Comparison of Application & Applicability By Tetrahedron Manufacturing services Pvt Ltd
  • 2.
    Understand Basic 7QCTools and New 7QC Tools Analytical Approach Define problem before collecting DATA Organize Information DATA 1- Generate Ideas 2- Formulate Plan Define problem after collecting DATA Organize Information 100 units.30 days.. 8 hours… 10 workers… 2 Engineers etc. Statements/Idea... NO Numbers/ Quantities…. VERBAL DATA NUMERICAL DATA Basic 7QC Tools New 7QC Tools Similarities: 1- Both are graphics rather than language based. Differences: 1- New tools are more relational and network oriented 2- New tools may take more practice to develop proficiency. ©TetrahedronManufacturingServicesPvtLtd
  • 3.
    7 QC &7 New QC Tool Comparison 7 New QC N7 Used to Analyze Non-Quantitative Information Affinity Diagram Grouping of the idea of Brainstorming Relation Diagram Good to use if cause-and- effect contains circulation structure Tree Diagram Collection of plans and methods systematically. 7 QC Q7 Used to Analyze Quantitative Information Pareto Chart Combination of bar chart and accumulation distribution chart Histogram Graphs of Distribution for 1- D(dimension) data. Process Flow Chart Describe the process detail with elementsmethods systematically. Matrix Diagram Express the strength of relationship between two things Arrow Diagram Good to show the sequence of activities and proper planning. Process Decision Program Chart (PDPC) When info is incomplete Matrix Data Analysis Prioritizing between several viable options. with elements Scatter Diagram Graphs of Distribution for 2 data for relationship of two characteristics Cause and Effect Diagrams Systematic diagram of cause and effect. Similar to mind-mapping. Check Sheet A list of check points and data collection Control Chart A type of line chart to check the stability of the variation of data. ©TetrahedronManufacturingServicesPvtLtd
  • 4.
    Choose your RightQC Tools at Right Time !!!!!!!! UnderstandtheProblem IdentifySolutions PlanImplementation Stage Condition When to Use 7 New QC Tool Stage 1 The problem requiring a solution is still unclear. Collect Verbal information on what’s happening Affinity Diagram Matrix Data Analysis Stage 2 The problem is obvious, but its causes To identify the Causes Relationship Diagram UnderstandtheProblem IdentifySolutions PlanImplementation Stage 2 obvious, but its causes are unknown When complex relationships exist among the many causes of a single result Matrix Diagram Stage 3 The problem and its causes are understood, but the required action is not known Plan the activities required to solve the problem Tree Diagram For Scheduling the activities Arrow Diagram when certain decisions will depend on the outcome of previous activities PDPC Method ©TetrahedronManufacturingServicesPvtLtd
  • 5.
    Methods of CollectingVerbal Data Data Collection Method Investigative Techniques Individual Thinking Group Thinking Techniques Direct Observation Literature Search Interview Thinking Techniques Recall Reflection Thinking Technique Brainstorming Group Discussion ©TetrahedronManufacturingServicesPvtLtd