Download to read offline
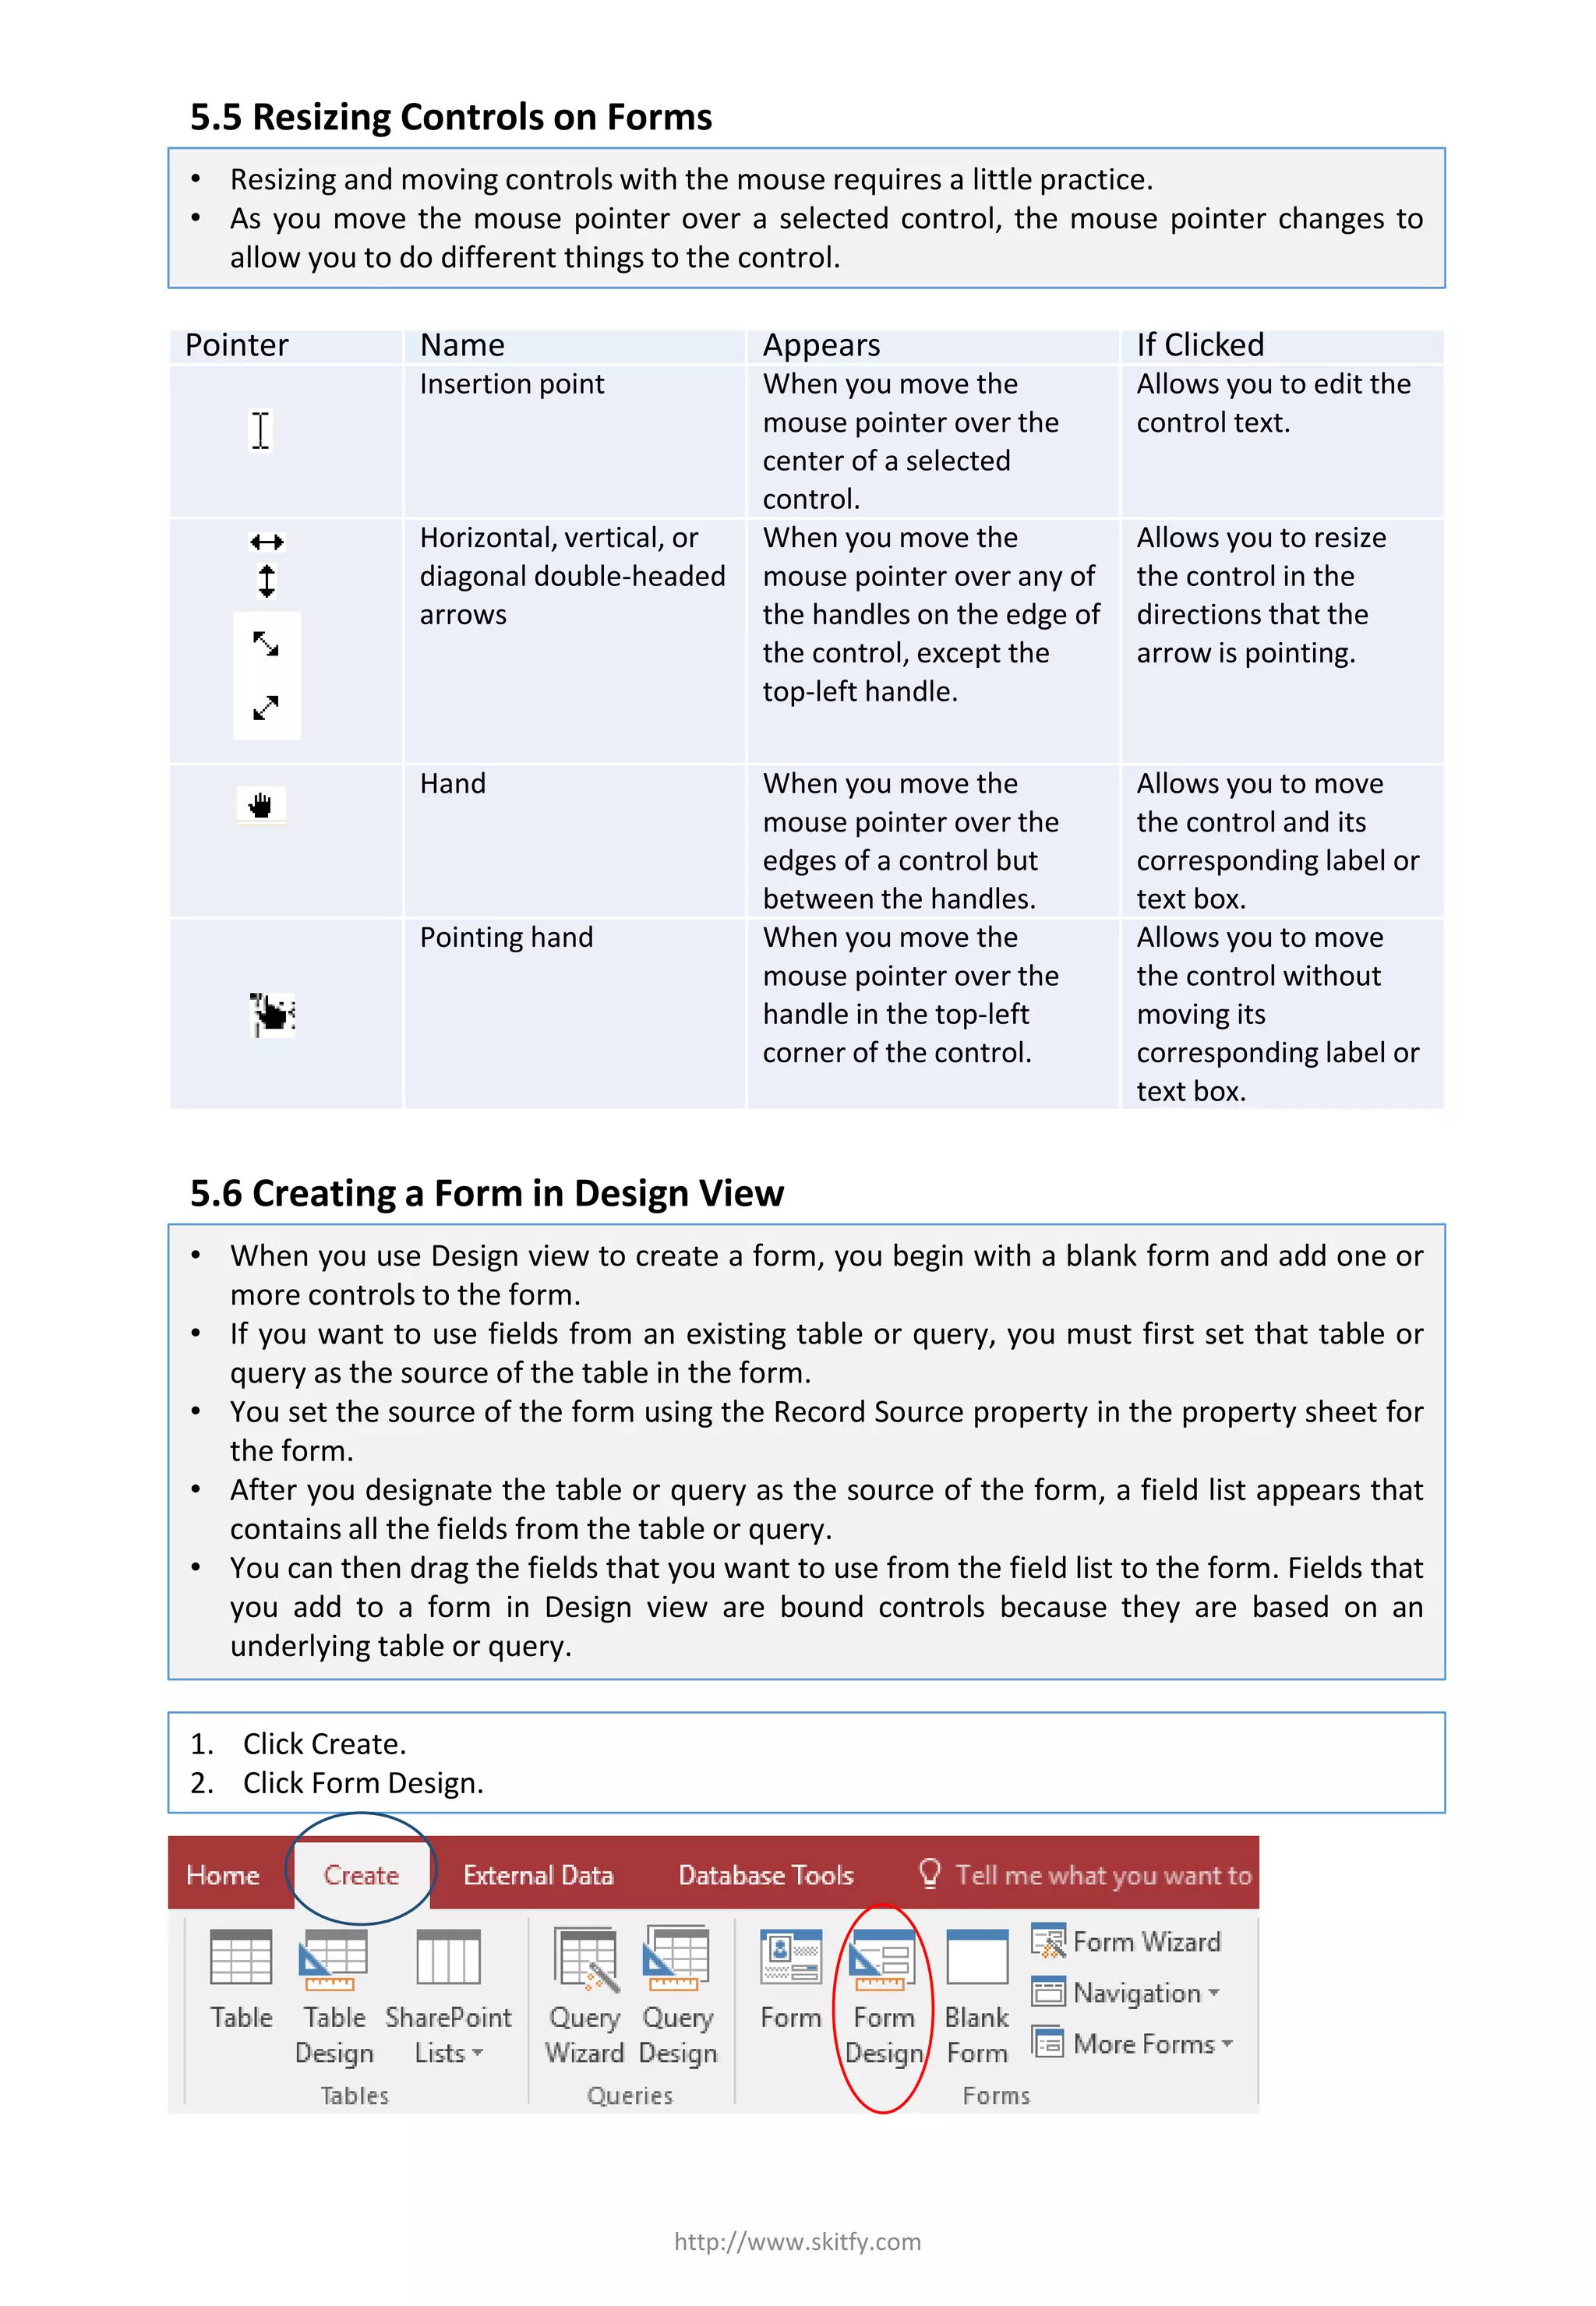
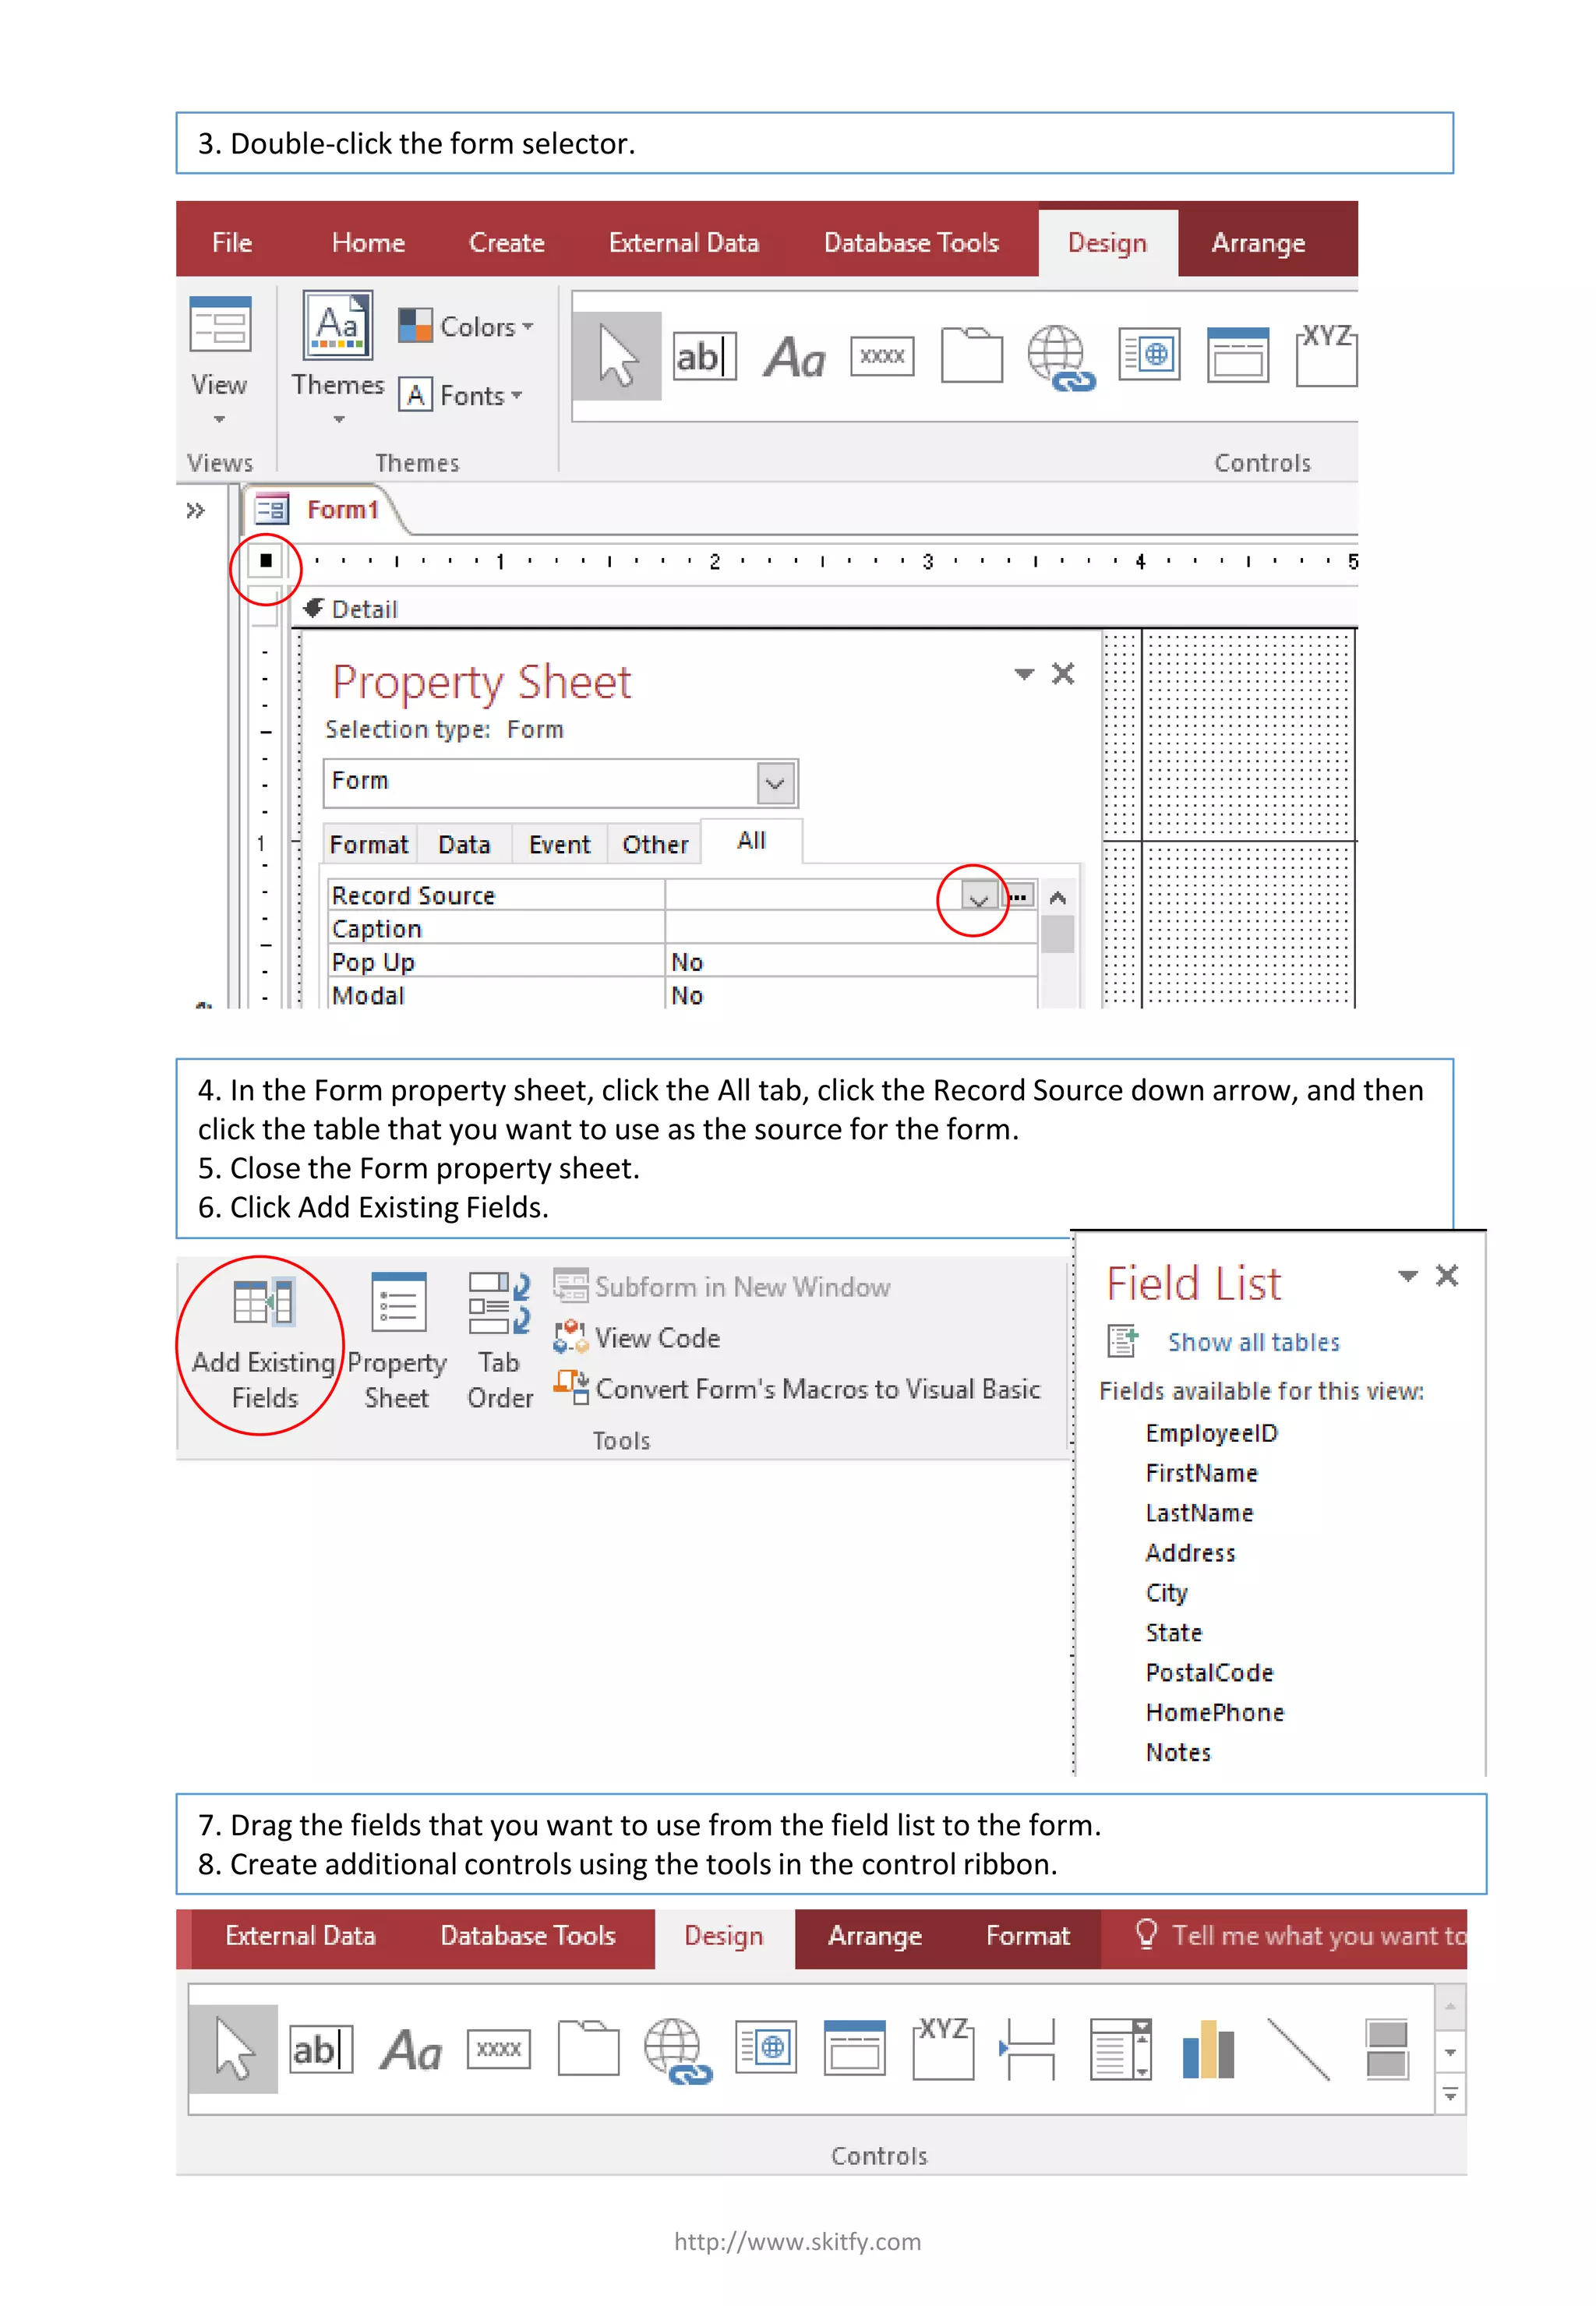
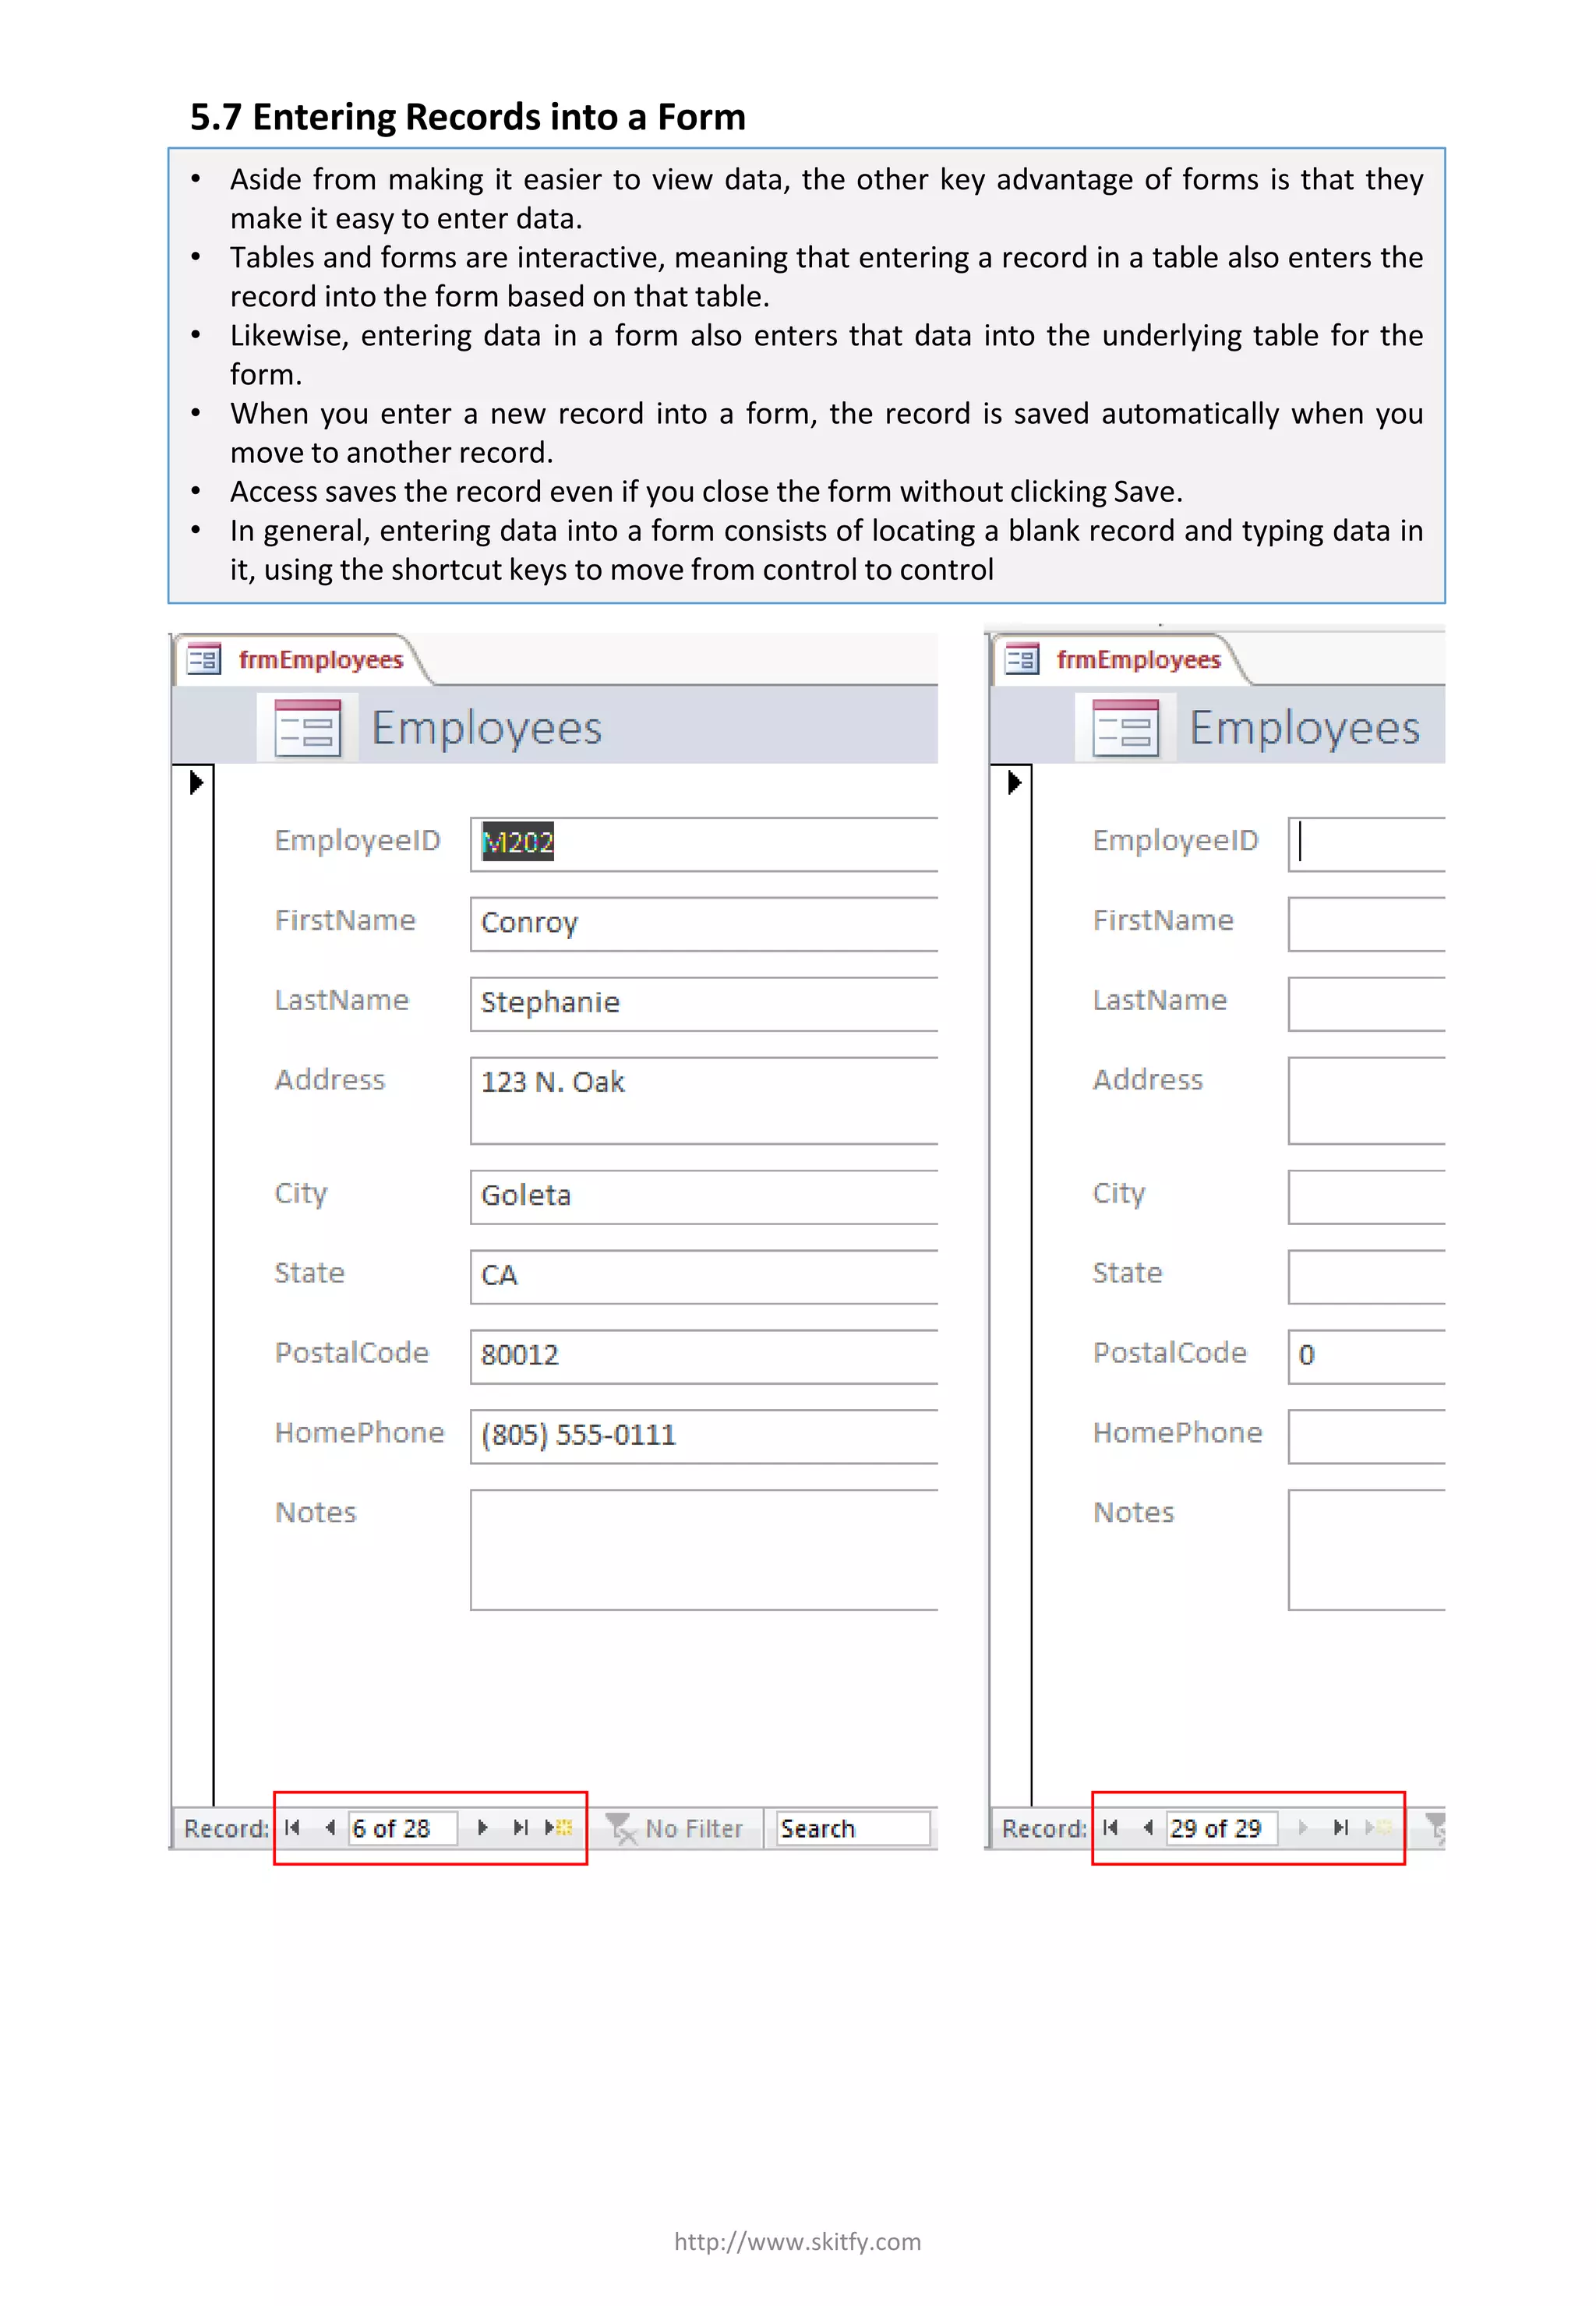

The document provides instructions on how to resize controls on forms and create forms in design view using specific mouse pointer cues for different actions. It explains how to set the record source for forms using existing tables or queries and how to add fields to the form. Additionally, it highlights the interactivity of tables and forms for data entry, noting that records are saved automatically as users navigate through them.