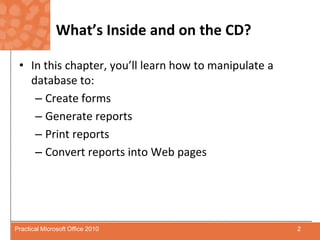
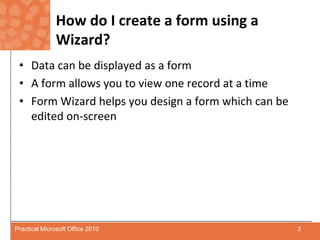
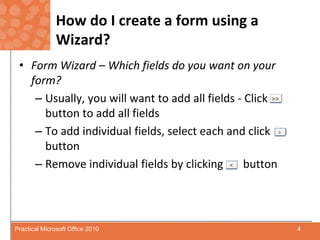
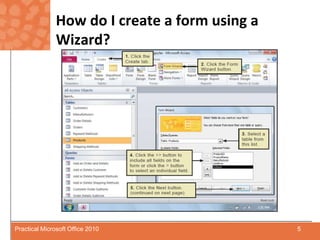
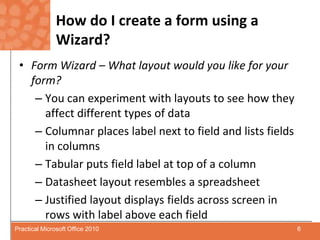
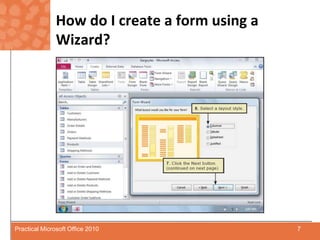
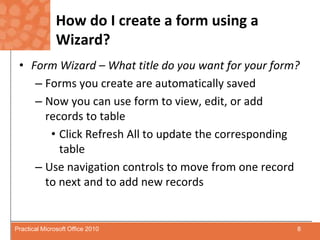
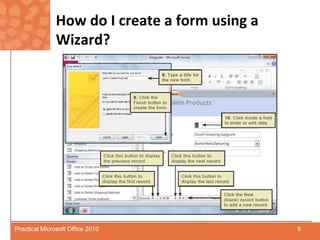
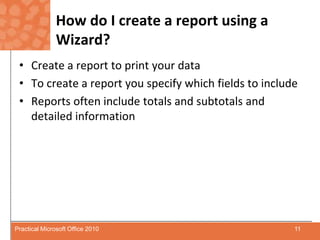
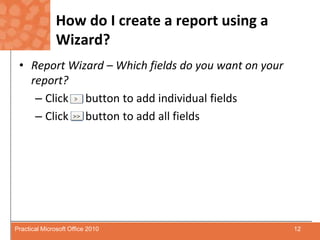
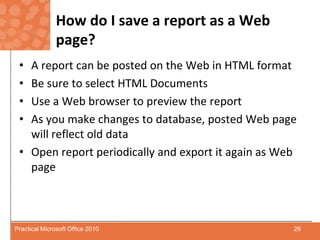
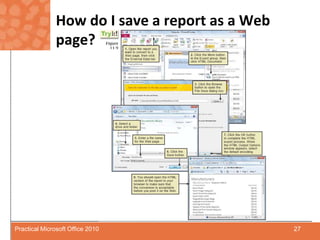
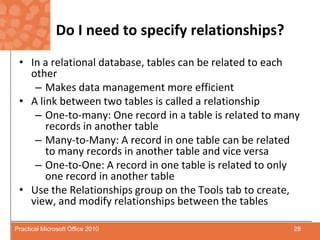
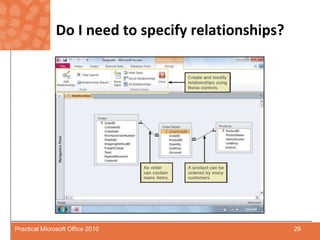
This chapter discusses how to manipulate an Access database by creating forms and reports using wizards. It explains how to design forms, add fields, set layouts and titles. It also covers how to create reports, select fields and grouping, set sorting and layout. The document provides steps for printing reports, adding dates, and saving reports as web pages. It emphasizes that specifying relationships between tables makes data management more efficient.
In the latest release of Dynamics CRM, the 2016 release, Microsoft has improved the out-of-the-box capabilities to generate documents that contain data from CRM records. Where users can now create Word and Excel templates for letters, agreements, quotes, invoices and other documents to be created in just a single click! These template are easy to open with CRM data populated within the document.
We use reports in our daily life. Now a days, computer is basic need of every place. MS ACCESS is used to present & analyse the data. Reports provide the most flexible way of viewing and printing summarized information. I hope this presentation will help you to prepare a report in MS Access.
Business users like you often have to create summary reports out of the data you have. Writing formulae, providing information and organizing the totals into a new table take up valuable time!
E.g., Imagine you have created the perfect summary report that compares, say, sales in different rE.g. ions. You may also have to compare sales across different product lines or customers.
To ease your efforts, Excel supports a feature called ‘pivot table’ which helps in summarizing your data. Moreover, you can easily generate multiple summary reports from the same pivot table.
The best part is, Collabion Charts for SharePoint supports basic pivoting features. It lets you create insightful charts based on pivot tables.
How?
Take a peek at the slides below to get to know!
This is an instructional powerpoint is provided by Dydacomp on the use of Multichannel Order Manager (M.O.M. 7i) Report Builder Module. It is useful in providing tips on how to install, setup the Report Builder and create reports with the Report Builder.
How to Set Up Power BI Sales Dashboard.pdfKavika Roy
Learn how to set up Power BI Sales dashboard in just few steps. Transform the way you analyze and visualize your sales data.
Read the Full Article: https://www.datatobiz.com/blog/how-to-set-up-power-bi-sales-dashboard/
Microsoft Access is a software application that could help students to create databases and organize data using database tools like, reports, modules, tables and queries. Database Relational is a tool that could organize the data by its relationship (One is to One, One is to Many and Many is to Many.
2. What’s Inside and on the CD? In this chapter, you’ll learn how to manipulate a database to: Create forms Generate reports Print reports Convert reports into Web pages 2 Practical Microsoft Office 2010
3. How do I create a form using a Wizard? Data can be displayed as a form A form allows you to view one record at a time Form Wizard helps you design a form which can be edited on-screen 3 Practical Microsoft Office 2010
4. How do I create a form using a Wizard? Form Wizard – Which fields do you want on your form? Usually, you will want to add all fields - Click button to add all fields To add individual fields, select each and click button Remove individual fields by clicking button 4 Practical Microsoft Office 2010
5. How do I create a form using a Wizard? 5 Practical Microsoft Office 2010
6. How do I create a form using a Wizard? Form Wizard – What layout would you like for your form? You can experiment with layouts to see how they affect different types of data Columnar places label next to field and lists fields in columns Tabular puts field label at top of a column Datasheet layout resembles a spreadsheet Justified layout displays fields across screen in rows with label above each field 6 Practical Microsoft Office 2010
7. How do I create a form using a Wizard? 7 Practical Microsoft Office 2010
8. How do I create a form using a Wizard? Form Wizard – What title do you want for your form? Forms you create are automatically saved Now you can use form to view, edit, or add records to table Click Refresh All to update the corresponding table Use navigation controls to move from one record to next and to add new records 8 Practical Microsoft Office 2010
9. How do I create a form using a Wizard? 9 Practical Microsoft Office 2010
10. How do I create a form using a Wizard? To modify a form and layout, you must switch to Design View To move a label and the associated data field: move the pointer over the label until it changes to a four-headed arrowshape drag label and data field to new location 10 Practical Microsoft Office 2010
11. How do I create a report using a Wizard? Create a report to print your data To create a report you specify which fields to include Reports often include totals and subtotals and detailed information 11 Practical Microsoft Office 2010
12. How do I create a report using a Wizard? Report Wizard – Which fields do you want on your report? Click button to add individual fields Click button to add all fields 12 Practical Microsoft Office 2010
13. How do I create a report using a Wizard? Report Wizard – Do you want to add grouping levels? Grouping level sorts records according to entries in group field You might group a list of products by manufacturer, then group by item number 13 Practical Microsoft Office 2010
14. How do I create a report using a Wizard? 14 Practical Microsoft Office 2010
15. How do I create a report using a Wizard? 15 Practical Microsoft Office 2010
16. How do I create a report using a Wizard? Report Wizard – What sort order and summary information do you want for detail records? sort within a group by clicking the down arrow button select field to sort select Ascending or Descending button to change sort order 16 Practical Microsoft Office 2010
17. How do I create a report using a Wizard? Report Wizard – How would you like to lay out your report? Select an option button in the Layout section Preview helps to visualize the layout of the completed report 17 Practical Microsoft Office 2010
18. How do I create a report using a Wizard? Report Wizard – What title do you want for your report type name of report Report is automatically saved Report is displayed when you click Finish Use scroll bars to view any pages not showing 18 Practical Microsoft Office 2010
19. How do I create a report using a Wizard? 19 Practical Microsoft Office 2010
20. How do I create a report using a Wizard? Modify report layout at any time: Right-click report name Click Design View from shortcut menu Use options on the Report Design Tools tabs Use sizing handles to resize objects on report To move object: Position pointer over object until it changes to a four-headed arrow Drag to new location 20 Practical Microsoft Office 2010
21. How do I print a report? Contents of report are automatically updated to reflect database contents each time you display or print report The printed report is a snapshot Include date and time report was printed to help determine if data is current 21 Practical Microsoft Office 2010
22. How do I print a report? To add date or time as header: Right-click report name in the Navigation Pane Click Design View on the shortcut menu Click the Date & Time button in the Design tab Select the date and time formats Click the OK button 22 Practical Microsoft Office 2010
23. How do I print a report? Move date and time fields to any location: Select both fields by holding down Shift key while clicking each field Move pointer over edge of fields until pointer changes to a four-headed arrow Drag to desired location on report 23 Practical Microsoft Office 2010
24. How do I print a report? 24 Practical Microsoft Office 2010
25. How do I print a report? 25 Practical Microsoft Office 2010
26. How do I save a report as a Web page? A report can be posted on the Web in HTML format Be sure to select HTML Documents Use a Web browser to preview the report As you make changes to database, posted Web page will reflect old data Open report periodically and export it again as Web page 26 Practical Microsoft Office 2010
27. How do I save a report as a Web page? 27 Practical Microsoft Office 2010
28. Do I need to specify relationships? In a relational database, tables can be related to each other Makes data management more efficient A link between two tables is called a relationship One-to-many: One record in a table is related to many records in another table Many-to-Many: A record in one table can be related to many records in another table and vice versa One-to-One: A record in one table is related to only one record in another table Use the Relationships group on the Tools tab to create, view, and modify relationships between the tables 28 Practical Microsoft Office 2010
29. Do I need to specify relationships? 29 Practical Microsoft Office 2010