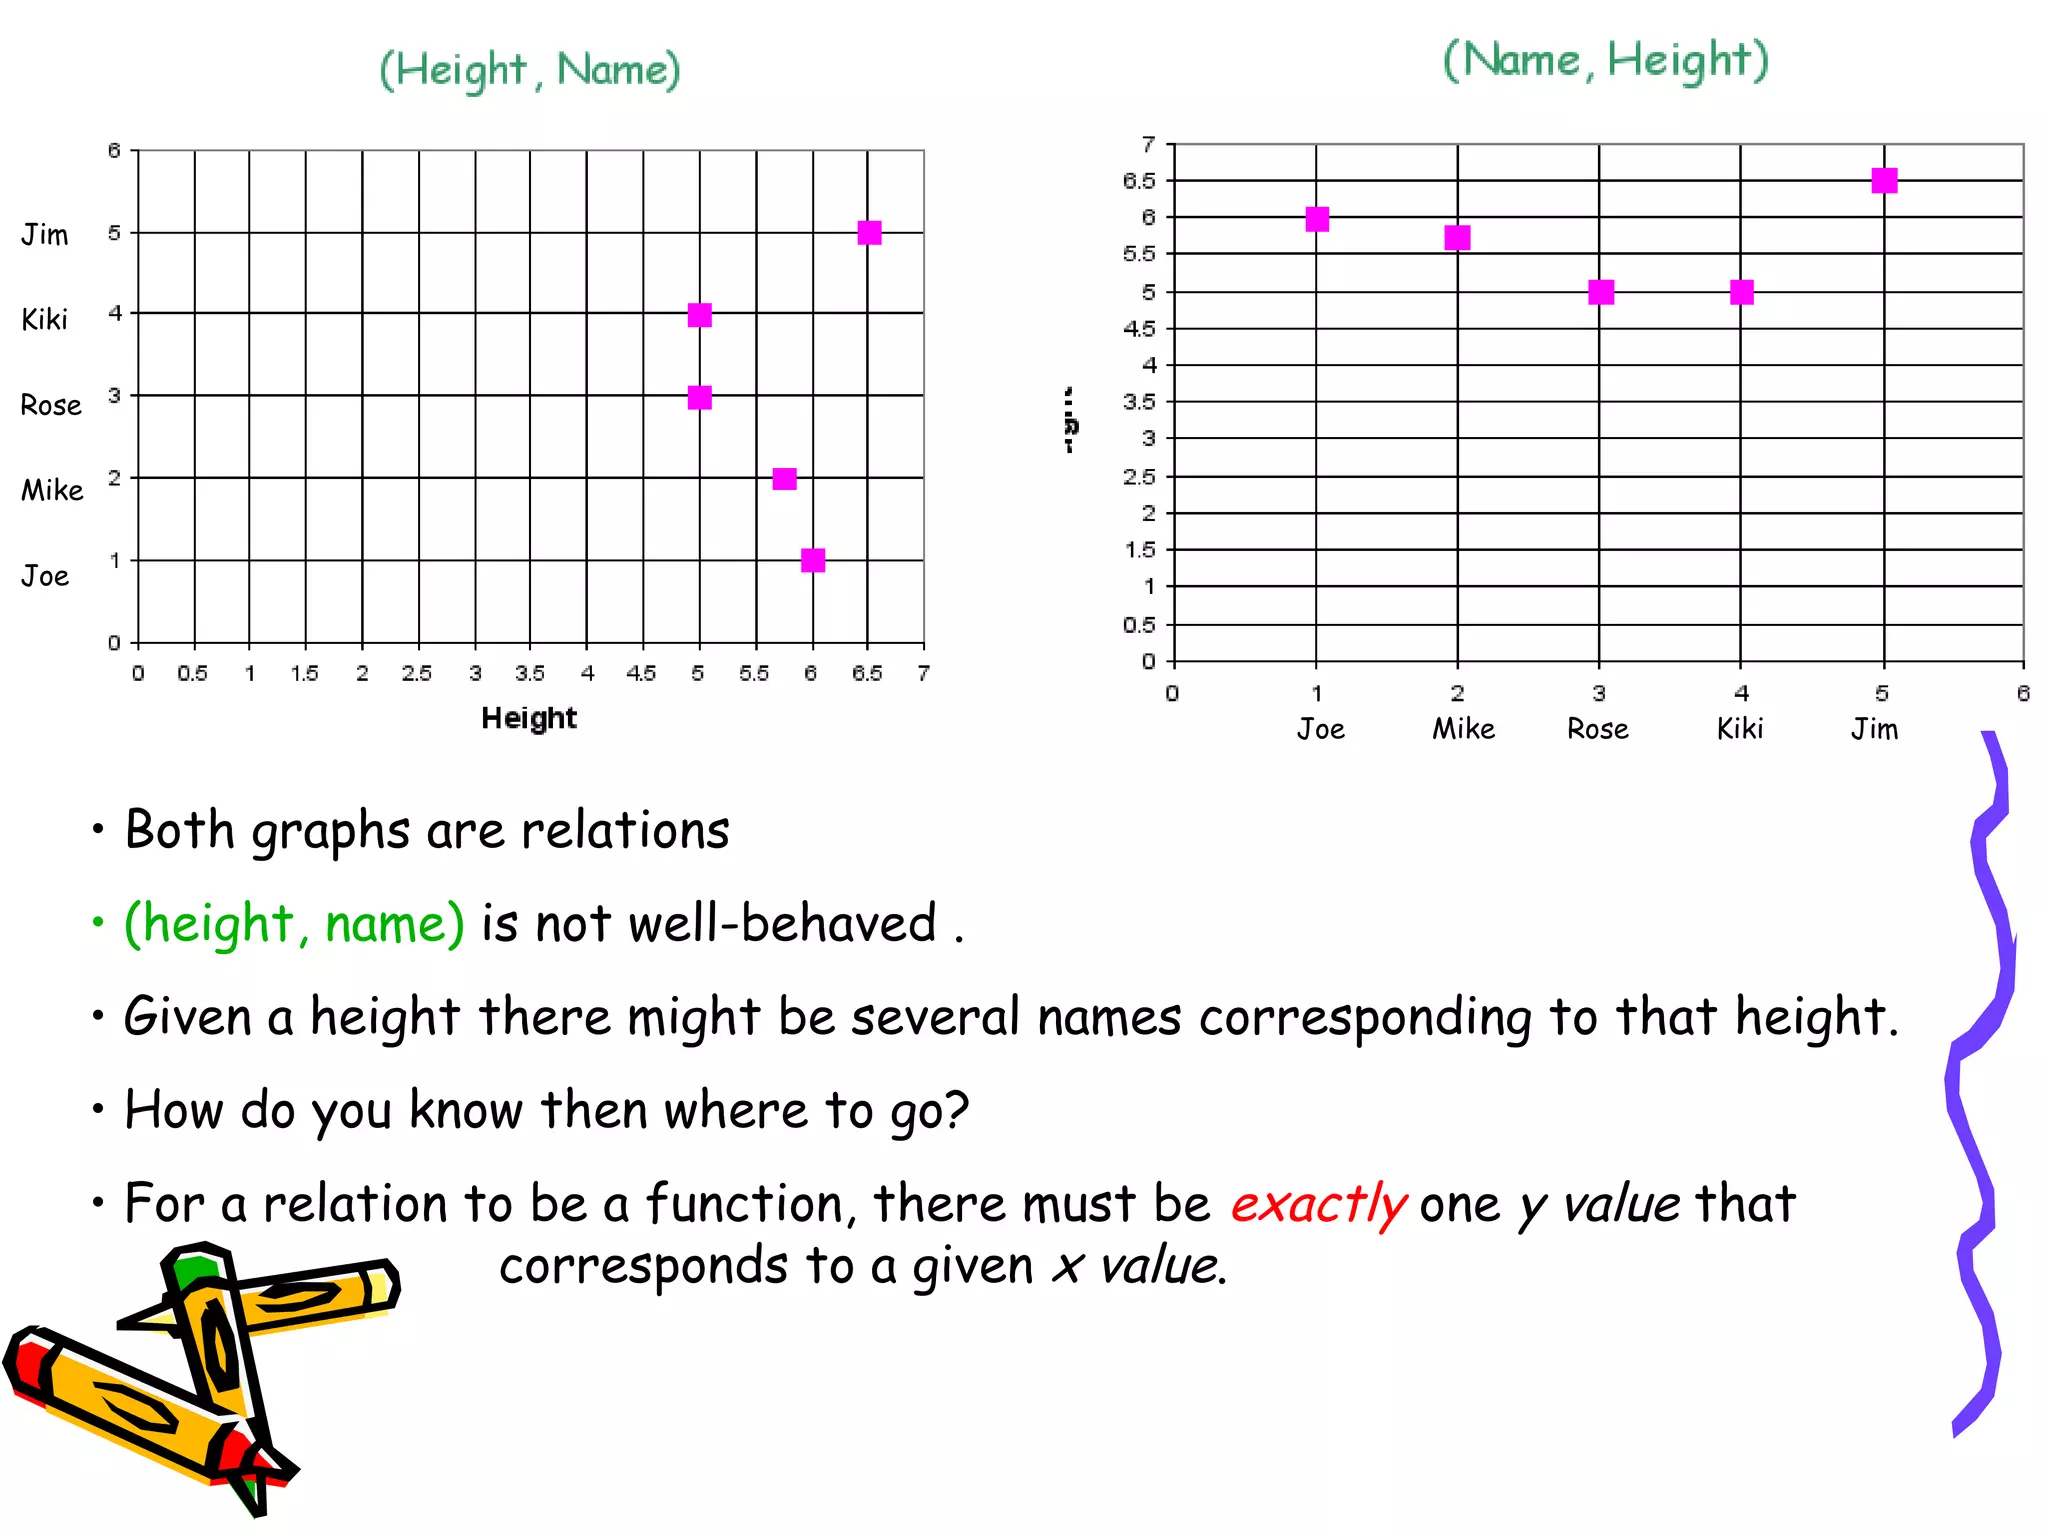
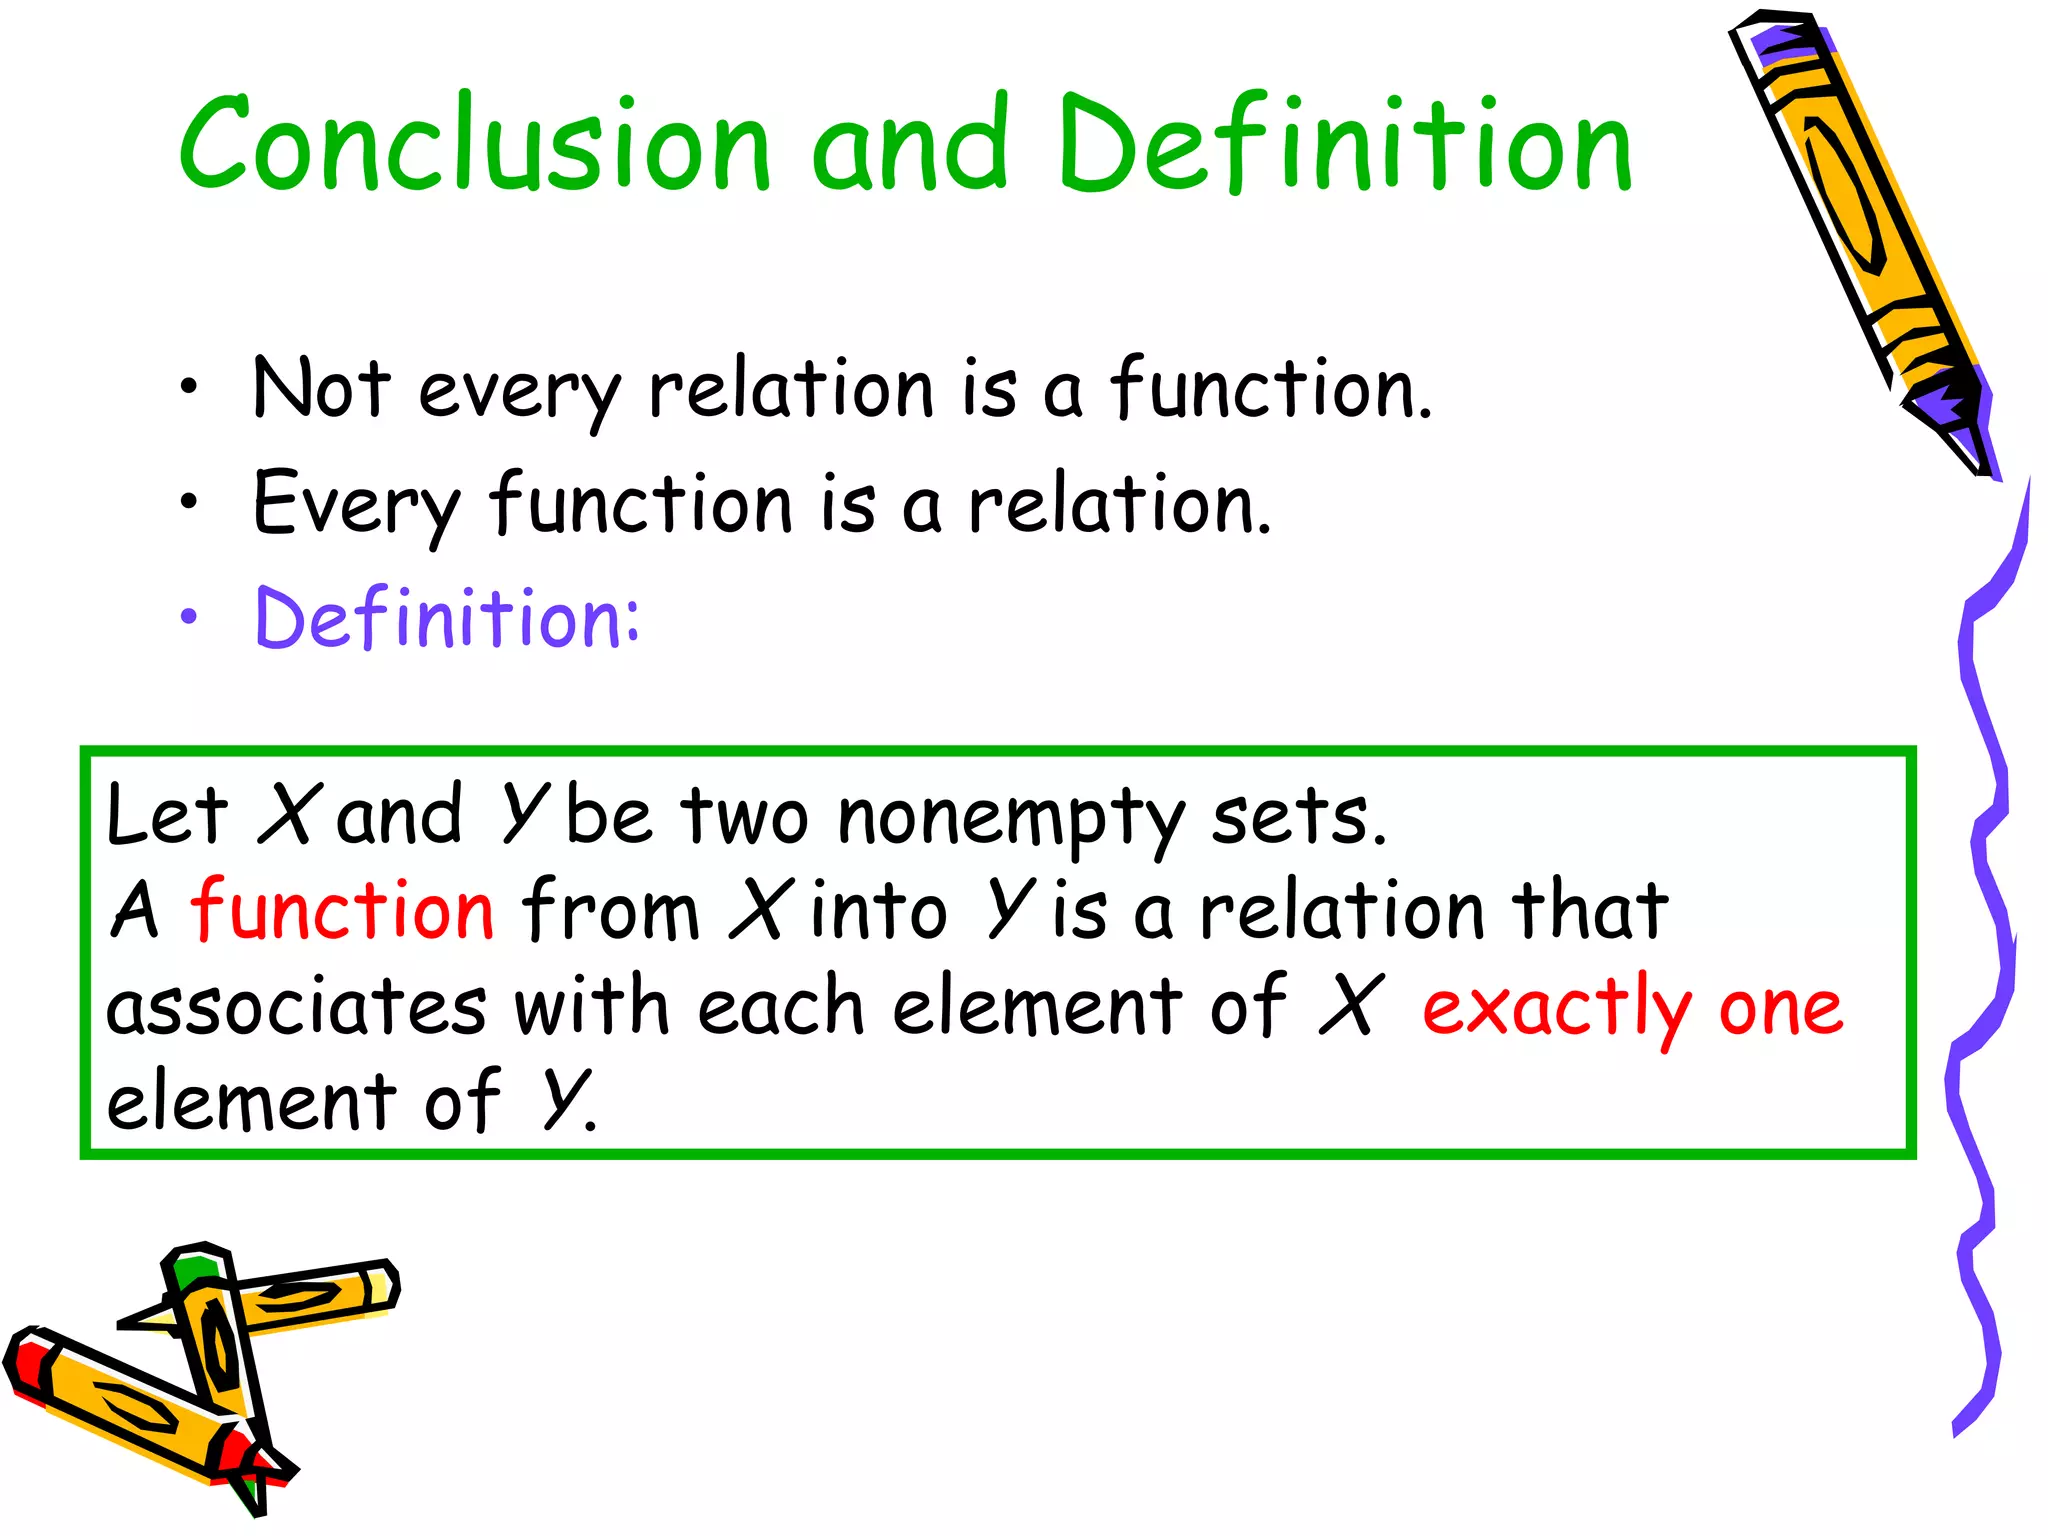
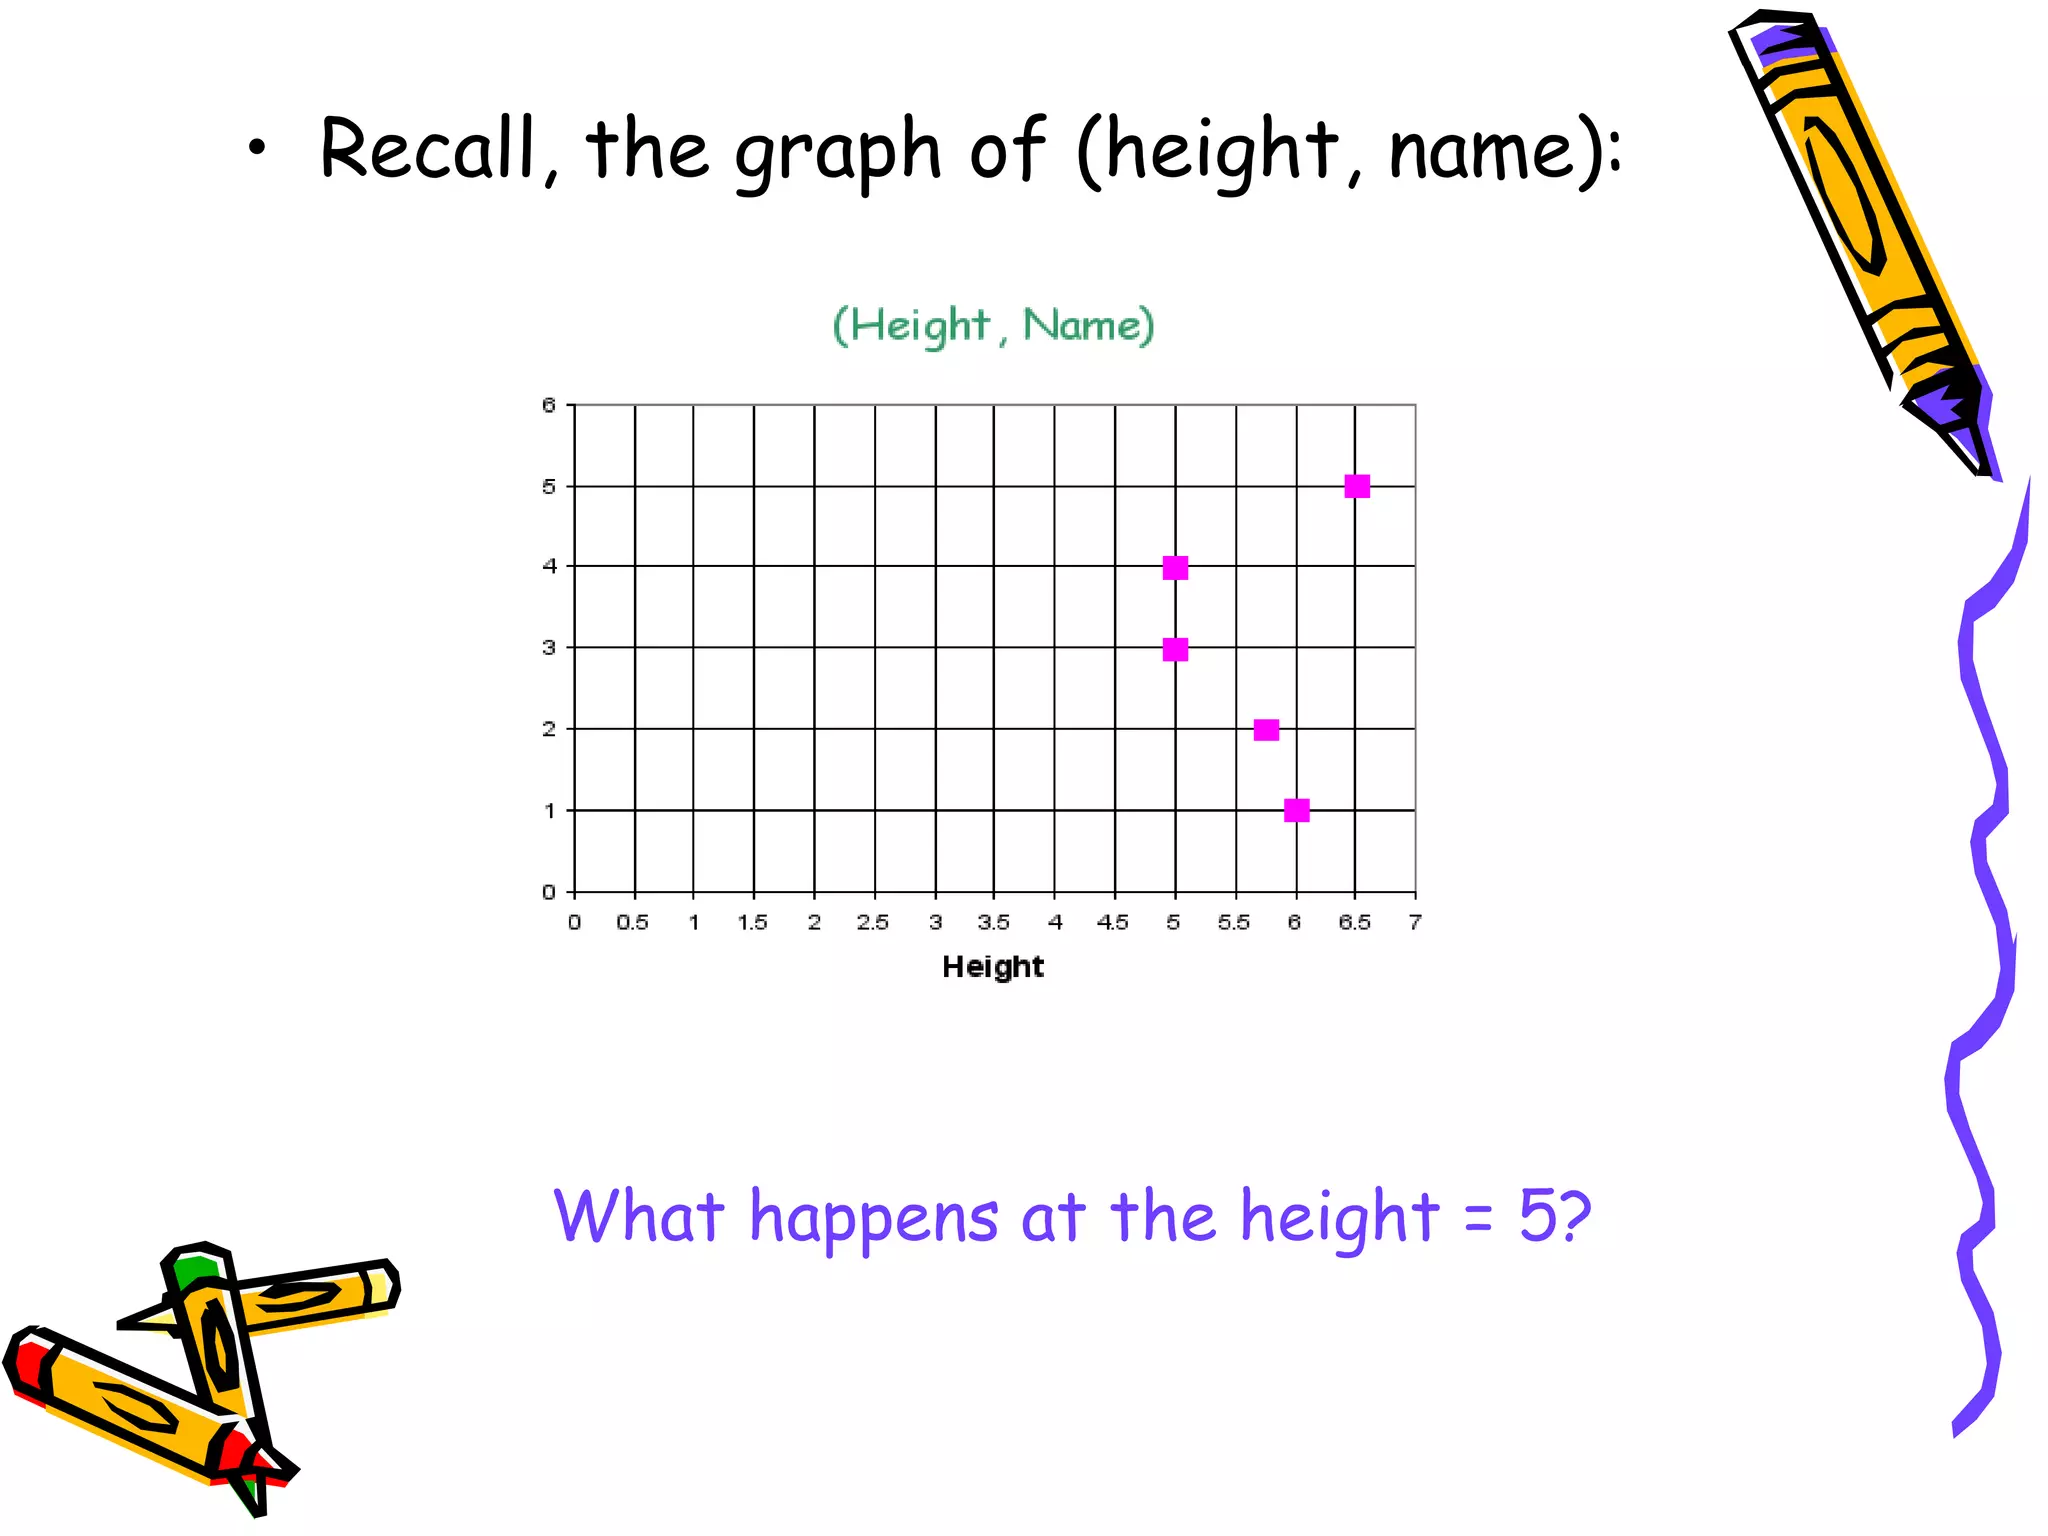
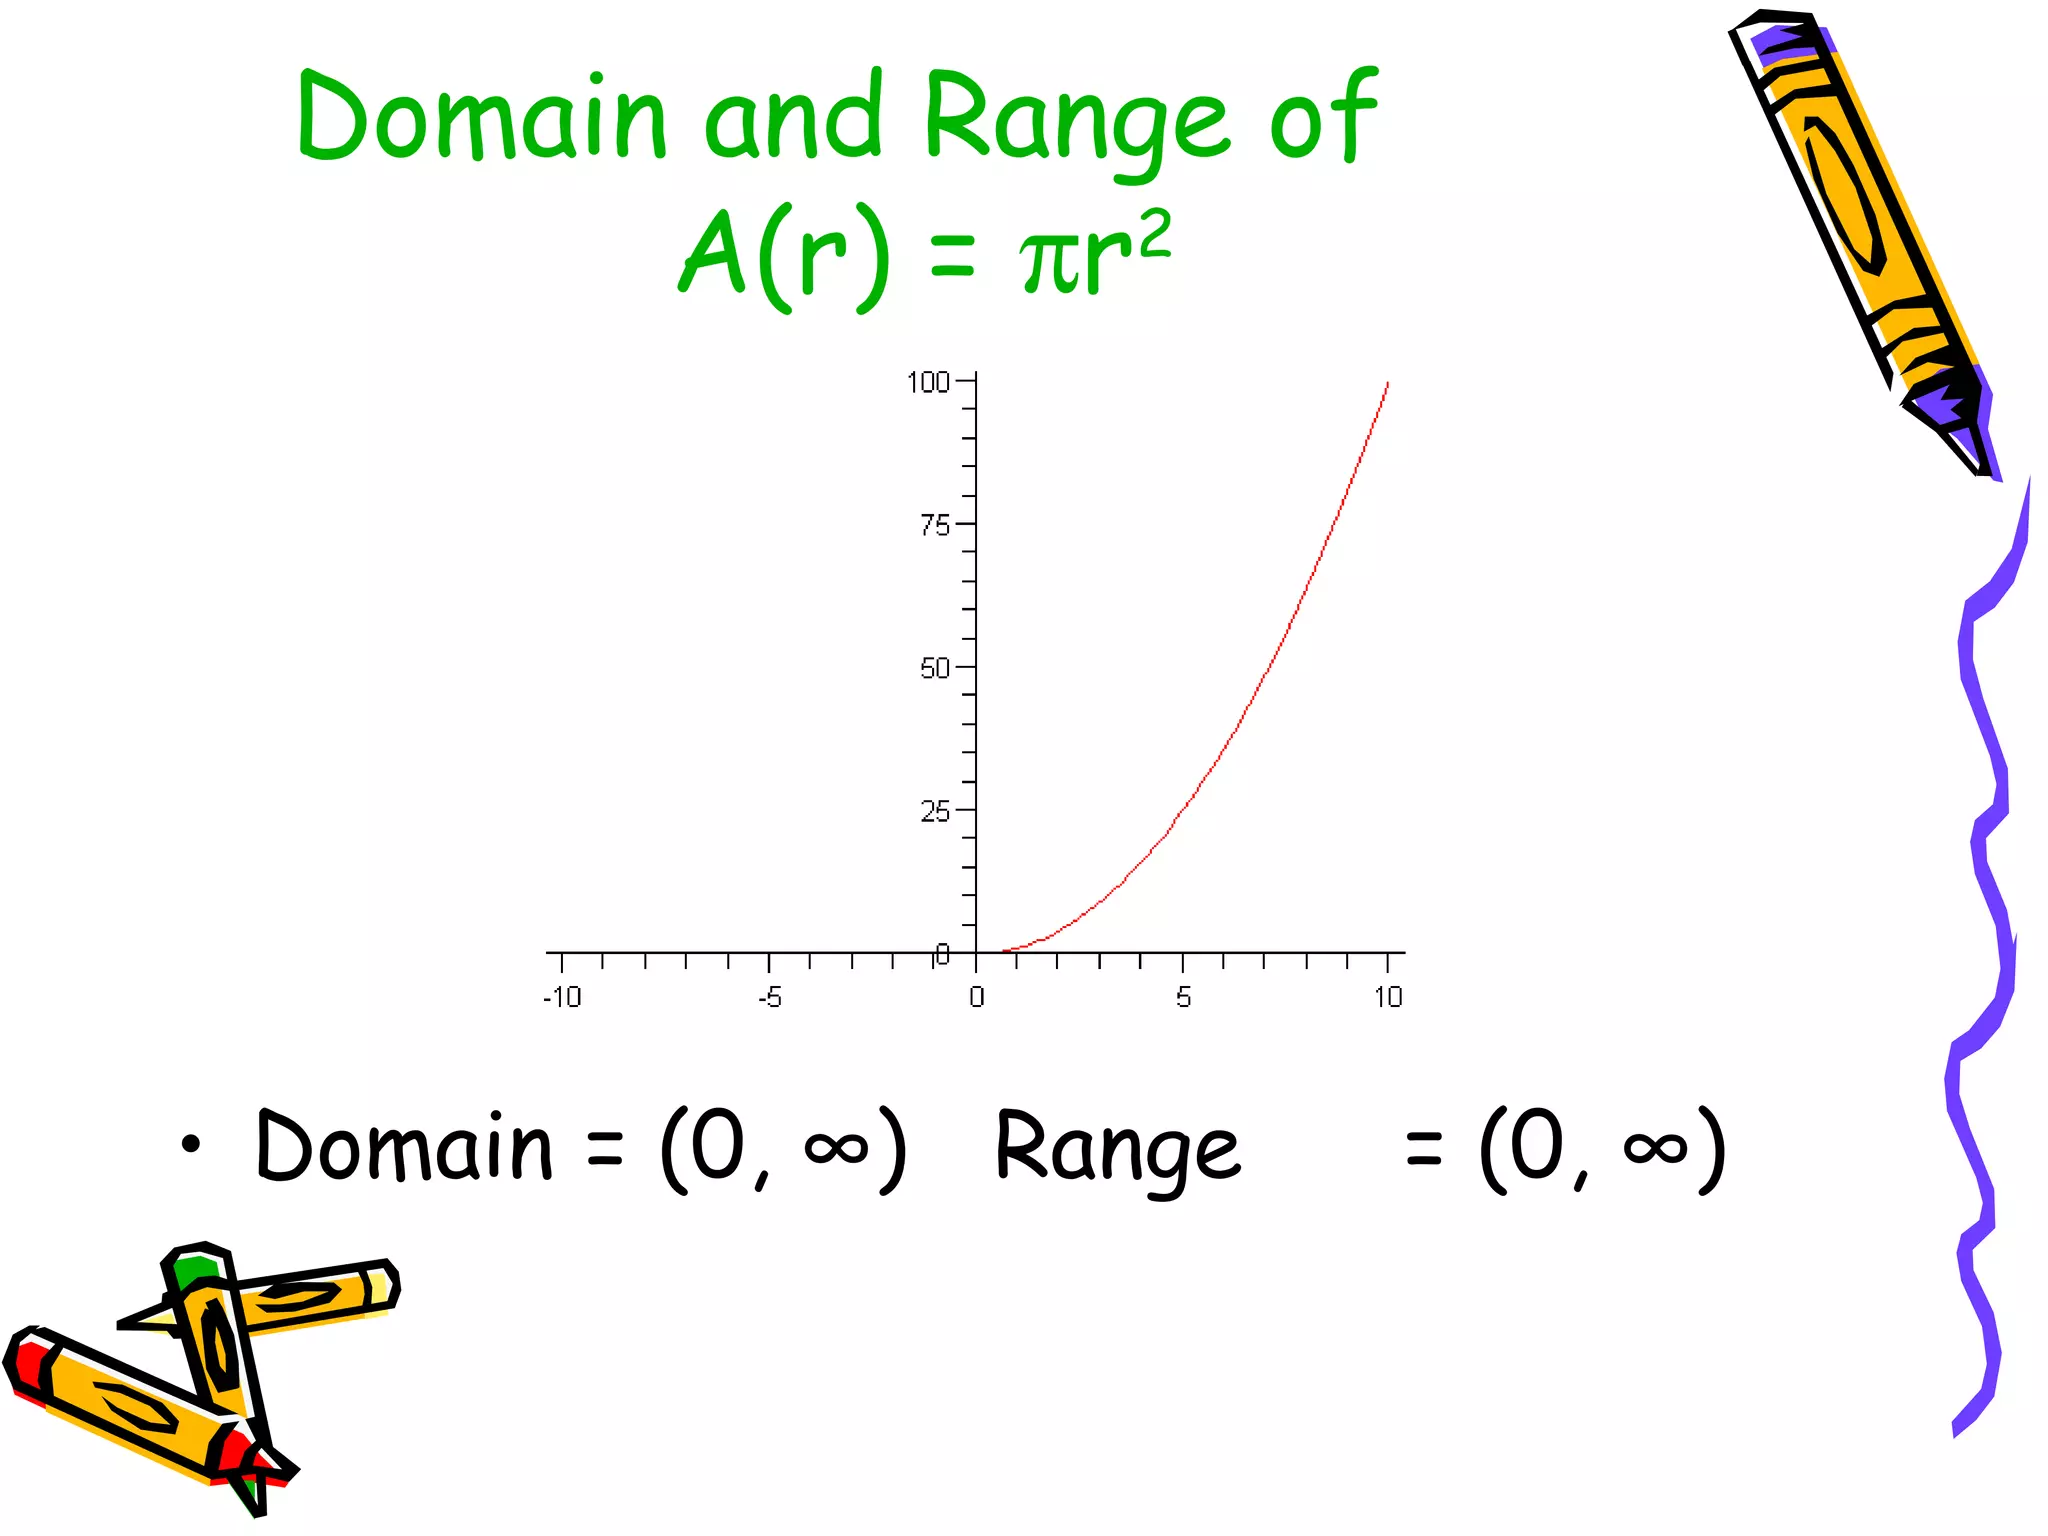
Math functions, relations, domain & rangeRenee Scott
This document discusses math functions, relations, and their domains and ranges. It provides examples of relations and explains that the domain is the set of first numbers in ordered pairs, while the range is the set of second numbers. A function is defined as a relation where each x-value has only one corresponding y-value. It compares examples of relations that are and are not functions and describes how to evaluate functions by inserting values. Tests for identifying functions like the vertical line test are also outlined.
This document defines and provides examples of the domain and range of a function. The domain is the set of all independent variable (x-coordinate) values, while the range is the set of all dependent variable (y-coordinate) values. Several examples of identifying the domain and range of functions given their sets of ordered pairs are provided. The document also discusses using the vertical line test to determine if a graph represents a function.
The document defines functions and discusses:
- Functions are sets of ordered pairs with each first element paired to a unique second element.
- Functions can be one-to-one or many-to-one.
- Functions are represented in set notation, tabular form, as equations, and as graphs.
- The domain of a function is the set of first elements and the range is the set of second elements.
This document discusses functions and their key characteristics including domain and range. It provides examples of relations that are and are not functions, explaining that a function must map each input to exactly one output. The document defines a function as a relation that associates each element in the domain (set of possible inputs) to exactly one element in the range (set of possible outputs). It discusses representing functions verbally, numerically, visually, and algebraically and gives examples of determining the domain and range of specific functions like the area of a circle function.
A function is a rule that assigns each input exactly one output, so that each x-value relates to a single y-value. Functions can be represented numerically with ordered pairs, graphically with a set of points where no x-value appears twice, verbally through a word problem, and algebraically with an equation relating x and y. Checking for a single output for each input is important to determine if a relation represents a function.
1. The document discusses relations and functions, including identifying their domain and range. It provides examples of plotting points on a Cartesian plane and using graphs to represent equations.
2. Functions are defined as relations where each input is mapped to only one output. Several examples are given to demonstrate determining if a relation qualifies as a function using techniques like the vertical line test.
3. The key concepts of domain, range, and using graphs are illustrated through multiple examples of sketching and analyzing relations and functions.
The document discusses how to find the domain and range of ordered pairs, graphs, and functions. It provides examples of finding the domain, which is the set of first coordinates for ordered pairs or the values of x included in the solution set for graphs, and the range, which is the set of second coordinates for ordered pairs or the values of y included in the solution set for graphs. The document gives the domain and range for several examples of ordered pairs, graphs and functions.
Relations are sets of ordered pairs that represent connections between elements. A relation is a function if each element in the domain (input) is uniquely mapped to an element in the range (output). This can be tested using the vertical line test - if a vertical line can pass through the graph of a relation more than once, it is not a function. The domain of a relation is the set of all first elements of each ordered pair, while the range is the set of all second elements. A relation is a function if its domain does not contain repeating elements.
This is your introduction to domain, range, and functions. You will learn more about domain, range, functions, relations, x-values, and y-values. There are definitions and explanations of each concepts. There are questions to help quiz yourself. Test your abilities. Enjoy.
The document summarizes key concepts about relations and functions including:
1) It defines relation, domain, range, and function.
2) It provides examples of relations that are and are not functions using ordered pairs, tables, and mappings.
3) It shows how to determine if a relation is a function using a vertical line test and mappings.
4) It gives examples of finding the domain and range of relations and determining if other relations are functions.
The document reviews key concepts about functions including domain, range, and evaluating functions. It provides examples of determining if a relation is a function using mapping diagrams and the vertical line test. It also gives examples of finding the domain and range of functions from graphs and equations. Practice problems are included for students to determine domains, ranges, and evaluate functions.
This document defines functions and relations. It discusses identifying the domain and range of functions and relations, evaluating functions, and performing operations on functions such as addition, subtraction, multiplication, division, and composition. It also covers graphing functions, including piecewise functions, absolute value functions, greatest and least integer functions. Key examples are provided to illustrate how to identify domains and ranges, evaluate functions, perform operations on functions, and graph different types of functions.
The document discusses relations and functions. It provides examples of relations that are and are not functions using ordered pairs. A relation is a function if each element in the domain is mapped to exactly one element in the range. This is determined using a mapping diagram or by applying the vertical line test to a graphical representation of the relation.
This document defines and explains key concepts related to functions and relations, including:
- Relations are sets of ordered pairs, while functions are relations where each x-value only appears once.
- The domain is the set of x-values and the range is the set of y-values. To find them, list the unique x's for the domain and unique y's for the range.
- The function rule is an equation that describes the relationship between x and y for a function. Examples are given of evaluating functions using the rule and finding the domain and range.
The document discusses functions and how to determine if a relationship represents a function using the vertical line test. It defines what constitutes a function and introduces function notation. Examples are provided of evaluating functions for given values of the independent variable and using functions to model and express relationships between variables.
The document provides information about relations and functions. It defines domain as the x-coordinates of ordered pairs in a relation, and range as the y-coordinates. An example relation is given with domain {3, 1, -2} and range {2, 6, 0}. Relations can be represented as sets of ordered pairs, tables, mappings, and graphs. A mapping example is shown. Determining if a relation is a function involves checking if each x-value is paired with a single y-value using the vertical line test.
The document defines relations and functions. A relation is a set of ordered pairs where the domain is the set of x-values and the range is the set of y-values. A function is a relation where each domain value is paired with exactly one range value. The document provides examples of determining if a relation represents a function using the vertical line test and evaluating functions using function notation.
1. The document discusses functions and how to determine if a relation is a function. A function is a relation where each input is mapped to exactly one output.
2. It provides examples of evaluating whether relations are functions and how to identify the domain and range. Functions can be represented by ordered pairs in a set or graphed on a coordinate plane.
3. The vertical line test is introduced as a way to visually check if a relation is a function by seeing if any vertical line passes through more than one point.
This document discusses functions and their graphs. It defines domain as the set of possible values for the independent variable and range as the set of possible values for the dependent variable. It also defines a function as a relation where each x value corresponds to a unique y value. The document provides examples of determining whether a relation is a function and reading function notation to identify corresponding points. It discusses identifying the domain by considering what values are allowed based on the definition of the function.
The document discusses functions and relations. It defines a function as a set of ordered pairs where each x-value is paired with only one y-value. A relation is a function only if each x-value is paired with exactly one y-value; if an x-value is paired with more than one y-value, it is not a function. It then asks the reader to identify which of several relations presented are functions based on this definition. It also gives some examples of evaluating simple functions.
This document defines relations and functions in mathematics. A relation is a set of ordered pairs where the domain is the set of all x values and the range is the set of all y values. A function assigns each element in the domain (set of x values) to exactly one element in the range (set of y values). Functions are commonly represented by letters like f(x), where f denotes the name of the function and x is the variable. The left side of a function equation tells us the name and variable of the function, not that the function is being multiplied.
This document defines key vocabulary terms related to relations and functions such as domain, range, and discrete vs continuous relations. It provides examples of relations and uses the vertical line test to determine if they are functions. It also discusses evaluating functions by finding the output of a function given an input.
The document provides information about functions and relations. It defines a function as a relation where each x-value is paired with exactly one y-value. To determine if a relation is a function, it describes using the vertical line test, where a relation is a function if a vertical line can only intersect the graph at one point. It gives examples of applying the vertical line test to graphs and determining the domain and range of relations.
The document discusses linear relations and functions. It defines relations and functions, and explains how to determine if a relation is a function based on whether the domain contains repeating x-values. It shows how to represent relations as ordered pairs, tables, mappings, and graphs. It introduces the vertical line test to determine if a graph represents a function. It also explains function notation and how to find the value of a function for a given input.
This document discusses functions and relations. It begins by defining a relation as a correspondence between two sets where each element in the first set corresponds to at least one element in the second set. It then defines a function as a special type of relation where each element in the first set corresponds to exactly one element in the second set. The document provides examples of functions defined using ordered pairs, tables, and algebraic rules. It also discusses how to graph functions and determine whether a set of ordered pairs represents a function or merely a relation. Students are assigned to write a short reflection on what they learned about functions and any difficulties understanding parts of the lesson.
The document defines relations and functions. A relation is a set of ordered pairs where the domain is the set of first coordinates and the range is the set of second coordinates. A function is a special type of relation where each element in the domain corresponds to exactly one element in the range. Functions can be represented as tables of values, ordered pairs, mappings, graphs or equations. The vertical line test can be used to determine if a graph represents a function - if no vertical line intersects the graph at more than one point, it is a function. Examples are provided to illustrate these concepts.
1. A function is a relation where each input is paired with exactly one output.
2. To determine if a relation is a function, use the vertical line test - if any vertical line intersects more than one point, it is not a function.
3. To find the value of a function, substitute the given value for x into the function equation and simplify.
The document defines relations and functions. A relation is a set of ordered pairs, while a function is a special type of relation where each x-value is mapped to only one y-value. The domain is the set of x-values and the range is the set of y-values. Functions can be identified using the vertical line test or by mapping the relation to check if any x-values are mapped to multiple y-values. Evaluating functions involves substituting domain values into the function rule to find the corresponding range values.
This document discusses functions and their key properties of domain and range. It provides examples to illustrate the difference between a relation and a function. For a relation to be a function, each input must have exactly one output. The domain is defined as the set of all possible inputs, while the range is the set of all possible outputs. Several examples of functions are examined, identifying their domains and ranges both visually and algebraically. It emphasizes that mathematical models must accurately represent real-world phenomena in order to provide useful insights and predictions.
The domain is the set of all possible square footages, which is 1450 to 2100 square feet. The range is the set of all possible costs, which would be $75 * 1450 = $108,750 to $75 * 2100 = $157,500.
So the domain is [1450, 2100] and the range is [108750, 157500].
This document defines relations and functions. Relations are rules that connect input and output numbers. A relation is a set of ordered pairs. A function is a special type of relation where each input has exactly one output. The document discusses types of relations like reflexive, symmetric, and transitive relations. It also discusses types of functions like one-to-one, onto, and bijective functions. Examples are provided to illustrate relations and functions.
The document discusses relations, functions, domains, and ranges. It defines a relation as a set of ordered pairs and a function as a relation where each x-value is mapped to only one y-value. It explains how to identify the domain and range of a relation, and use the vertical line test and mappings to determine if a relation is a function. Examples of evaluating functions are also provided.
The document discusses various methods for representing knowledge, including:
- Using categories, objects, and properties to represent knowledge about the world in first-order logic
- Representing actions, events, and how objects and properties change over time using the situation calculus
- Addressing challenges like the frame and qualification problems by developing successor state axioms that characterize how fluents change with actions
This document provides an overview of graphing linear relations and functions. It defines key concepts like relations, functions, domain and range. It explains how to determine if a relation is a function, how to graph linear equations, and how to calculate and understand slope. It provides examples of representing relations as ordered pairs, tables, mappings and graphs. It discusses discrete and continuous functions and how to use the vertical line test to determine if a graph represents a function. It also introduces function notation and how to find the value of a function for a given input.
This document discusses the universal approximation theorem for deep neural networks. It begins by motivating deep learning as a way to automatically learn complex decision boundaries without manual feature engineering. It then introduces the universal approximation theorem, which states that a multi-layer perceptron can represent any given function, allowing deep neural networks to theoretically learn anything given enough data. The document proceeds to provide mathematical definitions and proofs related to functional analysis, topology, and linear algebra in order to prove the universal approximation theorem. It concludes by stating the theorem can extend to any measurable activation function and probability measure.
This document defines and compares linear equations and linear functions. It explains that a linear equation involves one variable with the highest power being 1, while a linear function relates two variables with the highest power of one variable being 1. The document also defines domain as the set of input values and range as the set of output values. An example shows how to identify the domain and range from a set of ordered pairs for a linear function.
Graphing linear relations and functionsTarun Gehlot
The document provides an overview of linear relations and functions. It defines relations as sets of ordered pairs and functions as relations where each x-value corresponds to only one y-value. It discusses representing relations as ordered pairs, tables, mappings, and graphs. Key aspects of functions covered include discrete vs continuous functions, the vertical line test, function notation such as f(x), and evaluating functions by finding values such as f(4) given f(x) = x - 2.
Okay, let's think through this step-by-step:
* For 1 guest, you need 2 bags of spaghetti
* For 2 guests, you need 5 bags of spaghetti
* For 3 guests, you need 8 bags of spaghetti
Let's call the number of guests n. Then we can write:
For n = 1 guest, bags of spaghetti = 2
For n = 2 guests, bags of spaghetti = 5
For n = 3 guests, bags of spaghetti = 8
Looking at the pattern, it seems the number of bags increases by 3 each time the number of guests increases by 1.
So the rule is:
Number of bags of spaghetti
The document defines relations and functions. A relation is a set of ordered pairs where each element in the domain (set of x-values) is paired with an element in the range (set of y-values). A function is a special type of relation where each element of the domain is mapped to exactly one element in the range. The document provides examples of relations that are and are not functions based on this one-to-one mapping property. It also discusses using function notation and evaluating functions for different inputs. Finally, it explains how to determine the domain of a function by identifying values that would result in illegal operations like division by zero.
Mathematics (from Greek μάθημα máthēma, “knowledge, study, learning”) is the study of topics such as quantity (numbers), structure, space, and change. There is a range of views among mathematicians and philosophers as to the exact scope and definition of mathematics
The document discusses relations and functions in discrete mathematics. It defines relations as links between objects that can be represented as sets of ordered pairs. A function is a special type of relation where each input is mapped to only one output. The document provides examples of relations that are and are not functions. It also discusses different ways to represent relations, including through tables or graphs, and defines the domain and range of a relation.
Linear regression is a supervised learning technique used to predict continuous valued outputs. It fits a linear equation to the training data to find the relationship between independent variables (x) and the dependent variable (y).
Gradient descent is an algorithm used to minimize the cost function in linear regression. It works by iteratively updating the parameters (θ values) in the direction of the steepest descent as calculated by the partial derivatives of the cost function with respect to each parameter. The learning rate (α) controls the step size in each iteration.
Multivariate linear regression extends the technique to problems with multiple independent variables by representing the hypothesis and parameters as vectors and matrices, allowing gradient descent to optimize the parameters to fit the linear model
Ellipsoidal Representations about correlations (2011-11, Tsukuba, Kakenhi-Sym...Toshiyuki Shimono
A fundamental theory in statistics, possibly applicable to data mining, machine learning, as well as epistemology. The principia mathematica of mine, 2nd version.
The document contains information about functions including definitions, examples of graphs, the vertical line test to determine if a relation is a function, examples of finding the domain of functions from equations, and practice problems determining the domain of various functions. Vocabulary terms defined include function, domain, and range. Functions are described as rules that assign each input to exactly one output, usually through an equation.
This document discusses key concepts related to rates of change and derivatives:
1) It defines average rate of change (ARC) as the slope of a secant line on a graph or using the slope formula algebraically, and instantaneous rate of change (IRC) as the slope of the tangent line.
2) It introduces the difference quotient as a way to define ARC and IRC algebraically without a graph by taking the limit as h approaches 0.
3) A derivative is defined as a function that gives the IRC, allowing it to be evaluated at any point without graphing by taking the limit of the difference quotient.
The document discusses key concepts related to functions such as domain, range, input and output values. It provides examples of determining the domain and range of functions based on algebraic rules. The domain of a function is the set of all possible input values, while the range is the set of all possible output values. The domain and range may be all real numbers or limited depending on the specific function.
The document discusses functions and the pigeonhole principle. It defines what a function is, how functions can be represented graphically and with tables and ordered pairs. It covers one-to-one, onto, and bijective functions. It also discusses function composition, inverse functions, and the identity function. The pigeonhole principle states that if n objects are put into m containers where n > m, then at least one container must hold more than one object. Examples are given to illustrate how to apply the principle to problems involving months, socks, and selecting numbers.
Electromagnetic induction builds on the concept of magnets and magnetic fields in grade 10. Most of the work covered here is quite clear and straight forward.
1) Electromagnetism is one of the fundamental forces in nature and is responsible for most technological phenomena.
2) Electromagnetism encompasses electricity, magnetism, and light. This course will discuss fundamental concepts like charge, force, field, potential, current, and induction.
3) Mastering these basic electromagnetism concepts will prepare students for more advanced topics in their field of study.
This document discusses electromagnetic induction and how it is used in generators and motors. It begins by explaining how a current is induced in a conductor moving through a magnetic field. It then provides examples of calculating induced emf using Faraday's law and Lenz's law. Finally, it describes how a rotating coil in a magnetic field can be used to generate an alternating current in an electric generator.
This document provides a lesson on circle concepts for secondary level students. It defines key circle terms like diameter, chord, radius, and sector. The lesson contains illustrations and examples of each term and a short quiz to assess understanding. The objective is to teach students about the center, chord, diameter and radius of a circle.
This document defines and explains several circle theorems and properties. It defines key circle terms like diameter, radius, chord, arc, tangent, and segment. It then explains four properties of angles in circles: (1) angles subtended by the same chord or arc in the same segment are equal; (2) if two angles stand on the same chord, the angle at the center is twice the angle at the circumference; (3) the angle in a semi-circle is a right angle; and (4) opposite angles in a cyclic quadrilateral add up to 180 degrees. It also defines properties of tangents to circles, such as tangents being perpendicular to radii and tangents from an outside point being equal.
Circle Geometry is rich with new vocabulary (words, etcetera), especially at standard 9 (Grade 11).
Vocab is very very important in geometry. Learners' need to understand the terms/ words and the educators' must enforce the use of these terms.
Euclidean Geometry is another critical branch of mathematics. It weighs a lot of marks in high school math, and teachers need to teach the concept with care and inclusivity.
Euclidean geometry is very important in Math, and it weighs a lot of marks in High school Math. This branch of mathematics develops critical thinking and reasoning skills to a learner.
Executive Directors Chat Leveraging AI for Diversity, Equity, and InclusionTechSoup
Let’s explore the intersection of technology and equity in the final session of our DEI series. Discover how AI tools, like ChatGPT, can be used to support and enhance your nonprofit's DEI initiatives. Participants will gain insights into practical AI applications and get tips for leveraging technology to advance their DEI goals.
This presentation was provided by Steph Pollock of The American Psychological Association’s Journals Program, and Damita Snow, of The American Society of Civil Engineers (ASCE), for the initial session of NISO's 2024 Training Series "DEIA in the Scholarly Landscape." Session One: 'Setting Expectations: a DEIA Primer,' was held June 6, 2024.
This presentation includes basic of PCOS their pathology and treatment and also Ayurveda correlation of PCOS and Ayurvedic line of treatment mentioned in classics.
How to Make a Field Mandatory in Odoo 17Celine George
In Odoo, making a field required can be done through both Python code and XML views. When you set the required attribute to True in Python code, it makes the field required across all views where it's used. Conversely, when you set the required attribute in XML views, it makes the field required only in the context of that particular view.
ISO/IEC 27001, ISO/IEC 42001, and GDPR: Best Practices for Implementation and...PECB
Denis is a dynamic and results-driven Chief Information Officer (CIO) with a distinguished career spanning information systems analysis and technical project management. With a proven track record of spearheading the design and delivery of cutting-edge Information Management solutions, he has consistently elevated business operations, streamlined reporting functions, and maximized process efficiency.
Certified as an ISO/IEC 27001: Information Security Management Systems (ISMS) Lead Implementer, Data Protection Officer, and Cyber Risks Analyst, Denis brings a heightened focus on data security, privacy, and cyber resilience to every endeavor.
His expertise extends across a diverse spectrum of reporting, database, and web development applications, underpinned by an exceptional grasp of data storage and virtualization technologies. His proficiency in application testing, database administration, and data cleansing ensures seamless execution of complex projects.
What sets Denis apart is his comprehensive understanding of Business and Systems Analysis technologies, honed through involvement in all phases of the Software Development Lifecycle (SDLC). From meticulous requirements gathering to precise analysis, innovative design, rigorous development, thorough testing, and successful implementation, he has consistently delivered exceptional results.
Throughout his career, he has taken on multifaceted roles, from leading technical project management teams to owning solutions that drive operational excellence. His conscientious and proactive approach is unwavering, whether he is working independently or collaboratively within a team. His ability to connect with colleagues on a personal level underscores his commitment to fostering a harmonious and productive workplace environment.
Date: May 29, 2024
Tags: Information Security, ISO/IEC 27001, ISO/IEC 42001, Artificial Intelligence, GDPR
-------------------------------------------------------------------------------
Find out more about ISO training and certification services
Training: ISO/IEC 27001 Information Security Management System - EN | PECB
ISO/IEC 42001 Artificial Intelligence Management System - EN | PECB
General Data Protection Regulation (GDPR) - Training Courses - EN | PECB
Webinars: https://pecb.com/webinars
Article: https://pecb.com/article
-------------------------------------------------------------------------------
For more information about PECB:
Website: https://pecb.com/
LinkedIn: https://www.linkedin.com/company/pecb/
Facebook: https://www.facebook.com/PECBInternational/
Slideshare: http://www.slideshare.net/PECBCERTIFICATION
How to Setup Warehouse & Location in Odoo 17 InventoryCeline George
In this slide, we'll explore how to set up warehouses and locations in Odoo 17 Inventory. This will help us manage our stock effectively, track inventory levels, and streamline warehouse operations.
A workshop hosted by the South African Journal of Science aimed at postgraduate students and early career researchers with little or no experience in writing and publishing journal articles.
Walmart Business+ and Spark Good for Nonprofits.pdfTechSoup
"Learn about all the ways Walmart supports nonprofit organizations.
You will hear from Liz Willett, the Head of Nonprofits, and hear about what Walmart is doing to help nonprofits, including Walmart Business and Spark Good. Walmart Business+ is a new offer for nonprofits that offers discounts and also streamlines nonprofits order and expense tracking, saving time and money.
The webinar may also give some examples on how nonprofits can best leverage Walmart Business+.
The event will cover the following::
Walmart Business + (https://business.walmart.com/plus) is a new shopping experience for nonprofits, schools, and local business customers that connects an exclusive online shopping experience to stores. Benefits include free delivery and shipping, a 'Spend Analytics” feature, special discounts, deals and tax-exempt shopping.
Special TechSoup offer for a free 180 days membership, and up to $150 in discounts on eligible orders.
Spark Good (walmart.com/sparkgood) is a charitable platform that enables nonprofits to receive donations directly from customers and associates.
Answers about how you can do more with Walmart!"
How to Manage Your Lost Opportunities in Odoo 17 CRMCeline George
Odoo 17 CRM allows us to track why we lose sales opportunities with "Lost Reasons." This helps analyze our sales process and identify areas for improvement. Here's how to configure lost reasons in Odoo 17 CRM
2. Functions vs. Relations
• A "relation" is just a relationship
between sets of information.
• A “function” is a well-behaved
relation, that is, given a starting
point we know exactly where
to go.
3. Example
• People and their heights, i.e. the
pairing of names and heights.
• We can think of this relation as
ordered pair:
• (height, name)
• Or
• (name, height)
5. MikeJoe Rose Kiki Jim
Joe
Mike
Rose
Kiki
Jim
• Both graphs are relations
• (height, name) is not well-behaved .
• Given a height there might be several names corresponding to that height.
• How do you know then where to go?
• For a relation to be a function, there must be exactly one y value that
corresponds to a given x value.
6. Conclusion and Definition
• Not every relation is a function.
• Every function is a relation.
• Definition:
Let X and Y be two nonempty sets.
A function from X into Y is a relation that
associates with each element of X exactly one
element of Y.
7. • Recall, the graph of (height, name):
What happens at the height = 5?
8. • A set of points in the xy-plane is the
graph of a function if and only if
every vertical line intersects the
graph in at most one point.
Vertical-Line Test
10. • Ones we have decided on the
representation of a function, we ask
the following question:
• What are the possible x-values
(names of people from our example)
and y-values (their corresponding
heights) for our function we can
have?
11. • Recall, our example: the pairing of names and
heights.
• x=name and y=height
• We can have many names for our x-value, but
what about heights?
• For our y-values we should not have 0 feet or 11
feet, since both are impossible.
• Thus, our collection of heights will be greater
than 0 and less that 11.
12. • We should give a name to the
collection of possible x-values (names
in our example)
• And
• To the collection of their
corresponding y-values (heights).
• Everything must have a name
13. • Variable x is called independent variable
• Variable y is called dependent variable
• For convenience, we use f(x) instead of y.
• The ordered pair in new notation becomes:
• (x, y) = (x, f(x))
Y=f(x)
x
(x, f(x))
14. Domain and Range
• Suppose, we are given a function from X into Y.
• Recall, for each element x in X there is exactly
one corresponding element y=f(x) in Y.
• This element y=f(x) in Y we call the image of x.
• The domain of a function is the set X. That is a
collection of all possible x-values.
• The range of a function is the set of all images as
x varies throughout the domain.
20. More Functions
• Consider a familiar function.
• Area of a circle:
• A(r) = πr2
• What kind of function is this?
• Let’s see what happens if we graph A(r).
21. A(r)
r
• Is this a correct representation of the
function for the area of a circle???????
• Hint: Is domain of A(r) correct?
Graph of A(r) = πr2
22. Closer look at A(r) = πr2
• Can a circle have r ≤ 0 ?
• NOOOOOOOOOOOOO
• Can a circle have area equal to 0 ?
• NOOOOOOOOOOOOO
23. • Domain = (0, ∞) Range = (0, ∞)
Domain and Range of
A(r) = πr2
24. Just a thought…
• Mathematical models that describe real-world
phenomenon must be as accurate as possible.
• We use models to understand the phenomenon and
perhaps to make a predictions about future
behavior.
• A good model simplifies reality enough to permit
mathematical calculations but is accurate enough
to provide valuable conclusions.
• Remember, models have limitations. In the end,
Mother Nature has the final say.