1. Name: _____________________________________________________ Grade & Section: ____________________
Evaluating Algebraic Expressions
Learning Competency: Evaluate algebraic expressions involving integral exponents.
To evaluate an algebraic expression,
1. substitute the given value of variables to the algebraic expression and
2. solve by applying the laws of exponents.
Example: Evaluate a2+b3 when a=4 and b=2.
Solution: a2+b3 = 42+23
=(4⦁4)+(2⦁2⦁2)
=16+8
=24
Evaluating Algebraic Expressions Using Calculator
Calculator Model: Casio fx-350ES PLUS
This has eight present variables named A, B, C, D, E, F, X and Y. You can assign values
to variables and also use variables in calculations.
Example: Evaluate a2+b3 when a=4 and b=2.
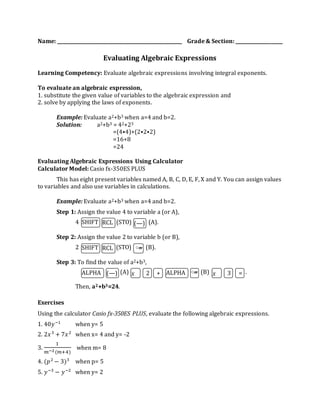
Step 1: Assign the value 4 to variable a (or A),
4 (STO) (A).
SHIFT
T
RCL
T
Step 2: Assign the value 2 to variable b (or B),
2 (STO) (B).
Step 3: To find the value of a2+b3,
(A) (B) .
Then, a2+b3=24.
Exercises
Using the calculator Casio fx-350ES PLUS, evaluate the following algebraic expressions.
1. 40푦−1 when y= 5
2. 2푥 3 + 7푥 2 when x= 4 and y= -2
3.
1
푚−2 (푚+4)
when m= 8
4. (푝2 − 3)3 when p= 5
5. 푦−3 − 푦−2 when y= 2
(—)
SHIFT
T
RCL
T
○‴
ALPHA
T
(—) 푥 2 + ALPHA
T
○‴ 푥 3 =
2. ANSWER KEY
1. 40푦−1= 8
2. 2푥 3 + 7푥 2= 156
3.
1
푚−2 (푚+4)
= 5
1
3
4. (푝2 − 3)3= 10 648
5. 푦−3 − 푦−2 = −
1
8
Prepared by:
Cynthia V. Amboy M. A. Ed. Math
References:
Grade 8 Mathematics Learner’s Module First Edition by Emmanuel P. Abuzo et. al. (2013)
http://edu.casio.com
3. Learning Competency: Graph a linear function given any two points.
One method of graphing a linear equation is using two points. In Geometry, you learned that
two points determine a line. Since the graph of the linear equation is a line, thus two points are
enough to draw a graph of a linear equation.
Example:
Graph the function y = 2x + 1.
Solution:
First step in graphing a function is to construct a table of values of the function.
x 0 1
y
Activity 8 WHAT ARE THE FIRST DIFFERENCES ON Y-VALUES?
Description: This activity will enable you to determine whether a function is linear given
the table.
Direction: Do the task as directed.
Learning Competency: Determine whether a function is linear given the table.
A. Consider the function f defined by f(x) = 3x – 1.
1. Find the values of the functions and complete the table below:
x 0 1 2 3 4
f(x) or y
2. Find the first differences on x-coordinates. Write your answers on the boxes above the
table:
x 0 1 2 3 4
f(x) or y
3. Find the first differences on y-coordinates and write your answers on the boxes below
the table:
x 0 1 2 3 4
f(x) or y
4. QUESTIONS?
1. How did you find the values of the function?
2. What are the first differences on x-coordinates? How did you find them? Are they equal?
3. What are the first differences on y-coordinates? How did you find them? Are they equal?
4. Is the given function linear? Explain.
5. How is the slope m of the function related to the first differences on y-coordinates?
C. Consider the function h defined by h(x) = x2 + 1.
1. Find the values of the functions and complete the following table:
x -2 -1 0 1 2
h(x) or y