SlideShare a Scribd company logo
Disadvantages of SoftwareAvailableforMulti-ParameterVisualizationDisadvantages of SoftwareAvailableforMulti-ParameterVisualization
If parame te r Х3 change s along the ordinate
and Х4 change s along the abscissa the
disadvantage s of the software available
consist of:
•aconsiderablenumber of drawing contour diagram
with parametersХ1 and Х2 fixed;
• the accuracy of the analysis depends on the
discretization along parametersfixed;
•the drawing contour diagrams of the quantity
examined are not arranged one towards another
according to their values.
X1=-1
X2=-1
X1=-1
X2=-0.5
X1=-1
X2=-0
= f (X3, X4) = f (X3, X4)
= f (X3, X4)
To prove the state me nt pre se nte d above the following
e xample can be give n. If discre tization is chose n along Х1
with points [-1, -0.5, 0, 0.5, 1] with X2 =-1 fixe d and it is
acce pte d that Х3 change s along the ordinate and Х4
change s along the abscissa the n:
• a considerable number of diagram patterns can be watched with
parameter Х2 fixed;
• theaccuracy of theanalysisdependson thevery discretization of
theparameter fixed;
• the contour diagrams of quantity Y examined are not arranged
onetowardsanother according to their values.
X1=-1 X1=-0.5 X1=0 X1=0.5 X1=1
X2=-1
Disadvantages of SoftwareAvailableforMulti-ParameterVisualizationDisadvantages of SoftwareAvailableforMulti-ParameterVisualization
(x1, x2, x3, x4)=a1+a2.x1+a3.x2+a4.x3+a5.x4+a6.x1
2
+a7.x1.x2+a8.x1.x3+a9.x1.x4+
+a10.x2
2
+a11.x2.x3+a12.x2.x4+a13.x3
2
+a14.x3.x4+a15.x4
2
a1= 0.4325 a6=-1.196 a11=
2.15432
a2=-0.008248 a7=-0.259 a12=
1.01693
a3=-0.228915 a8= 2.9977 a13=-
1.95535
a4= 0.033695 a9= 0.15847 a14=-
0.944752
It is ne ce ssary to e xamine 25
contour diagrams like the one s pointe d to
the le ft whe re Х1 and Х2 vary in orde r to
orie nt the De cision-Make r in the
discre tization give n along Х1, Х2, Х3 and Х4
with a se t of discre te points [-1, -0.5, 0, 0.5,
1].
In that case the re is only one
proble m and it conce rns the contour
diagrams which are not arrange d one
towards anothe r.
Disadvantages of SoftwareAvailableforMulti-ParameterVisualizationDisadvantages of SoftwareAvailableforMulti-ParameterVisualization
(x1, x2, x3, x4)=a1+a2.x1+a3.x2+a4.x3+a5.x4+a6.x1
2
+a7.x1.x2+a8.x1.x3+a9.x1.x4+
+a10.x2
2
+a11.x2.x3+a12.x2.x4+a13.x3
2
+a14.x3.x4+a15.x4
2
a1= 0.4325 a6=-1.196 a11=
2.15432
a2=-0.008248 a7=-0.259 a12=
1.01693
a3=-0.228915 a8= 2.9977 a13=-
1.95535
a4= 0.033695 a9= 0.15847 a14=-
All thre e -surface diagrams shown above pre se nt the contour diagram information se e n
unde r diffe re nt angle s. The conne ction be twe e n the value of the quantity e xamine d and
the addre ss of the control parame te rs is difficult and not e xact to be indicate d (by the
thre e -surface diagrams).
MADMML®
Principle of Multi-Parame te r VisualizationMADMML®
Principle of Multi-Parame te r Visualization
MADMML®
use s its modification of a contour diagram be cause its thre e -me asure me nt
visualization is inde pe nde nt of the diagram rotation along its ve rtical axis.
MADMML®
use s its modification of a contour diagram be cause its thre e -me asure me nt
visualization is inde pe nde nt of the diagram rotation along its ve rtical axis.
STEPISTEPI
-Re pre se ntation of the are a whe re multi-parame te r visualization will be carrie d out
STEPISTEPI
-Re pre se ntation of the are a whe re multi-parame te r visualization will be carrie d out
MADMML®
Principle of Multi-Parame te r VisualizationMADMML®
Principle of Multi-Parame te r Visualization
STEPIISTEPII
- discre tisation of the fie ld in re lation to parame te r X1 with give n limitations and a ste p of change
STEPIISTEPII
- discre tisation of the fie ld in re lation to parame te r X1 with give n limitations and a ste p of change
MADMML®
Principle of Multi-Parame te r VisualizationMADMML®
Principle of Multi-Parame te r Visualization
X1
STEPIIISTEPIII
- discre tisation of the fie ld in re lation to parame te r X2 with give n limitations and a ste p of
change as we ll as formation of forming an instrume nt to ke e p up with the change s of X1
and X2.
STEPIIISTEPIII
- discre tisation of the fie ld in re lation to parame te r X2 with give n limitations and a ste p of
change as we ll as formation of forming an instrume nt to ke e p up with the change s of X1
and X2.
MADMML®
Principle of Multi-Parame te r VisualizationMADMML®
Principle of Multi-Parame te r Visualization
X1
X2
STEPIVSTEPIV
- discre tisation of the fie ld in re lation to parame te r X3 with give n limitations and a ste p of change
STEPIVSTEPIV
- discre tisation of the fie ld in re lation to parame te r X3 with give n limitations and a ste p of change
MADMML®
Principle of Multi-Parame te r VisualizationMADMML®
Principle of Multi-Parame te r Visualization
X1
X2
X3
STEPVSTEPV
-discre tisation of the fie ld in re lation to parame te r X4 with give n limitations and a ste p of
change as we ll as input of a global addre ss de te rmining syste m according to all variable s
ne ce ssary for visualization of the parame te r mode l.
STEPVSTEPV
-discre tisation of the fie ld in re lation to parame te r X4 with give n limitations and a ste p of
change as we ll as input of a global addre ss de te rmining syste m according to all variable s
ne ce ssary for visualization of the parame te r mode l.
MADMML®
Principle of Multi-Parame te r VisualizationMADMML®
Principle of Multi-Parame te r Visualization
X1
X2
X3
X4
The proce ss of multi-factor analysis is re alize d through MADMMLMADMMLinstrume nts in the
space s of parame te rs. With the indicate d discre tisation, 94
=6561conbination among the
indicate d four variable s are simultane ously analyze d .
The proce ss of multi-factor analysis is re alize d through MADMMLMADMMLinstrume nts in the
space s of parame te rs. With the indicate d discre tisation, 94
=6561conbination among the
indicate d four variable s are simultane ously analyze d .
MADMML®
Principle of Multi-Parame te r VisualizationMADMML®
Principle of Multi-Parame te r Visualization
X1
X2
X3
X4
MADMMLMADMMLinstrume nts of parame te r
space analysis
MADMMLMADMMLinstrume nts of parame te r
space analysis
The approach so de fine d is dynamicallyThe approach so de fine d is dynamically
illustrate d by the Compass De vice of MADMMLillustrate d by the Compass De vice of MADMML
The movable limits possibilitie s with theThe movable limits possibilitie s with the
analysis only of one of the crite ria is re ve ale d by aanalysis only of one of the crite ria is re ve ale d by a
numbe r of slide s following be low:numbe r of slide s following be low:
Y[1] 0 .. 90 %
Y[2] 90 .. 100 %
Y(x1, x2, x3, x4)=a1+a2.x1+a3.x2+a4.x3+a5.x4+a6.x1
2
+a7.x1.x2+a8.x1.x3+a9.x1.x4+
+a10.x2
2
+a11.x2.x3+a12.x2.x4+a13.x3
2
+a14.x3.x4+a15.x4
2
a1= 0.4325 a6=-1.196 a11= 2.15432
a2=-0.008248 a7=-0.259 a12= 1.01693
a3=-0.228915 a8= 2.9977 a13=-
1.95535
a4= 0.033695 a9= 0.15847 a14=-
0.944752
a5= 0.003165 a10= 0.61596 a15=
Single -crite ria analysis with movable
limits
The method helps in
determining the direction of
searching. The zones colored
in green show areas where the
values of the quantity
examined areover 90%
Y[1] between 0 .. 96 %
Y[2] between 96 .. 97 %
Y[3] between 97 .. 98 %
Y[4] between 98 .. 99 %
Y[5] between 99 .. 100 %
Single -crite ria analysis with movable
limits
Localizing the area and
determining certain solutions.
Representing the solutions by
appropriatecontour diagrams
Y[1] 0 .. 60 %
Y[2] 60 .. 70 %
Y[3] 70 .. 80 %
Y[4] 80 .. 90 %
Y[5] 90 .. 100 %
Y[1] 0 .. 80 %
Y[2] 80 .. 85 %
Y[3] 85 .. 90 %
Y[4] 90 .. 95 %
Y[5] 95 .. 100 %
Y[1] 0 .. 80 %
Y[2] 85 .. 90 %
Y[3] 90 .. 95 %
Y[4] 95 .. 99 %
Y[5] 99 .. 100 %
Y[1] 0 .. 92 %
Y[2] 92 .. 94 %
Y[3] 94 .. 96 %
Y[4] 96 .. 98 %
Y[5] 98 .. 100 %
Single -crite ria analysis with movable
limits
Determining parameters characterized by
near values in the space examined with the
movement of “cutting” values up towards the
maximum.
Y[1] 0 .. 2 %
Y[2] 2 .. 4 %
Y[3] 4 .. 6 %
Y[4] 6 .. 8 %
Y[5] 8 .. 100 %
Y[1] 0 .. 5 %
Y[2] 5 .. 10 %
Y[3] 10 .. 15 %
Y[4] 15 .. 20 %
Y[5] 20 .. 100 %
Y[1] 0 .. 10 %
Y[2] 10 .. 20 %
Y[3] 20 .. 30 %
Y[4] 30 .. 40 %
Y[5] 40 .. 100 %
Y[1] 0 .. 30 %
Y[2] 30 .. 40 %
Y[3] 40 .. 50 %
Y[4] 50 .. 60 %
Y[5] 60 .. 100 %
Single -crite ria analysis with movable
limits
Determining parameters characterized by near
values in the space examined with the
movement of “cutting” values down towards
theminimum.
Y[1] 0 .. 80 %
Y[2] 80 .. 81 %
Y[3] 81 .. 100 %
Y(x1, x2, x3, x4)=a1+a2.x1+a3.x2+a4.x3+a5.x4+a6.x1
2
+a7.x1.x2+a8.x1.x3+a9.x1.x4+
+a10.x2
2
+a11.x2.x3+a12.x2.x4+a13.x3
2
+a14.x3.x4+a15.x4
2
a1= 0.4325 a6=-1.196 a11= 2.15432
a2=-0.008248 a7=-0.259 a12= 1.01693
a3=-0.228915 a8= 2.9977 a13=-
1.95535
a4= 0.033695 a9= 0.15847 a14=-
0.944752
a5= 0.003165 a10= 0.61596 a15=
Single -crite ria analysis with movable
limits
Determining the states where the
quality parameter contains an
exactly determined value. The
value of the quantity examined in
all areas colored in green are
within the interval between 80%
and 81%.

More Related Content

What's hot

Es272 ch5a
Es272 ch5aEs272 ch5a
H infinity optimal_approximation_for_cau
H infinity optimal_approximation_for_cauH infinity optimal_approximation_for_cau
H infinity optimal_approximation_for_cau
Al Vc
 
Cs8092 computer graphics and multimedia unit 3
Cs8092 computer graphics and multimedia unit 3Cs8092 computer graphics and multimedia unit 3
Cs8092 computer graphics and multimedia unit 3
SIMONTHOMAS S
 
Finite frequency H∞ control for wind turbine systems in T-S form
Finite frequency H∞ control for wind turbine systems in T-S formFinite frequency H∞ control for wind turbine systems in T-S form
Finite frequency H∞ control for wind turbine systems in T-S form
International Journal of Power Electronics and Drive Systems
 
Skiena algorithm 2007 lecture13 minimum spanning trees
Skiena algorithm 2007 lecture13 minimum spanning treesSkiena algorithm 2007 lecture13 minimum spanning trees
Skiena algorithm 2007 lecture13 minimum spanning trees
zukun
 
PMF BPMF and BPTF
PMF BPMF and BPTFPMF BPMF and BPTF
PMF BPMF and BPTF
Pei-Che Chang
 
17_monte_carlo.pdf
17_monte_carlo.pdf17_monte_carlo.pdf
17_monte_carlo.pdf
KSChidanandKumarJSSS
 
QMC: Operator Splitting Workshop, Using Sequences of Iterates in Inertial Met...
QMC: Operator Splitting Workshop, Using Sequences of Iterates in Inertial Met...QMC: Operator Splitting Workshop, Using Sequences of Iterates in Inertial Met...
QMC: Operator Splitting Workshop, Using Sequences of Iterates in Inertial Met...
The Statistical and Applied Mathematical Sciences Institute
 
gnm: a Package for Generalized Nonlinear Models
gnm: a Package for Generalized Nonlinear Modelsgnm: a Package for Generalized Nonlinear Models
gnm: a Package for Generalized Nonlinear Models
htstatistics
 
From L to N: Nonlinear Predictors in Generalized Models
From L to N: Nonlinear Predictors in Generalized ModelsFrom L to N: Nonlinear Predictors in Generalized Models
From L to N: Nonlinear Predictors in Generalized Models
htstatistics
 
Secure Domination in graphs
Secure Domination in graphsSecure Domination in graphs
Secure Domination in graphs
Mahesh Gadhwal
 
Multiplicative Interaction Models in R
Multiplicative Interaction Models in RMultiplicative Interaction Models in R
Multiplicative Interaction Models in R
htstatistics
 
Matlab ploting
Matlab plotingMatlab ploting
Matlab ploting
Ameen San
 
When is undersampling effective in unbalanced classification tasks?
When is undersampling effective in unbalanced classification tasks?When is undersampling effective in unbalanced classification tasks?
When is undersampling effective in unbalanced classification tasks?
Andrea Dal Pozzolo
 
Kriging and spatial design accelerated by orders of magnitude
Kriging and spatial design accelerated by orders of magnitudeKriging and spatial design accelerated by orders of magnitude
Kriging and spatial design accelerated by orders of magnitude
Alexander Litvinenko
 
Lec 3 continuous random variable
Lec 3 continuous random variableLec 3 continuous random variable
Lec 3 continuous random variable
cairo university
 
CLIM Fall 2017 Course: Statistics for Climate Research, Spatial Data: Models ...
CLIM Fall 2017 Course: Statistics for Climate Research, Spatial Data: Models ...CLIM Fall 2017 Course: Statistics for Climate Research, Spatial Data: Models ...
CLIM Fall 2017 Course: Statistics for Climate Research, Spatial Data: Models ...
The Statistical and Applied Mathematical Sciences Institute
 
Stochastic Analysis of Van der Pol OscillatorModel Using Wiener HermiteExpans...
Stochastic Analysis of Van der Pol OscillatorModel Using Wiener HermiteExpans...Stochastic Analysis of Van der Pol OscillatorModel Using Wiener HermiteExpans...
Stochastic Analysis of Van der Pol OscillatorModel Using Wiener HermiteExpans...
IJERA Editor
 
Stochastic Analysis of Van der Pol OscillatorModel Using Wiener HermiteExpans...
Stochastic Analysis of Van der Pol OscillatorModel Using Wiener HermiteExpans...Stochastic Analysis of Van der Pol OscillatorModel Using Wiener HermiteExpans...
Stochastic Analysis of Van der Pol OscillatorModel Using Wiener HermiteExpans...
IJERA Editor
 
ICPR 2016
ICPR 2016ICPR 2016

What's hot (20)

Es272 ch5a
Es272 ch5aEs272 ch5a
Es272 ch5a
 
H infinity optimal_approximation_for_cau
H infinity optimal_approximation_for_cauH infinity optimal_approximation_for_cau
H infinity optimal_approximation_for_cau
 
Cs8092 computer graphics and multimedia unit 3
Cs8092 computer graphics and multimedia unit 3Cs8092 computer graphics and multimedia unit 3
Cs8092 computer graphics and multimedia unit 3
 
Finite frequency H∞ control for wind turbine systems in T-S form
Finite frequency H∞ control for wind turbine systems in T-S formFinite frequency H∞ control for wind turbine systems in T-S form
Finite frequency H∞ control for wind turbine systems in T-S form
 
Skiena algorithm 2007 lecture13 minimum spanning trees
Skiena algorithm 2007 lecture13 minimum spanning treesSkiena algorithm 2007 lecture13 minimum spanning trees
Skiena algorithm 2007 lecture13 minimum spanning trees
 
PMF BPMF and BPTF
PMF BPMF and BPTFPMF BPMF and BPTF
PMF BPMF and BPTF
 
17_monte_carlo.pdf
17_monte_carlo.pdf17_monte_carlo.pdf
17_monte_carlo.pdf
 
QMC: Operator Splitting Workshop, Using Sequences of Iterates in Inertial Met...
QMC: Operator Splitting Workshop, Using Sequences of Iterates in Inertial Met...QMC: Operator Splitting Workshop, Using Sequences of Iterates in Inertial Met...
QMC: Operator Splitting Workshop, Using Sequences of Iterates in Inertial Met...
 
gnm: a Package for Generalized Nonlinear Models
gnm: a Package for Generalized Nonlinear Modelsgnm: a Package for Generalized Nonlinear Models
gnm: a Package for Generalized Nonlinear Models
 
From L to N: Nonlinear Predictors in Generalized Models
From L to N: Nonlinear Predictors in Generalized ModelsFrom L to N: Nonlinear Predictors in Generalized Models
From L to N: Nonlinear Predictors in Generalized Models
 
Secure Domination in graphs
Secure Domination in graphsSecure Domination in graphs
Secure Domination in graphs
 
Multiplicative Interaction Models in R
Multiplicative Interaction Models in RMultiplicative Interaction Models in R
Multiplicative Interaction Models in R
 
Matlab ploting
Matlab plotingMatlab ploting
Matlab ploting
 
When is undersampling effective in unbalanced classification tasks?
When is undersampling effective in unbalanced classification tasks?When is undersampling effective in unbalanced classification tasks?
When is undersampling effective in unbalanced classification tasks?
 
Kriging and spatial design accelerated by orders of magnitude
Kriging and spatial design accelerated by orders of magnitudeKriging and spatial design accelerated by orders of magnitude
Kriging and spatial design accelerated by orders of magnitude
 
Lec 3 continuous random variable
Lec 3 continuous random variableLec 3 continuous random variable
Lec 3 continuous random variable
 
CLIM Fall 2017 Course: Statistics for Climate Research, Spatial Data: Models ...
CLIM Fall 2017 Course: Statistics for Climate Research, Spatial Data: Models ...CLIM Fall 2017 Course: Statistics for Climate Research, Spatial Data: Models ...
CLIM Fall 2017 Course: Statistics for Climate Research, Spatial Data: Models ...
 
Stochastic Analysis of Van der Pol OscillatorModel Using Wiener HermiteExpans...
Stochastic Analysis of Van der Pol OscillatorModel Using Wiener HermiteExpans...Stochastic Analysis of Van der Pol OscillatorModel Using Wiener HermiteExpans...
Stochastic Analysis of Van der Pol OscillatorModel Using Wiener HermiteExpans...
 
Stochastic Analysis of Van der Pol OscillatorModel Using Wiener HermiteExpans...
Stochastic Analysis of Van der Pol OscillatorModel Using Wiener HermiteExpans...Stochastic Analysis of Van der Pol OscillatorModel Using Wiener HermiteExpans...
Stochastic Analysis of Van der Pol OscillatorModel Using Wiener HermiteExpans...
 
ICPR 2016
ICPR 2016ICPR 2016
ICPR 2016
 

Viewers also liked

info 476 systems analyst report
info 476 systems analyst reportinfo 476 systems analyst report
info 476 systems analyst report
James Peterson
 
info 476 design report
info 476 design reportinfo 476 design report
info 476 design report
James Peterson
 
Las playas del norte son muy lindas
Las playas del norte son muy lindasLas playas del norte son muy lindas
Las playas del norte son muy lindas
Yaneth Flores Rivera
 
megha-resume
megha-resumemegha-resume
megha-resume
MEGHA SHARMA
 
LGD_presentation
LGD_presentationLGD_presentation
LGD_presentation
TRACY REDWOOD
 
BRet's Presrwentation
BRet's PresrwentationBRet's Presrwentation
BRet's Presrwentation
CaptainBret
 
Computer
ComputerComputer
Computer
Gaya, India
 
3 d printing
3 d printing3 d printing
3 d printing
naweed ahmad razaqi
 
Sy-nergy menukaart
Sy-nergy menukaartSy-nergy menukaart
Sy-nergy menukaart
ing. Pascal Snellen RSE
 
Sy-nergy menukaart
Sy-nergy menukaartSy-nergy menukaart
Sy-nergy menukaart
ing. Pascal Snellen RSE
 
Media Independent Practitioners of Nigeria
Media Independent Practitioners of NigeriaMedia Independent Practitioners of Nigeria
Media Independent Practitioners of Nigeria
kingsley Udofa
 
Supply chain manager qaisar nadeem
Supply chain manager qaisar nadeemSupply chain manager qaisar nadeem
Supply chain manager qaisar nadeem
Qaisar Nadeem
 
Cover halaman judul
Cover halaman judulCover halaman judul
Cover halaman judul
orinilo
 
3 d printing
3 d printing3 d printing
3 d printing
naweed ahmad razaqi
 
Prefixes
PrefixesPrefixes
Prefixes
Jana Olson
 
Tal Feldman
Tal FeldmanTal Feldman
Tal Feldman
TAL FELDMAN
 
AHMAD MOSTAFA C.V
AHMAD MOSTAFA C.VAHMAD MOSTAFA C.V
AHMAD MOSTAFA C.V
Ahmad Mostafa
 
Sy-nergy menukaart
Sy-nergy menukaartSy-nergy menukaart
Sy-nergy menukaart
ing. Pascal Snellen RSE
 
Avinash_resume
Avinash_resumeAvinash_resume

Viewers also liked (20)

info 476 systems analyst report
info 476 systems analyst reportinfo 476 systems analyst report
info 476 systems analyst report
 
info 476 design report
info 476 design reportinfo 476 design report
info 476 design report
 
Las playas del norte son muy lindas
Las playas del norte son muy lindasLas playas del norte son muy lindas
Las playas del norte son muy lindas
 
megha-resume
megha-resumemegha-resume
megha-resume
 
LGD_presentation
LGD_presentationLGD_presentation
LGD_presentation
 
BRet's Presrwentation
BRet's PresrwentationBRet's Presrwentation
BRet's Presrwentation
 
Computer
ComputerComputer
Computer
 
3 d printing
3 d printing3 d printing
3 d printing
 
Sy-nergy menukaart
Sy-nergy menukaartSy-nergy menukaart
Sy-nergy menukaart
 
Sy-nergy menukaart
Sy-nergy menukaartSy-nergy menukaart
Sy-nergy menukaart
 
Media Independent Practitioners of Nigeria
Media Independent Practitioners of NigeriaMedia Independent Practitioners of Nigeria
Media Independent Practitioners of Nigeria
 
Supply chain manager qaisar nadeem
Supply chain manager qaisar nadeemSupply chain manager qaisar nadeem
Supply chain manager qaisar nadeem
 
Cover halaman judul
Cover halaman judulCover halaman judul
Cover halaman judul
 
Outsourcing
OutsourcingOutsourcing
Outsourcing
 
3 d printing
3 d printing3 d printing
3 d printing
 
Prefixes
PrefixesPrefixes
Prefixes
 
Tal Feldman
Tal FeldmanTal Feldman
Tal Feldman
 
AHMAD MOSTAFA C.V
AHMAD MOSTAFA C.VAHMAD MOSTAFA C.V
AHMAD MOSTAFA C.V
 
Sy-nergy menukaart
Sy-nergy menukaartSy-nergy menukaart
Sy-nergy menukaart
 
Avinash_resume
Avinash_resumeAvinash_resume
Avinash_resume
 

Similar to 3_MADMML

GlobalLogic Machine Learning Webinar “Advanced Statistical Methods for Linear...
GlobalLogic Machine Learning Webinar “Advanced Statistical Methods for Linear...GlobalLogic Machine Learning Webinar “Advanced Statistical Methods for Linear...
GlobalLogic Machine Learning Webinar “Advanced Statistical Methods for Linear...
GlobalLogic Ukraine
 
ITS World Congress :: Vienna, Oct 2012
ITS World Congress :: Vienna, Oct 2012ITS World Congress :: Vienna, Oct 2012
ITS World Congress :: Vienna, Oct 2012
László Nádai
 
Mvs adas
Mvs adasMvs adas
Mvs adas
Sanket Borhade
 
EE660_Report_YaxinLiu_8448347171
EE660_Report_YaxinLiu_8448347171EE660_Report_YaxinLiu_8448347171
EE660_Report_YaxinLiu_8448347171
Yaxin Liu
 
STATA Appplication.pptx
STATA Appplication.pptxSTATA Appplication.pptx
STATA Appplication.pptx
Tesfa21
 
Tbs910 regression models
Tbs910 regression modelsTbs910 regression models
Tbs910 regression models
Stephen Ong
 
Computer Vision: Feature matching with RANSAC Algorithm
Computer Vision: Feature matching with RANSAC AlgorithmComputer Vision: Feature matching with RANSAC Algorithm
Computer Vision: Feature matching with RANSAC Algorithm
allyn joy calcaben
 
Module-5-1_230523_171754 (1).pdf
Module-5-1_230523_171754 (1).pdfModule-5-1_230523_171754 (1).pdf
Module-5-1_230523_171754 (1).pdf
vikasmittal92
 
Machine learning Introduction
Machine learning IntroductionMachine learning Introduction
Machine learning Introduction
Kuppusamy P
 
Introduction to Support Vector Machines
Introduction to Support Vector MachinesIntroduction to Support Vector Machines
Introduction to Support Vector Machines
Silicon Mentor
 
Linear Regression.pptx
Linear Regression.pptxLinear Regression.pptx
Linear Regression.pptx
Ramakrishna Reddy Bijjam
 
Simple lin regress_inference
Simple lin regress_inferenceSimple lin regress_inference
Simple lin regress_inference
Kemal İnciroğlu
 
Scale Invariant Feature Tranform
Scale Invariant Feature TranformScale Invariant Feature Tranform
Scale Invariant Feature Tranform
Shanker Naik
 
Rsh qam11 ch04 ge
Rsh qam11 ch04 geRsh qam11 ch04 ge
Rsh qam11 ch04 ge
Firas Husseini
 
Svm map reduce_slides
Svm map reduce_slidesSvm map reduce_slides
Svm map reduce_slides
Sara Asher
 
Literature Survey on Interest Points based Watermarking
Literature Survey on Interest Points based WatermarkingLiterature Survey on Interest Points based Watermarking
Literature Survey on Interest Points based Watermarking
Priyatham Bollimpalli
 
Chapter10 image segmentation
Chapter10 image segmentationChapter10 image segmentation
Chapter10 image segmentation
asodariyabhavesh
 
casestudy_important.pptx
casestudy_important.pptxcasestudy_important.pptx
casestudy_important.pptx
ssuser31398b
 
Quantitative techniques
Quantitative techniquesQuantitative techniques
Quantitative techniques
Asif Bodla
 
Forecasting Default Probabilities in Emerging Markets and Dynamical Regula...
Forecasting Default Probabilities  in Emerging Markets and   Dynamical Regula...Forecasting Default Probabilities  in Emerging Markets and   Dynamical Regula...
Forecasting Default Probabilities in Emerging Markets and Dynamical Regula...
SSA KPI
 

Similar to 3_MADMML (20)

GlobalLogic Machine Learning Webinar “Advanced Statistical Methods for Linear...
GlobalLogic Machine Learning Webinar “Advanced Statistical Methods for Linear...GlobalLogic Machine Learning Webinar “Advanced Statistical Methods for Linear...
GlobalLogic Machine Learning Webinar “Advanced Statistical Methods for Linear...
 
ITS World Congress :: Vienna, Oct 2012
ITS World Congress :: Vienna, Oct 2012ITS World Congress :: Vienna, Oct 2012
ITS World Congress :: Vienna, Oct 2012
 
Mvs adas
Mvs adasMvs adas
Mvs adas
 
EE660_Report_YaxinLiu_8448347171
EE660_Report_YaxinLiu_8448347171EE660_Report_YaxinLiu_8448347171
EE660_Report_YaxinLiu_8448347171
 
STATA Appplication.pptx
STATA Appplication.pptxSTATA Appplication.pptx
STATA Appplication.pptx
 
Tbs910 regression models
Tbs910 regression modelsTbs910 regression models
Tbs910 regression models
 
Computer Vision: Feature matching with RANSAC Algorithm
Computer Vision: Feature matching with RANSAC AlgorithmComputer Vision: Feature matching with RANSAC Algorithm
Computer Vision: Feature matching with RANSAC Algorithm
 
Module-5-1_230523_171754 (1).pdf
Module-5-1_230523_171754 (1).pdfModule-5-1_230523_171754 (1).pdf
Module-5-1_230523_171754 (1).pdf
 
Machine learning Introduction
Machine learning IntroductionMachine learning Introduction
Machine learning Introduction
 
Introduction to Support Vector Machines
Introduction to Support Vector MachinesIntroduction to Support Vector Machines
Introduction to Support Vector Machines
 
Linear Regression.pptx
Linear Regression.pptxLinear Regression.pptx
Linear Regression.pptx
 
Simple lin regress_inference
Simple lin regress_inferenceSimple lin regress_inference
Simple lin regress_inference
 
Scale Invariant Feature Tranform
Scale Invariant Feature TranformScale Invariant Feature Tranform
Scale Invariant Feature Tranform
 
Rsh qam11 ch04 ge
Rsh qam11 ch04 geRsh qam11 ch04 ge
Rsh qam11 ch04 ge
 
Svm map reduce_slides
Svm map reduce_slidesSvm map reduce_slides
Svm map reduce_slides
 
Literature Survey on Interest Points based Watermarking
Literature Survey on Interest Points based WatermarkingLiterature Survey on Interest Points based Watermarking
Literature Survey on Interest Points based Watermarking
 
Chapter10 image segmentation
Chapter10 image segmentationChapter10 image segmentation
Chapter10 image segmentation
 
casestudy_important.pptx
casestudy_important.pptxcasestudy_important.pptx
casestudy_important.pptx
 
Quantitative techniques
Quantitative techniquesQuantitative techniques
Quantitative techniques
 
Forecasting Default Probabilities in Emerging Markets and Dynamical Regula...
Forecasting Default Probabilities  in Emerging Markets and   Dynamical Regula...Forecasting Default Probabilities  in Emerging Markets and   Dynamical Regula...
Forecasting Default Probabilities in Emerging Markets and Dynamical Regula...
 

3_MADMML

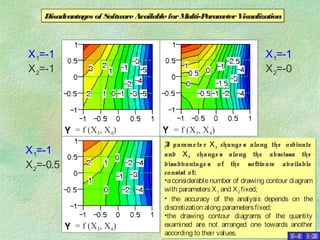
  • 1. Disadvantages of SoftwareAvailableforMulti-ParameterVisualizationDisadvantages of SoftwareAvailableforMulti-ParameterVisualization If parame te r Х3 change s along the ordinate and Х4 change s along the abscissa the disadvantage s of the software available consist of: •aconsiderablenumber of drawing contour diagram with parametersХ1 and Х2 fixed; • the accuracy of the analysis depends on the discretization along parametersfixed; •the drawing contour diagrams of the quantity examined are not arranged one towards another according to their values. If parame te r Х3 change s along the ordinate and Х4 change s along the abscissa the disadvantage s of the software available consist of: •aconsiderablenumber of drawing contour diagram with parametersХ1 and Х2 fixed; • the accuracy of the analysis depends on the discretization along parametersfixed; •the drawing contour diagrams of the quantity examined are not arranged one towards another according to their values. X1=-1 X2=-1 X1=-1 X2=-0.5 X1=-1 X2=-0 = f (X3, X4) = f (X3, X4) = f (X3, X4)
  • 2. To prove the state me nt pre se nte d above the following e xample can be give n. If discre tization is chose n along Х1 with points [-1, -0.5, 0, 0.5, 1] with X2 =-1 fixe d and it is acce pte d that Х3 change s along the ordinate and Х4 change s along the abscissa the n: • a considerable number of diagram patterns can be watched with parameter Х2 fixed; • theaccuracy of theanalysisdependson thevery discretization of theparameter fixed; • the contour diagrams of quantity Y examined are not arranged onetowardsanother according to their values. To prove the state me nt pre se nte d above the following e xample can be give n. If discre tization is chose n along Х1 with points [-1, -0.5, 0, 0.5, 1] with X2 =-1 fixe d and it is acce pte d that Х3 change s along the ordinate and Х4 change s along the abscissa the n: • a considerable number of diagram patterns can be watched with parameter Х2 fixed; • theaccuracy of theanalysisdependson thevery discretization of theparameter fixed; • the contour diagrams of quantity Y examined are not arranged onetowardsanother according to their values. X1=-1 X1=-0.5 X1=0 X1=0.5 X1=1 X2=-1 Disadvantages of SoftwareAvailableforMulti-ParameterVisualizationDisadvantages of SoftwareAvailableforMulti-ParameterVisualization (x1, x2, x3, x4)=a1+a2.x1+a3.x2+a4.x3+a5.x4+a6.x1 2 +a7.x1.x2+a8.x1.x3+a9.x1.x4+ +a10.x2 2 +a11.x2.x3+a12.x2.x4+a13.x3 2 +a14.x3.x4+a15.x4 2 a1= 0.4325 a6=-1.196 a11= 2.15432 a2=-0.008248 a7=-0.259 a12= 1.01693 a3=-0.228915 a8= 2.9977 a13=- 1.95535 a4= 0.033695 a9= 0.15847 a14=- 0.944752
  • 3. It is ne ce ssary to e xamine 25 contour diagrams like the one s pointe d to the le ft whe re Х1 and Х2 vary in orde r to orie nt the De cision-Make r in the discre tization give n along Х1, Х2, Х3 and Х4 with a se t of discre te points [-1, -0.5, 0, 0.5, 1]. In that case the re is only one proble m and it conce rns the contour diagrams which are not arrange d one towards anothe r. It is ne ce ssary to e xamine 25 contour diagrams like the one s pointe d to the le ft whe re Х1 and Х2 vary in orde r to orie nt the De cision-Make r in the discre tization give n along Х1, Х2, Х3 and Х4 with a se t of discre te points [-1, -0.5, 0, 0.5, 1]. In that case the re is only one proble m and it conce rns the contour diagrams which are not arrange d one towards anothe r. Disadvantages of SoftwareAvailableforMulti-ParameterVisualizationDisadvantages of SoftwareAvailableforMulti-ParameterVisualization (x1, x2, x3, x4)=a1+a2.x1+a3.x2+a4.x3+a5.x4+a6.x1 2 +a7.x1.x2+a8.x1.x3+a9.x1.x4+ +a10.x2 2 +a11.x2.x3+a12.x2.x4+a13.x3 2 +a14.x3.x4+a15.x4 2 a1= 0.4325 a6=-1.196 a11= 2.15432 a2=-0.008248 a7=-0.259 a12= 1.01693 a3=-0.228915 a8= 2.9977 a13=- 1.95535 a4= 0.033695 a9= 0.15847 a14=-
  • 4. All thre e -surface diagrams shown above pre se nt the contour diagram information se e n unde r diffe re nt angle s. The conne ction be twe e n the value of the quantity e xamine d and the addre ss of the control parame te rs is difficult and not e xact to be indicate d (by the thre e -surface diagrams). All thre e -surface diagrams shown above pre se nt the contour diagram information se e n unde r diffe re nt angle s. The conne ction be twe e n the value of the quantity e xamine d and the addre ss of the control parame te rs is difficult and not e xact to be indicate d (by the thre e -surface diagrams). MADMML® Principle of Multi-Parame te r VisualizationMADMML® Principle of Multi-Parame te r Visualization MADMML® use s its modification of a contour diagram be cause its thre e -me asure me nt visualization is inde pe nde nt of the diagram rotation along its ve rtical axis. MADMML® use s its modification of a contour diagram be cause its thre e -me asure me nt visualization is inde pe nde nt of the diagram rotation along its ve rtical axis.
  • 5. STEPISTEPI -Re pre se ntation of the are a whe re multi-parame te r visualization will be carrie d out STEPISTEPI -Re pre se ntation of the are a whe re multi-parame te r visualization will be carrie d out MADMML® Principle of Multi-Parame te r VisualizationMADMML® Principle of Multi-Parame te r Visualization
  • 6. STEPIISTEPII - discre tisation of the fie ld in re lation to parame te r X1 with give n limitations and a ste p of change STEPIISTEPII - discre tisation of the fie ld in re lation to parame te r X1 with give n limitations and a ste p of change MADMML® Principle of Multi-Parame te r VisualizationMADMML® Principle of Multi-Parame te r Visualization X1
  • 7. STEPIIISTEPIII - discre tisation of the fie ld in re lation to parame te r X2 with give n limitations and a ste p of change as we ll as formation of forming an instrume nt to ke e p up with the change s of X1 and X2. STEPIIISTEPIII - discre tisation of the fie ld in re lation to parame te r X2 with give n limitations and a ste p of change as we ll as formation of forming an instrume nt to ke e p up with the change s of X1 and X2. MADMML® Principle of Multi-Parame te r VisualizationMADMML® Principle of Multi-Parame te r Visualization X1 X2
  • 8. STEPIVSTEPIV - discre tisation of the fie ld in re lation to parame te r X3 with give n limitations and a ste p of change STEPIVSTEPIV - discre tisation of the fie ld in re lation to parame te r X3 with give n limitations and a ste p of change MADMML® Principle of Multi-Parame te r VisualizationMADMML® Principle of Multi-Parame te r Visualization X1 X2 X3
  • 9. STEPVSTEPV -discre tisation of the fie ld in re lation to parame te r X4 with give n limitations and a ste p of change as we ll as input of a global addre ss de te rmining syste m according to all variable s ne ce ssary for visualization of the parame te r mode l. STEPVSTEPV -discre tisation of the fie ld in re lation to parame te r X4 with give n limitations and a ste p of change as we ll as input of a global addre ss de te rmining syste m according to all variable s ne ce ssary for visualization of the parame te r mode l. MADMML® Principle of Multi-Parame te r VisualizationMADMML® Principle of Multi-Parame te r Visualization X1 X2 X3 X4
  • 10. The proce ss of multi-factor analysis is re alize d through MADMMLMADMMLinstrume nts in the space s of parame te rs. With the indicate d discre tisation, 94 =6561conbination among the indicate d four variable s are simultane ously analyze d . The proce ss of multi-factor analysis is re alize d through MADMMLMADMMLinstrume nts in the space s of parame te rs. With the indicate d discre tisation, 94 =6561conbination among the indicate d four variable s are simultane ously analyze d . MADMML® Principle of Multi-Parame te r VisualizationMADMML® Principle of Multi-Parame te r Visualization X1 X2 X3 X4 MADMMLMADMMLinstrume nts of parame te r space analysis MADMMLMADMMLinstrume nts of parame te r space analysis
  • 11. The approach so de fine d is dynamicallyThe approach so de fine d is dynamically illustrate d by the Compass De vice of MADMMLillustrate d by the Compass De vice of MADMML The movable limits possibilitie s with theThe movable limits possibilitie s with the analysis only of one of the crite ria is re ve ale d by aanalysis only of one of the crite ria is re ve ale d by a numbe r of slide s following be low:numbe r of slide s following be low:
  • 12. Y[1] 0 .. 90 % Y[2] 90 .. 100 % Y(x1, x2, x3, x4)=a1+a2.x1+a3.x2+a4.x3+a5.x4+a6.x1 2 +a7.x1.x2+a8.x1.x3+a9.x1.x4+ +a10.x2 2 +a11.x2.x3+a12.x2.x4+a13.x3 2 +a14.x3.x4+a15.x4 2 a1= 0.4325 a6=-1.196 a11= 2.15432 a2=-0.008248 a7=-0.259 a12= 1.01693 a3=-0.228915 a8= 2.9977 a13=- 1.95535 a4= 0.033695 a9= 0.15847 a14=- 0.944752 a5= 0.003165 a10= 0.61596 a15= Single -crite ria analysis with movable limits The method helps in determining the direction of searching. The zones colored in green show areas where the values of the quantity examined areover 90%
  • 13. Y[1] between 0 .. 96 % Y[2] between 96 .. 97 % Y[3] between 97 .. 98 % Y[4] between 98 .. 99 % Y[5] between 99 .. 100 % Single -crite ria analysis with movable limits Localizing the area and determining certain solutions. Representing the solutions by appropriatecontour diagrams
  • 14. Y[1] 0 .. 60 % Y[2] 60 .. 70 % Y[3] 70 .. 80 % Y[4] 80 .. 90 % Y[5] 90 .. 100 % Y[1] 0 .. 80 % Y[2] 80 .. 85 % Y[3] 85 .. 90 % Y[4] 90 .. 95 % Y[5] 95 .. 100 % Y[1] 0 .. 80 % Y[2] 85 .. 90 % Y[3] 90 .. 95 % Y[4] 95 .. 99 % Y[5] 99 .. 100 % Y[1] 0 .. 92 % Y[2] 92 .. 94 % Y[3] 94 .. 96 % Y[4] 96 .. 98 % Y[5] 98 .. 100 % Single -crite ria analysis with movable limits Determining parameters characterized by near values in the space examined with the movement of “cutting” values up towards the maximum.
  • 15. Y[1] 0 .. 2 % Y[2] 2 .. 4 % Y[3] 4 .. 6 % Y[4] 6 .. 8 % Y[5] 8 .. 100 % Y[1] 0 .. 5 % Y[2] 5 .. 10 % Y[3] 10 .. 15 % Y[4] 15 .. 20 % Y[5] 20 .. 100 % Y[1] 0 .. 10 % Y[2] 10 .. 20 % Y[3] 20 .. 30 % Y[4] 30 .. 40 % Y[5] 40 .. 100 % Y[1] 0 .. 30 % Y[2] 30 .. 40 % Y[3] 40 .. 50 % Y[4] 50 .. 60 % Y[5] 60 .. 100 % Single -crite ria analysis with movable limits Determining parameters characterized by near values in the space examined with the movement of “cutting” values down towards theminimum.
  • 16. Y[1] 0 .. 80 % Y[2] 80 .. 81 % Y[3] 81 .. 100 % Y(x1, x2, x3, x4)=a1+a2.x1+a3.x2+a4.x3+a5.x4+a6.x1 2 +a7.x1.x2+a8.x1.x3+a9.x1.x4+ +a10.x2 2 +a11.x2.x3+a12.x2.x4+a13.x3 2 +a14.x3.x4+a15.x4 2 a1= 0.4325 a6=-1.196 a11= 2.15432 a2=-0.008248 a7=-0.259 a12= 1.01693 a3=-0.228915 a8= 2.9977 a13=- 1.95535 a4= 0.033695 a9= 0.15847 a14=- 0.944752 a5= 0.003165 a10= 0.61596 a15= Single -crite ria analysis with movable limits Determining the states where the quality parameter contains an exactly determined value. The value of the quantity examined in all areas colored in green are within the interval between 80% and 81%.