Downloaded 56 times
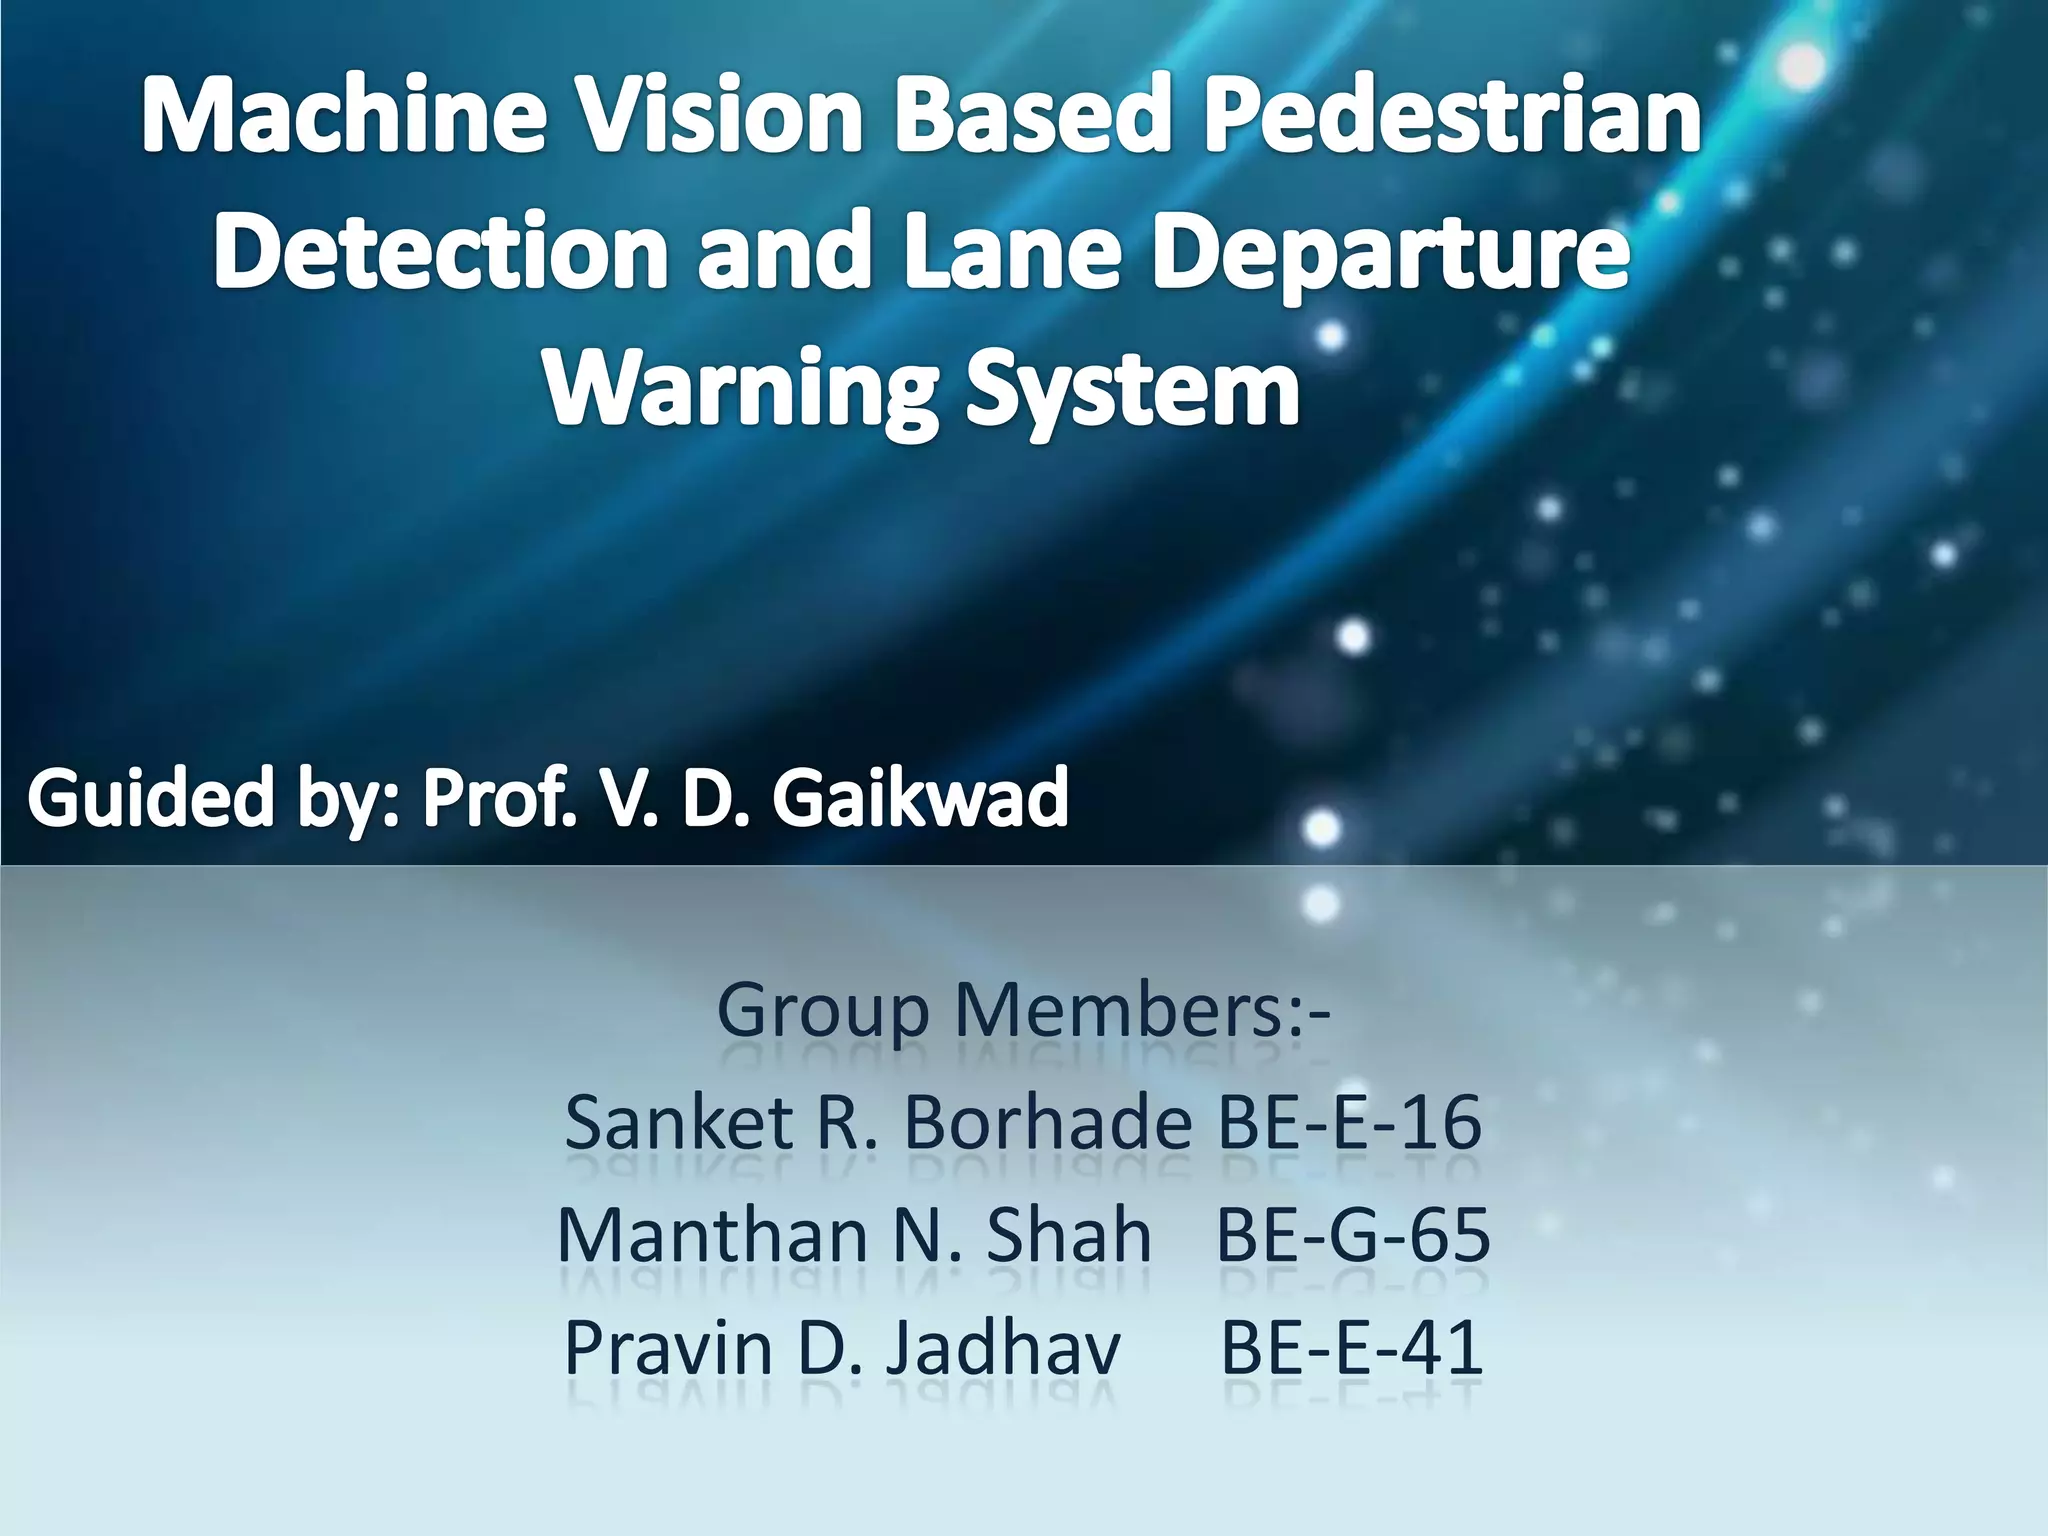


![LDWS
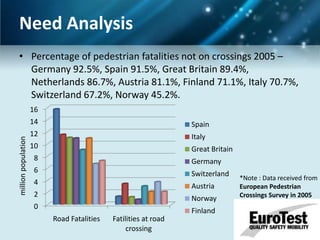
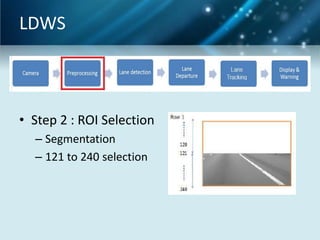
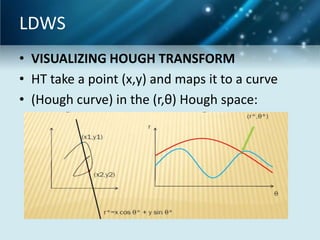
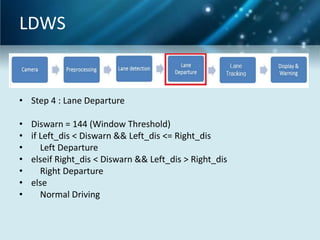
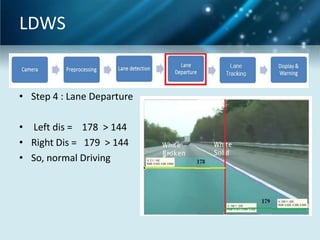
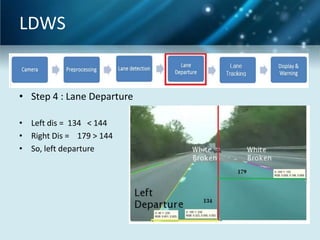
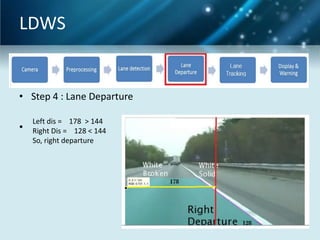
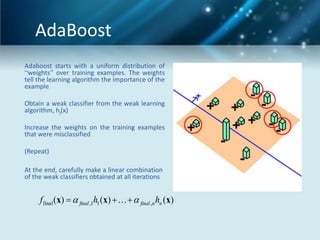
• Step 3.1 : Lane Extraction
–
–
–
–
2D FIR filter with mask [-1 0 1]
Hough Transform
LocalMaxFinder
20 candidate lanes
• Step 3.2 : Lane Identification
– Comparing with previous lanes
– Polar to Cartesian](https://image.slidesharecdn.com/mvsadas-131103222317-phpapp01/85/Mvs-adas-18-320.jpg)
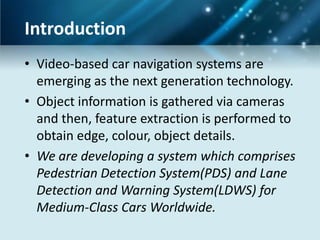
![adaboost
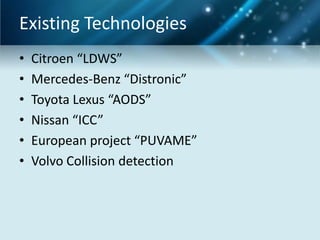
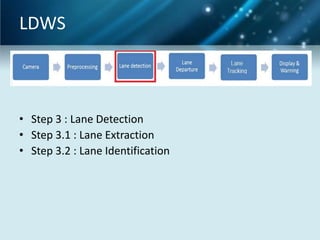
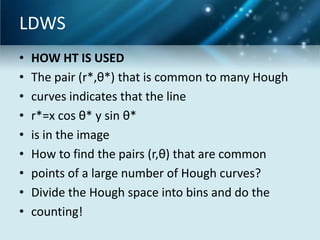
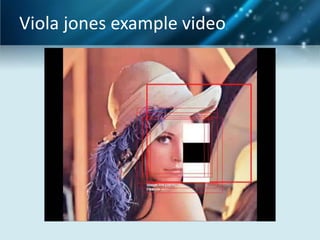
• Step 1 :
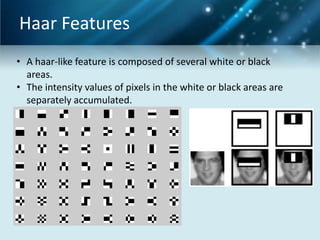
– select the features with the different forms and types.
These are the basic features types. We can construct
nearly 1000`s of features using only few of them.
– E.g.: There are 5 rectangles associated with haar features
–
–
–
–
–
–
–
–
feature = [1 2; 2 1; 1 3; 3 1; 2 2];
frameSize = 20;
PosImgSize = 200;
NegImgSize = 400;
posWeights = ones(1,PosImgSize)/PosImgSize;
negWeights = ones(1,NegImgSize)/NegImgSize;
% Weights of training set
adaWeights = [posWeights negWeights] ;](https://image.slidesharecdn.com/mvsadas-131103222317-phpapp01/85/Mvs-adas-28-320.jpg)


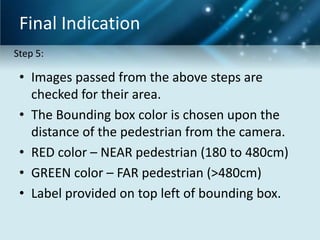
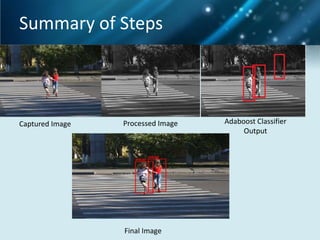
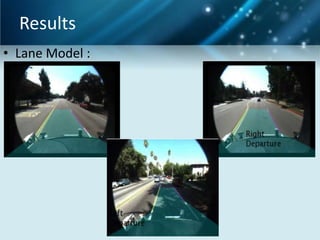
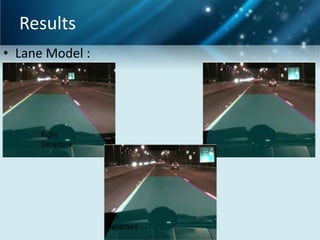
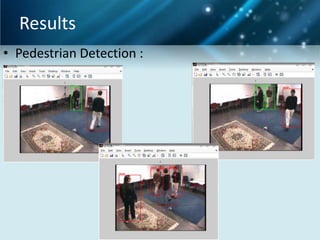
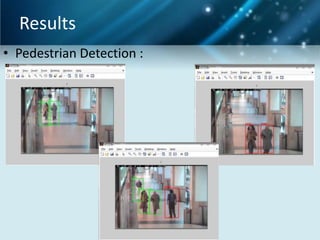
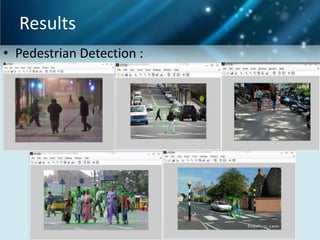
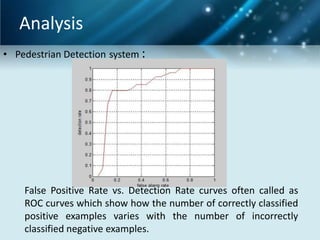
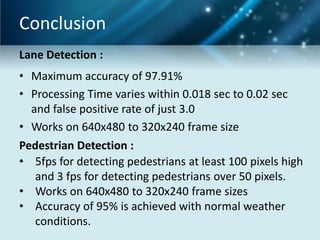
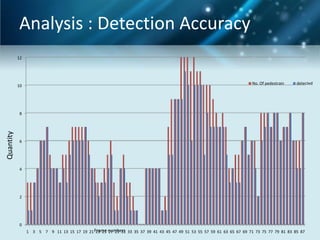

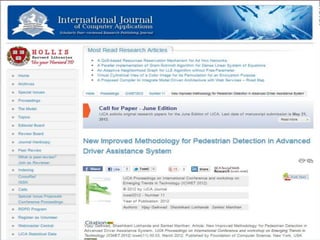


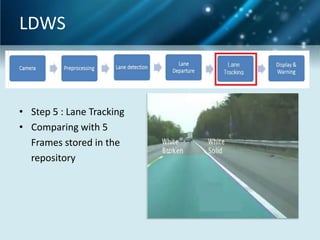
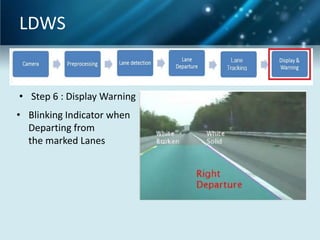
This document describes a project to develop a pedestrian detection system and lane detection and warning system for medium-class cars. It is created by group members Sanket R. Borhade, Manthan N. Shah, and Pravin D. Jadhav. The document outlines the need for such systems to reduce traffic accidents and pedestrian fatalities. It then describes the existing technologies for lane detection and pedestrian detection systems. The document provides detailed explanations of the methods and algorithms used in their proposed lane detection system, including Hough transforms and lane identification. It also explains the use of Haar features, AdaBoost, and edgelet features in their proposed pedestrian detection system. Finally, it presents results from testing their systems and