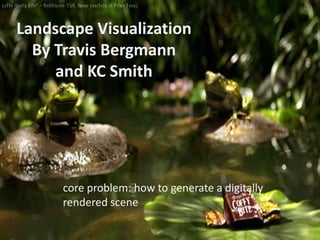
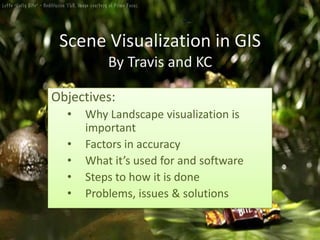
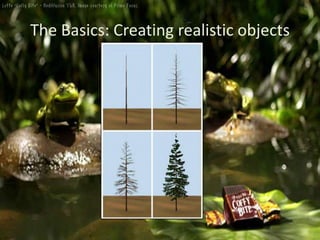
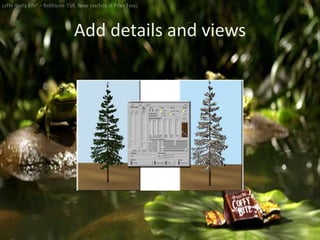
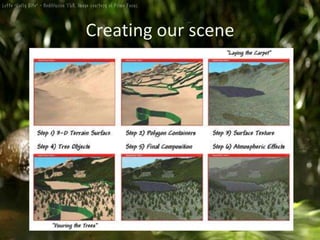
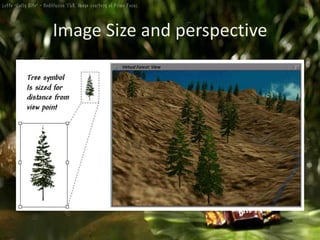
Landscape Visualization By Travis Bergmannand KC Smithcore problem: how to generate a digitally rendered scene
Scene Visualization in GIS By Travis and KCObjectives:Why Landscape visualization is important
Factors in accuracy
What it’s used for and software
Steps to how it is done
Problems, issues & solutionsArchitecture example
IntroductionIn the past the focus of map making has been on creating a representation that looks like the world around us. Map making has developed into GIS, a GIS allows users to create maps that are based on spatial data, and this has allowed for more intelligent representations to be produced. The next step in the development of maps is Landscape Visualization. Landscape visualization uses that spatial data and this will allow a GIS to creating a representation that not only looks like the world but also Acts like the real world. This presentation will answer the What, Why, and How questions surrounding Landscape Visualization.
Why is landscape visualization important?Real life representation of data in a format that is easily understood
Uses in industryVisualization, Visualization, VisualizationTransportationArchitectureArchaeologyMappingTime lapse imageryMilitary trainingUrban planningScientific imagingEtc…..
Software Examples
Data TypesData sources vary.  Many different types of data can be used to create one of these visualizations.  The more data you have the more accurate you can make it.3D modelsCAD dataDigital photographyGIS dataPlans, profiles and elevationsProject address or location
PricingTo have a professional create a scene for you:$5000-$15000 for a 30sec 3D animation.$1000-$4000 for a single still image
How it’s madeGeometric Modeling		Lets look at how we make an object.

3d visualization ppt

  • 1.
    Landscape Visualization ByTravis Bergmannand KC Smithcore problem: how to generate a digitally rendered scene
  • 2.
    Scene Visualization inGIS By Travis and KCObjectives:Why Landscape visualization is important
  • 3.
  • 4.
    What it’s usedfor and software
  • 5.
    Steps to howit is done
  • 6.
    Problems, issues &solutionsArchitecture example
  • 7.
    IntroductionIn the pastthe focus of map making has been on creating a representation that looks like the world around us. Map making has developed into GIS, a GIS allows users to create maps that are based on spatial data, and this has allowed for more intelligent representations to be produced. The next step in the development of maps is Landscape Visualization. Landscape visualization uses that spatial data and this will allow a GIS to creating a representation that not only looks like the world but also Acts like the real world. This presentation will answer the What, Why, and How questions surrounding Landscape Visualization.
  • 8.
    Why is landscapevisualization important?Real life representation of data in a format that is easily understood
  • 9.
    Uses in industryVisualization,Visualization, VisualizationTransportationArchitectureArchaeologyMappingTime lapse imageryMilitary trainingUrban planningScientific imagingEtc…..
  • 10.
  • 11.
    Data TypesData sourcesvary. Many different types of data can be used to create one of these visualizations. The more data you have the more accurate you can make it.3D modelsCAD dataDigital photographyGIS dataPlans, profiles and elevationsProject address or location
  • 12.
    PricingTo have aprofessional create a scene for you:$5000-$15000 for a 30sec 3D animation.$1000-$4000 for a single still image
  • 13.
    How it’s madeGeometricModeling Lets look at how we make an object.

Editor's Notes

  • #5 Ideas about Landscape Visualization Large-scale projection-based visualization systems provide users with a unique feeling of immersion and the possibility of providing them with an impression of the real-world size of objects. This can be used to help the general public to participate in landscape planning issues.Scientists and planners may seek to model landscapes and landscape processes so as to be able to simulate or understand them, exploring scientific hypotheses, or measuring aspects of quantitative simulations, such as soil erosion, hydrologic process, or vegetative succession.The purpose of visualization is to provide users with an improved insight into complex systems. The strength of quality visualization lies in its ability to reveal the underlying mechanisms and phenomena with useful outputs. Depending on the model it is used with, it may predict the future state of the ecosystem or restore the history of the forest or landscape.
  • #6 So what are we talking about exactly? Well let’s take a look; The traditions of Geographic analysis have heavily used 2D maps showing us features and conditions as abstract images on paper. Technology has allowed us to go from 2D to interactive 3D images on a screen. Essentially the data in the background is the same; we just do more with it.
  • #7 Visualization of data. You can do anything from recreate an architectural site to creating a future scene such as a new development. It gives you an impression of the scene being real by relating size to known objects. Aspects that need to be carefully planned are the movement through the landscape, movement with the landscape and movement of landscape. So what does that mean? Moving through the landscape is making the movement through the scene look realistic and smooth. Movement with the landscape includes things like floating down a river. Used for demonstrations allowing you visualize complex ideas in a manner familiar to you and your clients. Marketing, Public Relations, Community Involvement, Design ReviewReplication of natural eventsLandscapes
  • #9 Data sources vary. Many different types of data can be used to create one of these visualizations. The more data you have the more accurate you can make it.3D modelsCAD dataDigital photographyGIS dataPlans, profiles and elevationsProject address or location
  • #10 Because A project will be rendered many times to ensure that movement, shadow, textures etc… are perfect, a project will take a very long time to produce and hence a lot of money to make. The speed and processing capability of your hardware is the main determining factor in the speed. Say you are creating a scene that is 1.5 hour long, so 90 minutes or 5400 seconds. At 30 frames per sec, that would give you roughly 162000 frames. If your system can/could render a full, single frame every 10 seconds, with Povray, Bryce, or other animation tool.....it would take about 450 hours of render time, ~20 days....
  • #11 Need to translate the data into an object that looks and acts realistic. It has to feel like the object to make it seem realistic. You do this by combining objects with textures (clouds, soil, grass, sky etc…)Geometric ModellingUses an interface similar to that in 3D CAD to make individual scene elementsSet the size, shape, orientation, colour etc…..
  • #12 This is CRITICAL for 3D rendering of a virtual landscape.Designate your layer levels.Design Trunk and deSize till satisfied that it represents your treeLinear positioning  how often and where branches occurAngular Positioning and how often branches occur around trunk. Are they bunched or spaced.Add Primary branching and its patternAdd secondary branching and its patternAdd tertiary branchingAdd levels of branching till finishedAdd leaves/needles
  • #13 Orientation. Do branches droop and where on tree do they droop.Sizing. Length and taper of branchesRepresentation of objectHow branch appears when displayed (stick, leaf, textured, crown),Degree of randomness, 24 bit RGB Raster,Colour of leaves/needles, bark, snow, disease
  • #15 Once our object is designed you need to plot objects in perspective. Algorithms can be used that take into calculate the size of the object with respect to distance from the view point. Then the object is scaled to give a realistic representation and placed.
  • #17 The main issues in visualization are in obtaining Data. A major obstacle in developing quality visualizationsis related to the availability of appropriate information. Available data do not meet the requirement for developing quality visualizations. For example, most current forest inventory and vegetation data are maintained at abstract levels with focus on mean volumes, diameters, and ages. The natural world is continuously changing and in order to have an accurate representation of the world (which is the point of visualization) then baseline data needs to be frequently updated.
  • #18 Most Issues and Problems are solved by determining how much error or inaccuracy you are willing to accept in your Model!Snowis different day to day, year to year. You may get snow earlier one year than normal and later than normal the next. How accurate can the visual representation be if you can not accurately predict how high the snow is. It also tends to have specific accumulation patterns that vary depending on circumstance, avalanche, wind, distribution from the sky, even glacier location. You, as the designer combined with input from your clients (whether it is your employer or customer) need to determine if it is worth putting snow in the visualization.Vegetation changesVegetation varies for many reasons. In the fall deciduous trees loose their leaves, in the summer there may be forest fires that burn needles, leaves and underbrush, the spring may be especially cold and foliage comes out late, summer may be especially dry and leaves drop early etc... There are ways to correct for these things with aerial photography and creating a raster to overlay your model and compare but that requires money, so again, how much error are you willing to accept in the model.Visualization QualityHow much money can you afford to put out on the project. Video games and military simulations have a lot of money to put out for the hardware and software needed to create super smooth and detailed models but how many resource companies require that level of interaction and detail?
  • #19 Legitimacy.Visualization should be defensible; visualizations used should be driven by data, not by artistic license.Accuracy.Visualizations should represent the actual appearance of the landscape, at least for those factors being judged. However, accuracy is scale dependent, and the proper resolution and extent need to be carefully determined with trial simulations Representativeness.Visualizations should be adequate enough to represent the dependant variable in question. The dominant vegetation or tree species in a stand or in ecosystems across the landscape is a good place to start to see if it represents our forest stands. Then, we can ask, are there any features or processes that are not included that would help us better represent the phenomena we wish to study?Realism and Visual Clarity. The details (e.g., composition) of the visualization should be clearly distinguishable. When visualizing a forest landscape, the following parameters should be used as indicators of its clarity. Those measurements that can be used to describe a real forest, such as tree heights, stem density, and crown density also should describe a virtual forest. Measures unique to computer representation such as being able to distinguish colors and shapes of the plants and physiographic features of the land also are important for visual clarity
  • #23 Answer: c) The amount of accuracy you need/want. You can have the best GIS, the best software and hardware and all the money and time you need to make it but if you don’t want it to have top of the line accuracy there is no point putting the effort into it.
  • #24 B) False: Even though it takes much less time to create a scene then it did 10 years ago, it is still a timely process. For example the making of Monster’s inc (Not even a gis produced movie) took 3 years to produce. This is because you will render each scene multiple times to get all movement, shadows, textures etc.. Many times before finishing it.
  • #25 b) To create a single object to put on your map you first create your most basic structure for the objects frame; Tree trunk, skeleton etc…. Then you want to build on that base structure adding features like branches or muscles until it is finished. Then you determine lighting and shadowing needed (seasonal lighting, time of the day lighting). Then figure out where you will be viewing the object from.
  • #26 a) 3D studio max is one of two products offered by Auto cad for generating 3d imagery.
  • #27 e) All of these types of data can be used in the creation of a GIS scene visualization.