Download as PDF, PPTX

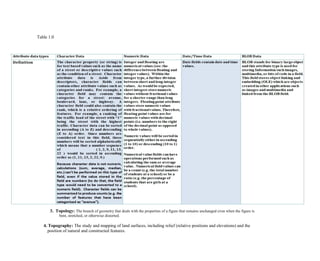
![vectorized using the scanned images. The source of these digital maps can be either map prepared by any survey
agency or satellite imagery.
Phrases:
There are some phrases that good to know in GIS filed such as:
1. Cartography: Are the creation and the study of maps and charts, in old days they had to store information for a
long time because that information was needed for a long time. In modern cartography, the map has an increasing
number of functions. Besides being an artifact, a modern map is also an interface that gives people access to
information stored in the map and—beyond the map—in databases. But now a days by using new technologies and
sciences such as computer sciences, GIS, photogrammetric, remote sensing, geodesy, design, art, modeling, and
analysis techniques. all of these things ease the Cartography process. In other words (simply) it's the art of
delivering maps with correct data, colors and images that describe land marks.
The art and science of expressing graphically, usually through maps, the natural and social features of the
earth. [ESRI]
Relationship between GIS and Cartography:
Cartographic organizations and data publishers must be able to produce professional, standardized maps from their
libraries of data. GIS provides database-driven cartography that creates sophisticated, high-end cartographic
production tools and workflows allowing these agencies to more easily and efficiently create the products they
need.
GIS helps cartographic organizations do the following:
Automate tasks and implement user-defined cartographic rules.
Override cartographic conventions for individual preferences or requirements.
Reduce map production costs.
Produce a more flexible range of products.
Achieve a higher throughput to meet publishing deadline.
2. Types of data:
GIS data can be divided into:
Attribute Data: is information appended in tabular format to spatial features. Attribute data provides
characteristics about spatial data. Attribute data can be one of the five types as described in table 1.0.](https://image.slidesharecdn.com/introductio1-170504173845/85/GIS-in-Nutshell-5-320.jpg)
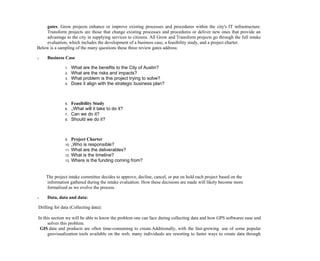

GIS (Geographic Information Systems) is a system that integrates hardware, software, and data to capture, store, analyze and display spatial or geographic data. It allows users to view, understand, question, interpret, and visualize data in many ways that reveal relationships, patterns, and trends. Key components of a GIS include hardware, software, data, people, and methods. The document then provides examples of each component and defines common GIS terms like cartography, data types, topology, and benefits of using GIS for spatial analysis and decision making.


