Download as PDF, PPTX


![How decision trees work
Using a decision tree
Simple example:
Event attendance: binary classification
2 explanatory variables: age and distance
from sklearn.tree import DecisionTreeClassifier
dtree = DecisionTreeClassifier()
dtree.fit(df[[’age’, ’distance’]], df[’attended’])
cart_plot(dtree)
6 / 44
Understanding Random Forests - Marc Garcia](https://image.slidesharecdn.com/understandingrandomforests-160411192802/85/Understanding-random-forests-6-320.jpg)


![How decision trees work
Training: Basic algorithm
def train_decision_tree(x, y):
feature, value = get_best_split(x, y)
x_left, y_left = x[x[feature] < value], y[x[feature] < value]
if len(y_left.unique()) > 1:
left_node = train_decision_tree(x_left, y_left)
else:
left_node = None
x_right, y_right = x[x[feature] >= value], y[x[feature] >= value]
if len(y_right.unique()) > 1:
right_node = train_decision_tree(x_right, y_right)
else:
right_node = None
return Node(feature, value, left_node, right_node)
15 / 44
Understanding Random Forests - Marc Garcia](https://image.slidesharecdn.com/understandingrandomforests-160411192802/85/Understanding-random-forests-15-320.jpg)

![How decision trees work
Best split algorithm
def get_best_split(x, y):
best_split = None
best_entropy = 1.
for feature in x.columns.values:
column = x[feature]
for value in column.iterrows():
a = y[column < value] == class_a_value
b = y[column < value] == class_b_value
left_weight = (a + b) / len(y.index)
left_entropy = entropy(a, b)
a = y[column >= value] == class_a_value
b = y[column >= value] == class_b_value
right_items = (a + b) / len(y.index)
right_entropy = entropy(a, b)
split_entropy = left_weight * left_etropy + right_weight * right_entropy
if split_entropy < best_entropy:
best_split = (feature, value)
best_entropy = split_entropy
return best_split
17 / 44
Understanding Random Forests - Marc Garcia](https://image.slidesharecdn.com/understandingrandomforests-160411192802/85/Understanding-random-forests-17-320.jpg)


![Training Random Forests
Parameter optimization (Bank marketing)
Data source: [Moro et al., 2014] S. Moro, P. Cortez and P. Rita.
A Data-Driven Approach to Predict the Success of Bank Telemarketing. Decision Support Systems, Elsevier, 62:22-31, June 2014
41 / 44
Understanding Random Forests - Marc Garcia](https://image.slidesharecdn.com/understandingrandomforests-160411192802/85/Understanding-random-forests-41-320.jpg)


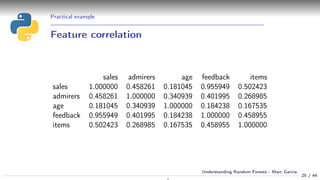
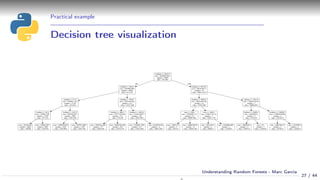
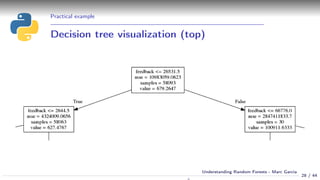
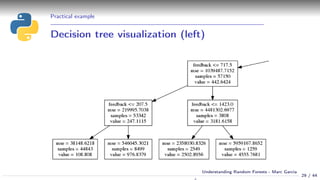
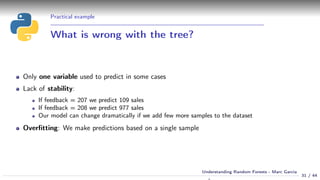
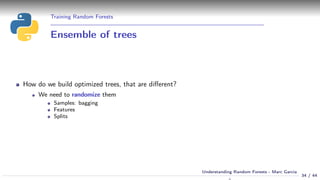
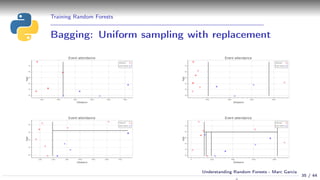
The document is a presentation by Marc Garcia about understanding random forests, covering decision trees, training methods, and practical examples using datasets. It explains how decision trees function, the importance of ensemble methods like bagging, and challenges such as overfitting. The document concludes with recommendations for using random forests and highlights their advantages over single decision trees.